

Key Insights
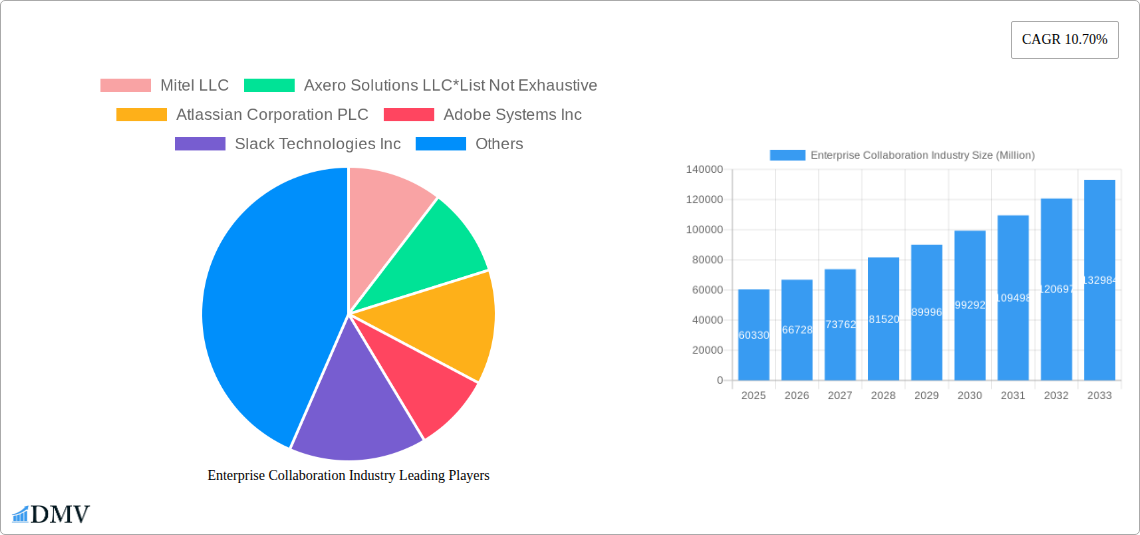
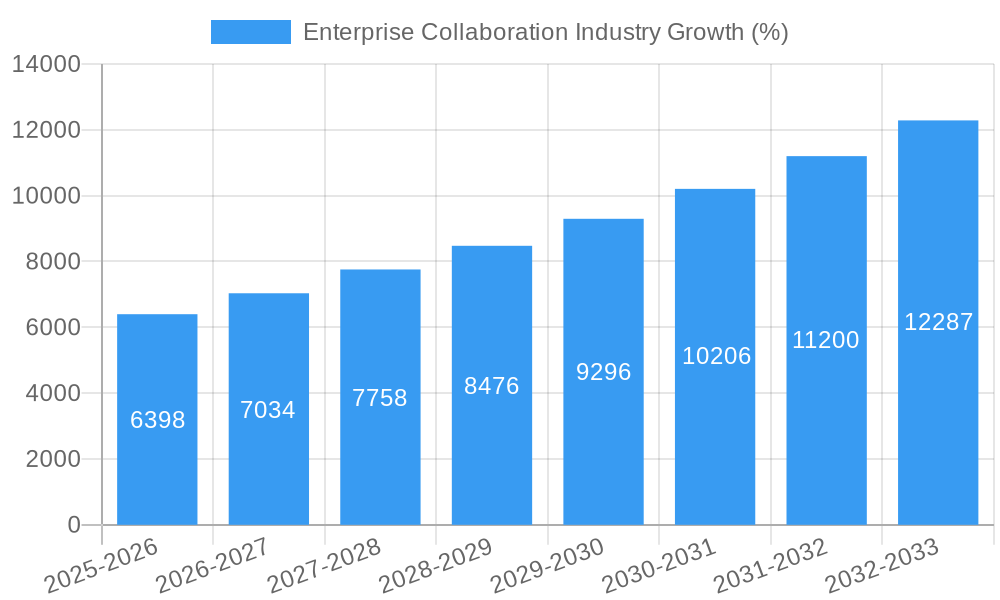
The Enterprise Collaboration market, valued at $60.33 billion in 2025, is experiencing robust growth, projected to expand at a Compound Annual Growth Rate (CAGR) of 10.70% from 2025 to 2033. This expansion is fueled by several key drivers. The increasing adoption of cloud-based solutions offers scalability, flexibility, and cost-effectiveness, driving significant market penetration. Furthermore, the rise of remote work and hybrid work models necessitates robust communication and collaboration tools, boosting demand for platforms offering seamless integration and enhanced productivity features. The integration of artificial intelligence (AI) and machine learning (ML) within these platforms is further accelerating growth, enabling features such as intelligent task management, improved communication analysis, and enhanced security protocols. While data security concerns and the complexity of integrating various collaboration tools remain potential restraints, the overall market outlook remains positive, driven by continuous innovation and expanding user adoption across diverse industries.
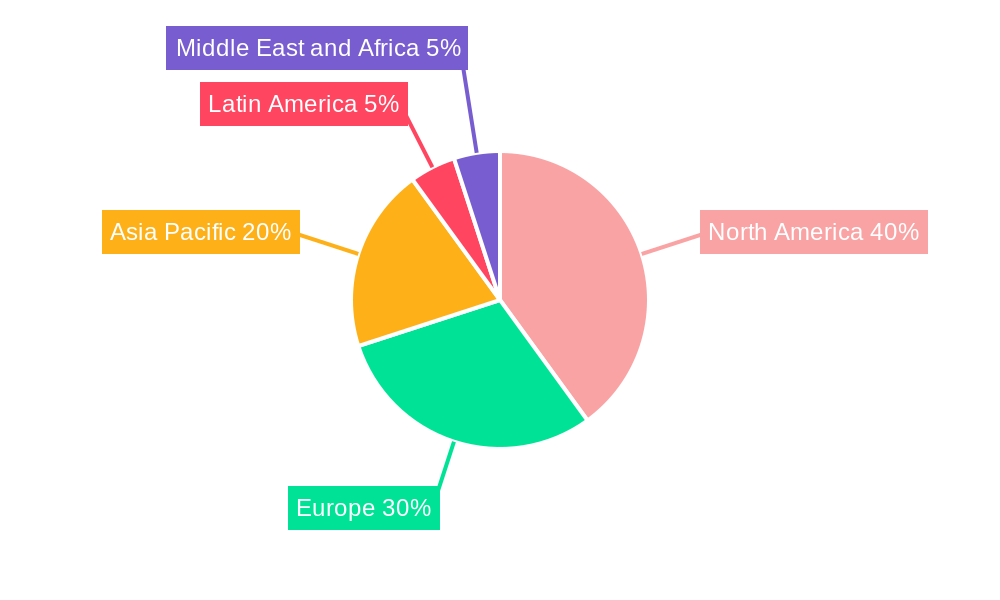
The market segmentation reveals a diverse landscape. Cloud-based deployment is anticipated to maintain its dominance due to its inherent advantages. In terms of applications, communication tools (such as instant messaging and email integration) and conferencing tools (video conferencing and web conferencing) are major revenue drivers. Across end-user industries, Telecommunications and IT, BFSI (Banking, Financial Services, and Insurance), and the Education sector are key contributors to market growth. However, steady growth is also observed across other sectors like Travel and Hospitality, Retail, Healthcare, and Transportation and Logistics, indicating the widespread adoption of enterprise collaboration solutions as a crucial component of modern business operations. Major players like Microsoft, Salesforce, Cisco, and others are continually enhancing their offerings, fostering competition and driving innovation within the market. Geographic expansion, particularly in the Asia-Pacific region, is expected to contribute significantly to the overall market expansion over the forecast period.
Enterprise Collaboration Industry Market Report: 2019-2033
This comprehensive report provides an in-depth analysis of the Enterprise Collaboration Industry, projecting a market value exceeding $XXX Million by 2033. The study covers the period from 2019 to 2033, with 2025 serving as both the base and estimated year. We delve into market segmentation, key players, technological advancements, and future growth prospects, offering invaluable insights for stakeholders across the industry.
Enterprise Collaboration Industry Market Composition & Trends
This section evaluates the competitive landscape, examining market concentration, innovation drivers, regulatory frameworks, substitute products, end-user profiles, and merger & acquisition (M&A) activities within the $XXX Million Enterprise Collaboration market. The report analyzes market share distribution among key players, including but not limited to Mitel LLC, Axero Solutions LLC, Atlassian Corporation PLC, Adobe Systems Inc, Slack Technologies Inc, TIBCO Software Inc, IBM Corporation, Jive Software, Polycom Inc, Microsoft Corporation, Salesforce Com Inc, Zoho Corporation Pvt Ltd, Huawei Technologies Co Ltd, Cisco System Inc, and SAP SE.
- Market Concentration: The market exhibits a [High/Medium/Low] level of concentration, with the top five players holding an estimated [XX]% market share in 2024.
- Innovation Catalysts: Key drivers include the rising adoption of cloud-based solutions, AI-powered features, and increasing demand for enhanced security and integration capabilities.
- Regulatory Landscape: Government regulations concerning data privacy and security significantly influence market dynamics, particularly in regions like [mention specific regions].
- Substitute Products: Open-source collaboration platforms and legacy communication systems represent key substitutes, although their functionalities often lack the sophistication of commercial solutions.
- End-User Profiles: The report profiles end-users across diverse sectors, including Telecommunications and IT, BFSI, Healthcare, Retail and Consumer Goods, and more. Analysis of their specific needs and adoption rates is provided.
- M&A Activity: The report details significant M&A transactions in the industry during the historical period (2019-2024), including deal values totaling an estimated $XXX Million. This section further analyzes the impact of these transactions on market consolidation and competitive dynamics.
Enterprise Collaboration Industry Industry Evolution
This section analyzes the evolution of the Enterprise Collaboration market, charting its growth trajectory from 2019 to 2033. We explore the impact of technological advancements, such as the rise of AI and machine learning, and the changing demands of end-users. The market demonstrated a Compound Annual Growth Rate (CAGR) of [XX]% during the historical period (2019-2024), with projections indicating a CAGR of [XX]% during the forecast period (2025-2033). This growth is attributed to factors such as the increasing adoption of remote work models, the need for improved communication and coordination among geographically dispersed teams, and the expanding applications of enterprise collaboration tools across various industry verticals. The report further examines the shift from on-premise to cloud-based deployments, outlining adoption rates and projected market share for each deployment type. Specific data points on the adoption of key features like video conferencing, instant messaging, and project management tools are also included, providing a comprehensive understanding of evolving consumer preferences and industry trends.
Leading Regions, Countries, or Segments in Enterprise Collaboration Industry
This section identifies the dominant regions, countries, and segments within the Enterprise Collaboration market.
By Deployment Type:
- Cloud-based: This segment is expected to dominate the market, driven by scalability, cost-effectiveness, and enhanced accessibility.
- On-premise: This segment is expected to experience slower growth, primarily due to higher infrastructure costs and maintenance requirements.
By Application:
- Communication Tools: High demand for seamless communication across teams drives robust growth in this segment.
- Conferencing Tools: The increasing adoption of video conferencing and web conferencing fuels this segment’s expansion.
- Coordination Tools: Growing need for efficient project management and task allocation fuels the growth of this segment.
By End-user Industry:
- Telecommunications and IT: This segment consistently shows high adoption rates due to the industry's inherent reliance on seamless collaboration.
- BFSI: Stringent regulatory requirements and the need for secure communication drive significant growth in this sector.
- Healthcare: The increasing emphasis on patient care coordination and interoperability fuels growth in this sector.
Key Drivers: Investment in digital transformation initiatives across various sectors and supportive government policies encouraging technological adoption are key drivers for the growth of the Enterprise Collaboration market in the leading segments and regions.
Enterprise Collaboration Industry Product Innovations
Recent innovations include AI-powered features such as intelligent assistants, automated workflows, and advanced analytics capabilities integrated into collaboration platforms. These enhancements aim to improve productivity, enhance communication efficiency, and provide more insightful data analysis for businesses. Unique selling propositions (USPs) increasingly focus on seamless integration with existing enterprise systems, robust security features, and user-friendly interfaces.
Propelling Factors for Enterprise Collaboration Industry Growth
Several factors fuel the growth of the Enterprise Collaboration market. Firstly, the widespread adoption of remote and hybrid work models necessitates efficient communication and collaboration tools. Secondly, technological advancements, particularly in AI and cloud computing, continuously enhance the capabilities and accessibility of these platforms. Lastly, supportive government regulations and initiatives promoting digital transformation further accelerate market expansion.
Obstacles in the Enterprise Collaboration Industry Market
Challenges include ensuring data security and privacy in a decentralized work environment, addressing potential integration complexities with existing enterprise systems, and managing the ongoing cost of platform maintenance and upgrades. Competition among numerous vendors also adds pressure on pricing and market share.
Future Opportunities in Enterprise Collaboration Industry
Future opportunities lie in expanding into emerging markets, developing AI-powered solutions that enhance productivity and decision-making, and integrating with emerging technologies such as the metaverse and extended reality (XR). Customization options tailored to specific industry needs represent a substantial growth opportunity.
Major Players in the Enterprise Collaboration Industry Ecosystem
- Mitel LLC
- Axero Solutions LLC
- Atlassian Corporation PLC
- Adobe Systems Inc
- Slack Technologies Inc
- TIBCO Software Inc
- IBM Corporation
- Jive Software
- Polycom Inc
- Microsoft Corporation
- Salesforce Com Inc
- Zoho Corporation Pvt Ltd
- Huawei Technologies Co Ltd
- Cisco System Inc
- SAP SE
Key Developments in Enterprise Collaboration Industry Industry
- April 2023: Google Cloud launched an AI-enabled platform for prior authorization and claims processing, significantly impacting healthcare collaboration.
- February 2022: IceWarp expanded its presence in the Middle East, showcasing the growing demand for affordable and integrated communication solutions in the region.
Strategic Enterprise Collaboration Industry Market Forecast
The Enterprise Collaboration market is poised for significant growth, driven by the ongoing digital transformation across industries and the increasing adoption of remote and hybrid work models. Future opportunities lie in leveraging AI, expanding into untapped markets, and developing innovative solutions to enhance communication and collaboration efficiencies. The market's strong growth trajectory is expected to continue, exceeding $XXX Million by 2033, presenting substantial opportunities for market participants.
Enterprise Collaboration Industry Segmentation
-
1. Deployment Type
- 1.1. On-premise
- 1.2. Cloud-based
-
2. Application
- 2.1. Communication Tools
- 2.2. Conferencing Tools
- 2.3. Coordination Tools
-
3. End-user Industry
- 3.1. Telecommunications and IT
- 3.2. Travel and Hospitality
- 3.3. BFSI
- 3.4. Retail and Consumer Goods
- 3.5. Education
- 3.6. Transportation and Logistics
- 3.7. Healthcare
- 3.8. Other End-user Industries
Enterprise Collaboration Industry Segmentation By Geography
-
1. North America
- 1.1. United States
- 1.2. Canada
-
2. Europe
- 2.1. United Kingdom
- 2.2. Germany
- 2.3. France
- 2.4. Spain
-
3. Asia
- 3.1. China
- 3.2. Japan
- 3.3. India
- 3.4. South Korea
- 4. Australia and New Zealand
- 5. Latin America
- 6. Middle East and Africa
Enterprise Collaboration Industry REPORT HIGHLIGHTS
| Aspects | Details |
|---|---|
| Study Period | 2019-2033 |
| Base Year | 2024 |
| Estimated Year | 2025 |
| Forecast Period | 2025-2033 |
| Historical Period | 2019-2024 |
| Growth Rate | CAGR of 10.70% from 2019-2033 |
| Segmentation |
|
Table of Contents
- 1. Introduction
- 1.1. Research Scope
- 1.2. Market Segmentation
- 1.3. Research Methodology
- 1.4. Definitions and Assumptions
- 2. Executive Summary
- 2.1. Introduction
- 3. Market Dynamics
- 3.1. Introduction
- 3.2. Market Drivers
- 3.2.1. API Integration for Greater Efficiency; Increase in Usage of Mobile Devices for Time Management
- 3.3. Market Restrains
- 3.3.1. Data Security While Deploying SDDC is a Major Challenge
- 3.4. Market Trends
- 3.4.1. Cloud-based Deployment to Increase the Market Growth
- 4. Market Factor Analysis
- 4.1. Porters Five Forces
- 4.2. Supply/Value Chain
- 4.3. PESTEL analysis
- 4.4. Market Entropy
- 4.5. Patent/Trademark Analysis
- 5. Global Enterprise Collaboration Industry Analysis, Insights and Forecast, 2019-2031
- 5.1. Market Analysis, Insights and Forecast - by Deployment Type
- 5.1.1. On-premise
- 5.1.2. Cloud-based
- 5.2. Market Analysis, Insights and Forecast - by Application
- 5.2.1. Communication Tools
- 5.2.2. Conferencing Tools
- 5.2.3. Coordination Tools
- 5.3. Market Analysis, Insights and Forecast - by End-user Industry
- 5.3.1. Telecommunications and IT
- 5.3.2. Travel and Hospitality
- 5.3.3. BFSI
- 5.3.4. Retail and Consumer Goods
- 5.3.5. Education
- 5.3.6. Transportation and Logistics
- 5.3.7. Healthcare
- 5.3.8. Other End-user Industries
- 5.4. Market Analysis, Insights and Forecast - by Region
- 5.4.1. North America
- 5.4.2. Europe
- 5.4.3. Asia
- 5.4.4. Australia and New Zealand
- 5.4.5. Latin America
- 5.4.6. Middle East and Africa
- 5.1. Market Analysis, Insights and Forecast - by Deployment Type
- 6. North America Enterprise Collaboration Industry Analysis, Insights and Forecast, 2019-2031
- 6.1. Market Analysis, Insights and Forecast - by Deployment Type
- 6.1.1. On-premise
- 6.1.2. Cloud-based
- 6.2. Market Analysis, Insights and Forecast - by Application
- 6.2.1. Communication Tools
- 6.2.2. Conferencing Tools
- 6.2.3. Coordination Tools
- 6.3. Market Analysis, Insights and Forecast - by End-user Industry
- 6.3.1. Telecommunications and IT
- 6.3.2. Travel and Hospitality
- 6.3.3. BFSI
- 6.3.4. Retail and Consumer Goods
- 6.3.5. Education
- 6.3.6. Transportation and Logistics
- 6.3.7. Healthcare
- 6.3.8. Other End-user Industries
- 6.1. Market Analysis, Insights and Forecast - by Deployment Type
- 7. Europe Enterprise Collaboration Industry Analysis, Insights and Forecast, 2019-2031
- 7.1. Market Analysis, Insights and Forecast - by Deployment Type
- 7.1.1. On-premise
- 7.1.2. Cloud-based
- 7.2. Market Analysis, Insights and Forecast - by Application
- 7.2.1. Communication Tools
- 7.2.2. Conferencing Tools
- 7.2.3. Coordination Tools
- 7.3. Market Analysis, Insights and Forecast - by End-user Industry
- 7.3.1. Telecommunications and IT
- 7.3.2. Travel and Hospitality
- 7.3.3. BFSI
- 7.3.4. Retail and Consumer Goods
- 7.3.5. Education
- 7.3.6. Transportation and Logistics
- 7.3.7. Healthcare
- 7.3.8. Other End-user Industries
- 7.1. Market Analysis, Insights and Forecast - by Deployment Type
- 8. Asia Enterprise Collaboration Industry Analysis, Insights and Forecast, 2019-2031
- 8.1. Market Analysis, Insights and Forecast - by Deployment Type
- 8.1.1. On-premise
- 8.1.2. Cloud-based
- 8.2. Market Analysis, Insights and Forecast - by Application
- 8.2.1. Communication Tools
- 8.2.2. Conferencing Tools
- 8.2.3. Coordination Tools
- 8.3. Market Analysis, Insights and Forecast - by End-user Industry
- 8.3.1. Telecommunications and IT
- 8.3.2. Travel and Hospitality
- 8.3.3. BFSI
- 8.3.4. Retail and Consumer Goods
- 8.3.5. Education
- 8.3.6. Transportation and Logistics
- 8.3.7. Healthcare
- 8.3.8. Other End-user Industries
- 8.1. Market Analysis, Insights and Forecast - by Deployment Type
- 9. Australia and New Zealand Enterprise Collaboration Industry Analysis, Insights and Forecast, 2019-2031
- 9.1. Market Analysis, Insights and Forecast - by Deployment Type
- 9.1.1. On-premise
- 9.1.2. Cloud-based
- 9.2. Market Analysis, Insights and Forecast - by Application
- 9.2.1. Communication Tools
- 9.2.2. Conferencing Tools
- 9.2.3. Coordination Tools
- 9.3. Market Analysis, Insights and Forecast - by End-user Industry
- 9.3.1. Telecommunications and IT
- 9.3.2. Travel and Hospitality
- 9.3.3. BFSI
- 9.3.4. Retail and Consumer Goods
- 9.3.5. Education
- 9.3.6. Transportation and Logistics
- 9.3.7. Healthcare
- 9.3.8. Other End-user Industries
- 9.1. Market Analysis, Insights and Forecast - by Deployment Type
- 10. Latin America Enterprise Collaboration Industry Analysis, Insights and Forecast, 2019-2031
- 10.1. Market Analysis, Insights and Forecast - by Deployment Type
- 10.1.1. On-premise
- 10.1.2. Cloud-based
- 10.2. Market Analysis, Insights and Forecast - by Application
- 10.2.1. Communication Tools
- 10.2.2. Conferencing Tools
- 10.2.3. Coordination Tools
- 10.3. Market Analysis, Insights and Forecast - by End-user Industry
- 10.3.1. Telecommunications and IT
- 10.3.2. Travel and Hospitality
- 10.3.3. BFSI
- 10.3.4. Retail and Consumer Goods
- 10.3.5. Education
- 10.3.6. Transportation and Logistics
- 10.3.7. Healthcare
- 10.3.8. Other End-user Industries
- 10.1. Market Analysis, Insights and Forecast - by Deployment Type
- 11. Middle East and Africa Enterprise Collaboration Industry Analysis, Insights and Forecast, 2019-2031
- 11.1. Market Analysis, Insights and Forecast - by Deployment Type
- 11.1.1. On-premise
- 11.1.2. Cloud-based
- 11.2. Market Analysis, Insights and Forecast - by Application
- 11.2.1. Communication Tools
- 11.2.2. Conferencing Tools
- 11.2.3. Coordination Tools
- 11.3. Market Analysis, Insights and Forecast - by End-user Industry
- 11.3.1. Telecommunications and IT
- 11.3.2. Travel and Hospitality
- 11.3.3. BFSI
- 11.3.4. Retail and Consumer Goods
- 11.3.5. Education
- 11.3.6. Transportation and Logistics
- 11.3.7. Healthcare
- 11.3.8. Other End-user Industries
- 11.1. Market Analysis, Insights and Forecast - by Deployment Type
- 12. North America Enterprise Collaboration Industry Analysis, Insights and Forecast, 2019-2031
- 12.1. Market Analysis, Insights and Forecast - By Country/Sub-region
- 12.1.1 United States
- 12.1.2 Canada
- 13. Europe Enterprise Collaboration Industry Analysis, Insights and Forecast, 2019-2031
- 13.1. Market Analysis, Insights and Forecast - By Country/Sub-region
- 13.1.1 United Kingdom
- 13.1.2 Germany
- 13.1.3 France
- 13.1.4 Spain
- 14. Asia Pacific Enterprise Collaboration Industry Analysis, Insights and Forecast, 2019-2031
- 14.1. Market Analysis, Insights and Forecast - By Country/Sub-region
- 14.1.1 China
- 14.1.2 Japan
- 14.1.3 India
- 14.1.4 South Korea
- 15. Latin America Enterprise Collaboration Industry Analysis, Insights and Forecast, 2019-2031
- 15.1. Market Analysis, Insights and Forecast - By Country/Sub-region
- 15.1.1.
- 16. Middle East and Africa Enterprise Collaboration Industry Analysis, Insights and Forecast, 2019-2031
- 16.1. Market Analysis, Insights and Forecast - By Country/Sub-region
- 16.1.1.
- 17. Competitive Analysis
- 17.1. Global Market Share Analysis 2024
- 17.2. Company Profiles
- 17.2.1 Mitel LLC
- 17.2.1.1. Overview
- 17.2.1.2. Products
- 17.2.1.3. SWOT Analysis
- 17.2.1.4. Recent Developments
- 17.2.1.5. Financials (Based on Availability)
- 17.2.2 Axero Solutions LLC*List Not Exhaustive
- 17.2.2.1. Overview
- 17.2.2.2. Products
- 17.2.2.3. SWOT Analysis
- 17.2.2.4. Recent Developments
- 17.2.2.5. Financials (Based on Availability)
- 17.2.3 Atlassian Corporation PLC
- 17.2.3.1. Overview
- 17.2.3.2. Products
- 17.2.3.3. SWOT Analysis
- 17.2.3.4. Recent Developments
- 17.2.3.5. Financials (Based on Availability)
- 17.2.4 Adobe Systems Inc
- 17.2.4.1. Overview
- 17.2.4.2. Products
- 17.2.4.3. SWOT Analysis
- 17.2.4.4. Recent Developments
- 17.2.4.5. Financials (Based on Availability)
- 17.2.5 Slack Technologies Inc
- 17.2.5.1. Overview
- 17.2.5.2. Products
- 17.2.5.3. SWOT Analysis
- 17.2.5.4. Recent Developments
- 17.2.5.5. Financials (Based on Availability)
- 17.2.6 TIBCO Software Inc
- 17.2.6.1. Overview
- 17.2.6.2. Products
- 17.2.6.3. SWOT Analysis
- 17.2.6.4. Recent Developments
- 17.2.6.5. Financials (Based on Availability)
- 17.2.7 IBM Corporation
- 17.2.7.1. Overview
- 17.2.7.2. Products
- 17.2.7.3. SWOT Analysis
- 17.2.7.4. Recent Developments
- 17.2.7.5. Financials (Based on Availability)
- 17.2.8 Jive Software
- 17.2.8.1. Overview
- 17.2.8.2. Products
- 17.2.8.3. SWOT Analysis
- 17.2.8.4. Recent Developments
- 17.2.8.5. Financials (Based on Availability)
- 17.2.9 Polycom Inc
- 17.2.9.1. Overview
- 17.2.9.2. Products
- 17.2.9.3. SWOT Analysis
- 17.2.9.4. Recent Developments
- 17.2.9.5. Financials (Based on Availability)
- 17.2.10 Microsoft Corporation
- 17.2.10.1. Overview
- 17.2.10.2. Products
- 17.2.10.3. SWOT Analysis
- 17.2.10.4. Recent Developments
- 17.2.10.5. Financials (Based on Availability)
- 17.2.11 Salesforce Com Inc
- 17.2.11.1. Overview
- 17.2.11.2. Products
- 17.2.11.3. SWOT Analysis
- 17.2.11.4. Recent Developments
- 17.2.11.5. Financials (Based on Availability)
- 17.2.12 Zoho Corporation Pvt Ltd
- 17.2.12.1. Overview
- 17.2.12.2. Products
- 17.2.12.3. SWOT Analysis
- 17.2.12.4. Recent Developments
- 17.2.12.5. Financials (Based on Availability)
- 17.2.13 Huawei Technologies Co Ltd
- 17.2.13.1. Overview
- 17.2.13.2. Products
- 17.2.13.3. SWOT Analysis
- 17.2.13.4. Recent Developments
- 17.2.13.5. Financials (Based on Availability)
- 17.2.14 Cisco System Inc
- 17.2.14.1. Overview
- 17.2.14.2. Products
- 17.2.14.3. SWOT Analysis
- 17.2.14.4. Recent Developments
- 17.2.14.5. Financials (Based on Availability)
- 17.2.15 SAP SE
- 17.2.15.1. Overview
- 17.2.15.2. Products
- 17.2.15.3. SWOT Analysis
- 17.2.15.4. Recent Developments
- 17.2.15.5. Financials (Based on Availability)
- 17.2.1 Mitel LLC
List of Figures
- Figure 1: Global Enterprise Collaboration Industry Revenue Breakdown (Million, %) by Region 2024 & 2032
- Figure 2: North America Enterprise Collaboration Industry Revenue (Million), by Country 2024 & 2032
- Figure 3: North America Enterprise Collaboration Industry Revenue Share (%), by Country 2024 & 2032
- Figure 4: Europe Enterprise Collaboration Industry Revenue (Million), by Country 2024 & 2032
- Figure 5: Europe Enterprise Collaboration Industry Revenue Share (%), by Country 2024 & 2032
- Figure 6: Asia Pacific Enterprise Collaboration Industry Revenue (Million), by Country 2024 & 2032
- Figure 7: Asia Pacific Enterprise Collaboration Industry Revenue Share (%), by Country 2024 & 2032
- Figure 8: Latin America Enterprise Collaboration Industry Revenue (Million), by Country 2024 & 2032
- Figure 9: Latin America Enterprise Collaboration Industry Revenue Share (%), by Country 2024 & 2032
- Figure 10: Middle East and Africa Enterprise Collaboration Industry Revenue (Million), by Country 2024 & 2032
- Figure 11: Middle East and Africa Enterprise Collaboration Industry Revenue Share (%), by Country 2024 & 2032
- Figure 12: North America Enterprise Collaboration Industry Revenue (Million), by Deployment Type 2024 & 2032
- Figure 13: North America Enterprise Collaboration Industry Revenue Share (%), by Deployment Type 2024 & 2032
- Figure 14: North America Enterprise Collaboration Industry Revenue (Million), by Application 2024 & 2032
- Figure 15: North America Enterprise Collaboration Industry Revenue Share (%), by Application 2024 & 2032
- Figure 16: North America Enterprise Collaboration Industry Revenue (Million), by End-user Industry 2024 & 2032
- Figure 17: North America Enterprise Collaboration Industry Revenue Share (%), by End-user Industry 2024 & 2032
- Figure 18: North America Enterprise Collaboration Industry Revenue (Million), by Country 2024 & 2032
- Figure 19: North America Enterprise Collaboration Industry Revenue Share (%), by Country 2024 & 2032
- Figure 20: Europe Enterprise Collaboration Industry Revenue (Million), by Deployment Type 2024 & 2032
- Figure 21: Europe Enterprise Collaboration Industry Revenue Share (%), by Deployment Type 2024 & 2032
- Figure 22: Europe Enterprise Collaboration Industry Revenue (Million), by Application 2024 & 2032
- Figure 23: Europe Enterprise Collaboration Industry Revenue Share (%), by Application 2024 & 2032
- Figure 24: Europe Enterprise Collaboration Industry Revenue (Million), by End-user Industry 2024 & 2032
- Figure 25: Europe Enterprise Collaboration Industry Revenue Share (%), by End-user Industry 2024 & 2032
- Figure 26: Europe Enterprise Collaboration Industry Revenue (Million), by Country 2024 & 2032
- Figure 27: Europe Enterprise Collaboration Industry Revenue Share (%), by Country 2024 & 2032
- Figure 28: Asia Enterprise Collaboration Industry Revenue (Million), by Deployment Type 2024 & 2032
- Figure 29: Asia Enterprise Collaboration Industry Revenue Share (%), by Deployment Type 2024 & 2032
- Figure 30: Asia Enterprise Collaboration Industry Revenue (Million), by Application 2024 & 2032
- Figure 31: Asia Enterprise Collaboration Industry Revenue Share (%), by Application 2024 & 2032
- Figure 32: Asia Enterprise Collaboration Industry Revenue (Million), by End-user Industry 2024 & 2032
- Figure 33: Asia Enterprise Collaboration Industry Revenue Share (%), by End-user Industry 2024 & 2032
- Figure 34: Asia Enterprise Collaboration Industry Revenue (Million), by Country 2024 & 2032
- Figure 35: Asia Enterprise Collaboration Industry Revenue Share (%), by Country 2024 & 2032
- Figure 36: Australia and New Zealand Enterprise Collaboration Industry Revenue (Million), by Deployment Type 2024 & 2032
- Figure 37: Australia and New Zealand Enterprise Collaboration Industry Revenue Share (%), by Deployment Type 2024 & 2032
- Figure 38: Australia and New Zealand Enterprise Collaboration Industry Revenue (Million), by Application 2024 & 2032
- Figure 39: Australia and New Zealand Enterprise Collaboration Industry Revenue Share (%), by Application 2024 & 2032
- Figure 40: Australia and New Zealand Enterprise Collaboration Industry Revenue (Million), by End-user Industry 2024 & 2032
- Figure 41: Australia and New Zealand Enterprise Collaboration Industry Revenue Share (%), by End-user Industry 2024 & 2032
- Figure 42: Australia and New Zealand Enterprise Collaboration Industry Revenue (Million), by Country 2024 & 2032
- Figure 43: Australia and New Zealand Enterprise Collaboration Industry Revenue Share (%), by Country 2024 & 2032
- Figure 44: Latin America Enterprise Collaboration Industry Revenue (Million), by Deployment Type 2024 & 2032
- Figure 45: Latin America Enterprise Collaboration Industry Revenue Share (%), by Deployment Type 2024 & 2032
- Figure 46: Latin America Enterprise Collaboration Industry Revenue (Million), by Application 2024 & 2032
- Figure 47: Latin America Enterprise Collaboration Industry Revenue Share (%), by Application 2024 & 2032
- Figure 48: Latin America Enterprise Collaboration Industry Revenue (Million), by End-user Industry 2024 & 2032
- Figure 49: Latin America Enterprise Collaboration Industry Revenue Share (%), by End-user Industry 2024 & 2032
- Figure 50: Latin America Enterprise Collaboration Industry Revenue (Million), by Country 2024 & 2032
- Figure 51: Latin America Enterprise Collaboration Industry Revenue Share (%), by Country 2024 & 2032
- Figure 52: Middle East and Africa Enterprise Collaboration Industry Revenue (Million), by Deployment Type 2024 & 2032
- Figure 53: Middle East and Africa Enterprise Collaboration Industry Revenue Share (%), by Deployment Type 2024 & 2032
- Figure 54: Middle East and Africa Enterprise Collaboration Industry Revenue (Million), by Application 2024 & 2032
- Figure 55: Middle East and Africa Enterprise Collaboration Industry Revenue Share (%), by Application 2024 & 2032
- Figure 56: Middle East and Africa Enterprise Collaboration Industry Revenue (Million), by End-user Industry 2024 & 2032
- Figure 57: Middle East and Africa Enterprise Collaboration Industry Revenue Share (%), by End-user Industry 2024 & 2032
- Figure 58: Middle East and Africa Enterprise Collaboration Industry Revenue (Million), by Country 2024 & 2032
- Figure 59: Middle East and Africa Enterprise Collaboration Industry Revenue Share (%), by Country 2024 & 2032
List of Tables
- Table 1: Global Enterprise Collaboration Industry Revenue Million Forecast, by Region 2019 & 2032
- Table 2: Global Enterprise Collaboration Industry Revenue Million Forecast, by Deployment Type 2019 & 2032
- Table 3: Global Enterprise Collaboration Industry Revenue Million Forecast, by Application 2019 & 2032
- Table 4: Global Enterprise Collaboration Industry Revenue Million Forecast, by End-user Industry 2019 & 2032
- Table 5: Global Enterprise Collaboration Industry Revenue Million Forecast, by Region 2019 & 2032
- Table 6: Global Enterprise Collaboration Industry Revenue Million Forecast, by Country 2019 & 2032
- Table 7: United States Enterprise Collaboration Industry Revenue (Million) Forecast, by Application 2019 & 2032
- Table 8: Canada Enterprise Collaboration Industry Revenue (Million) Forecast, by Application 2019 & 2032
- Table 9: Global Enterprise Collaboration Industry Revenue Million Forecast, by Country 2019 & 2032
- Table 10: United Kingdom Enterprise Collaboration Industry Revenue (Million) Forecast, by Application 2019 & 2032
- Table 11: Germany Enterprise Collaboration Industry Revenue (Million) Forecast, by Application 2019 & 2032
- Table 12: France Enterprise Collaboration Industry Revenue (Million) Forecast, by Application 2019 & 2032
- Table 13: Spain Enterprise Collaboration Industry Revenue (Million) Forecast, by Application 2019 & 2032
- Table 14: Global Enterprise Collaboration Industry Revenue Million Forecast, by Country 2019 & 2032
- Table 15: China Enterprise Collaboration Industry Revenue (Million) Forecast, by Application 2019 & 2032
- Table 16: Japan Enterprise Collaboration Industry Revenue (Million) Forecast, by Application 2019 & 2032
- Table 17: India Enterprise Collaboration Industry Revenue (Million) Forecast, by Application 2019 & 2032
- Table 18: South Korea Enterprise Collaboration Industry Revenue (Million) Forecast, by Application 2019 & 2032
- Table 19: Global Enterprise Collaboration Industry Revenue Million Forecast, by Country 2019 & 2032
- Table 20: Enterprise Collaboration Industry Revenue (Million) Forecast, by Application 2019 & 2032
- Table 21: Global Enterprise Collaboration Industry Revenue Million Forecast, by Country 2019 & 2032
- Table 22: Enterprise Collaboration Industry Revenue (Million) Forecast, by Application 2019 & 2032
- Table 23: Global Enterprise Collaboration Industry Revenue Million Forecast, by Deployment Type 2019 & 2032
- Table 24: Global Enterprise Collaboration Industry Revenue Million Forecast, by Application 2019 & 2032
- Table 25: Global Enterprise Collaboration Industry Revenue Million Forecast, by End-user Industry 2019 & 2032
- Table 26: Global Enterprise Collaboration Industry Revenue Million Forecast, by Country 2019 & 2032
- Table 27: United States Enterprise Collaboration Industry Revenue (Million) Forecast, by Application 2019 & 2032
- Table 28: Canada Enterprise Collaboration Industry Revenue (Million) Forecast, by Application 2019 & 2032
- Table 29: Global Enterprise Collaboration Industry Revenue Million Forecast, by Deployment Type 2019 & 2032
- Table 30: Global Enterprise Collaboration Industry Revenue Million Forecast, by Application 2019 & 2032
- Table 31: Global Enterprise Collaboration Industry Revenue Million Forecast, by End-user Industry 2019 & 2032
- Table 32: Global Enterprise Collaboration Industry Revenue Million Forecast, by Country 2019 & 2032
- Table 33: United Kingdom Enterprise Collaboration Industry Revenue (Million) Forecast, by Application 2019 & 2032
- Table 34: Germany Enterprise Collaboration Industry Revenue (Million) Forecast, by Application 2019 & 2032
- Table 35: France Enterprise Collaboration Industry Revenue (Million) Forecast, by Application 2019 & 2032
- Table 36: Spain Enterprise Collaboration Industry Revenue (Million) Forecast, by Application 2019 & 2032
- Table 37: Global Enterprise Collaboration Industry Revenue Million Forecast, by Deployment Type 2019 & 2032
- Table 38: Global Enterprise Collaboration Industry Revenue Million Forecast, by Application 2019 & 2032
- Table 39: Global Enterprise Collaboration Industry Revenue Million Forecast, by End-user Industry 2019 & 2032
- Table 40: Global Enterprise Collaboration Industry Revenue Million Forecast, by Country 2019 & 2032
- Table 41: China Enterprise Collaboration Industry Revenue (Million) Forecast, by Application 2019 & 2032
- Table 42: Japan Enterprise Collaboration Industry Revenue (Million) Forecast, by Application 2019 & 2032
- Table 43: India Enterprise Collaboration Industry Revenue (Million) Forecast, by Application 2019 & 2032
- Table 44: South Korea Enterprise Collaboration Industry Revenue (Million) Forecast, by Application 2019 & 2032
- Table 45: Global Enterprise Collaboration Industry Revenue Million Forecast, by Deployment Type 2019 & 2032
- Table 46: Global Enterprise Collaboration Industry Revenue Million Forecast, by Application 2019 & 2032
- Table 47: Global Enterprise Collaboration Industry Revenue Million Forecast, by End-user Industry 2019 & 2032
- Table 48: Global Enterprise Collaboration Industry Revenue Million Forecast, by Country 2019 & 2032
- Table 49: Global Enterprise Collaboration Industry Revenue Million Forecast, by Deployment Type 2019 & 2032
- Table 50: Global Enterprise Collaboration Industry Revenue Million Forecast, by Application 2019 & 2032
- Table 51: Global Enterprise Collaboration Industry Revenue Million Forecast, by End-user Industry 2019 & 2032
- Table 52: Global Enterprise Collaboration Industry Revenue Million Forecast, by Country 2019 & 2032
- Table 53: Global Enterprise Collaboration Industry Revenue Million Forecast, by Deployment Type 2019 & 2032
- Table 54: Global Enterprise Collaboration Industry Revenue Million Forecast, by Application 2019 & 2032
- Table 55: Global Enterprise Collaboration Industry Revenue Million Forecast, by End-user Industry 2019 & 2032
- Table 56: Global Enterprise Collaboration Industry Revenue Million Forecast, by Country 2019 & 2032
Frequently Asked Questions
1. What is the projected Compound Annual Growth Rate (CAGR) of the Enterprise Collaboration Industry?
The projected CAGR is approximately 10.70%.
2. Which companies are prominent players in the Enterprise Collaboration Industry?
Key companies in the market include Mitel LLC, Axero Solutions LLC*List Not Exhaustive, Atlassian Corporation PLC, Adobe Systems Inc, Slack Technologies Inc, TIBCO Software Inc, IBM Corporation, Jive Software, Polycom Inc, Microsoft Corporation, Salesforce Com Inc, Zoho Corporation Pvt Ltd, Huawei Technologies Co Ltd, Cisco System Inc, SAP SE.
3. What are the main segments of the Enterprise Collaboration Industry?
The market segments include Deployment Type, Application, End-user Industry.
4. Can you provide details about the market size?
The market size is estimated to be USD 60.33 Million as of 2022.
5. What are some drivers contributing to market growth?
API Integration for Greater Efficiency; Increase in Usage of Mobile Devices for Time Management.
6. What are the notable trends driving market growth?
Cloud-based Deployment to Increase the Market Growth.
7. Are there any restraints impacting market growth?
Data Security While Deploying SDDC is a Major Challenge.
8. Can you provide examples of recent developments in the market?
April 2023: Google Cloud launched an AI-enabled platform for prior authorization and claims processing powered by a new data and analytics tool. The latest offering will convert unstructured data into structured data and can help payers meet existing and proposed CMS rules around interoperability and prior authorization, including using HL7 FHIR.
9. What pricing options are available for accessing the report?
Pricing options include single-user, multi-user, and enterprise licenses priced at USD 4750, USD 5250, and USD 8750 respectively.
10. Is the market size provided in terms of value or volume?
The market size is provided in terms of value, measured in Million.
11. Are there any specific market keywords associated with the report?
Yes, the market keyword associated with the report is "Enterprise Collaboration Industry," which aids in identifying and referencing the specific market segment covered.
12. How do I determine which pricing option suits my needs best?
The pricing options vary based on user requirements and access needs. Individual users may opt for single-user licenses, while businesses requiring broader access may choose multi-user or enterprise licenses for cost-effective access to the report.
13. Are there any additional resources or data provided in the Enterprise Collaboration Industry report?
While the report offers comprehensive insights, it's advisable to review the specific contents or supplementary materials provided to ascertain if additional resources or data are available.
14. How can I stay updated on further developments or reports in the Enterprise Collaboration Industry?
To stay informed about further developments, trends, and reports in the Enterprise Collaboration Industry, consider subscribing to industry newsletters, following relevant companies and organizations, or regularly checking reputable industry news sources and publications.
Methodology
Step 1 - Identification of Relevant Samples Size from Population Database


Step 2 - Approaches for Defining Global Market Size (Value, Volume* & Price*)

Note*: In applicable scenarios
Step 3 - Data Sources
Primary Research
- Web Analytics
- Survey Reports
- Research Institute
- Latest Research Reports
- Opinion Leaders
Secondary Research
- Annual Reports
- White Paper
- Latest Press Release
- Industry Association
- Paid Database
- Investor Presentations

Step 4 - Data Triangulation
Involves using different sources of information in order to increase the validity of a study
These sources are likely to be stakeholders in a program - participants, other researchers, program staff, other community members, and so on.
Then we put all data in single framework & apply various statistical tools to find out the dynamic on the market.
During the analysis stage, feedback from the stakeholder groups would be compared to determine areas of agreement as well as areas of divergence
