

Key Insights
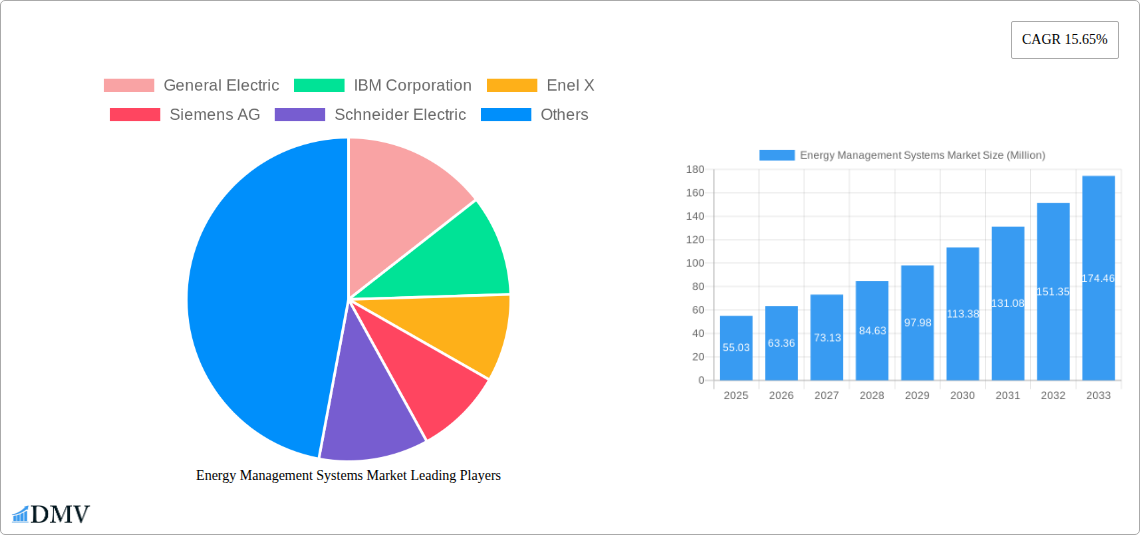
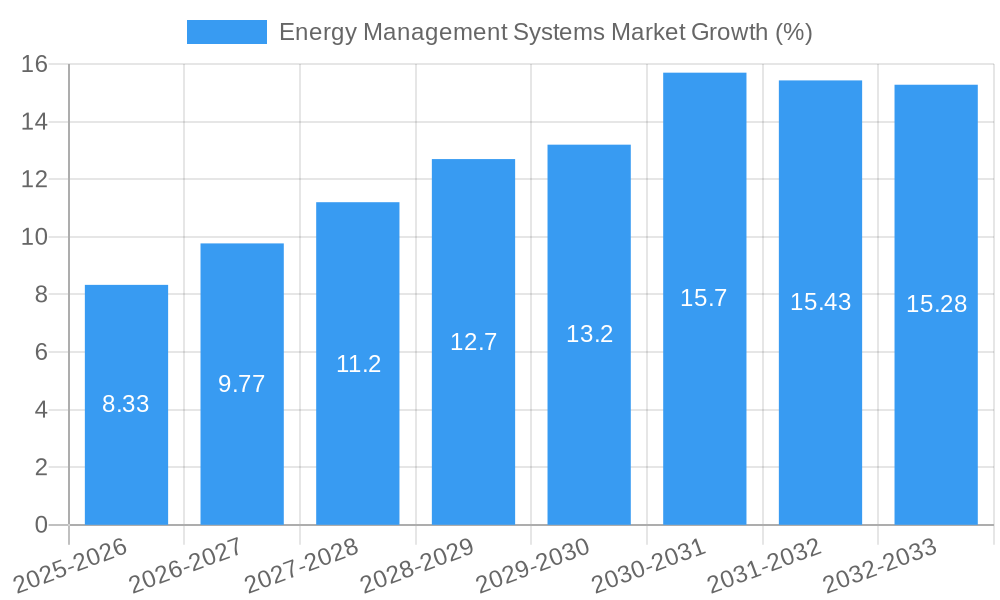
The Energy Management Systems (EMS) market is experiencing robust growth, projected to reach a value of $55.03 million in 2025 and expand at a Compound Annual Growth Rate (CAGR) of 15.65% from 2025 to 2033. This significant expansion is driven by several key factors. Increasing energy costs and the urgent need for energy efficiency are compelling businesses and individuals to adopt EMS solutions. Furthermore, the growing adoption of smart technologies, including the Internet of Things (IoT) and artificial intelligence (AI), is enabling advanced analytics and automation in energy management, leading to optimized energy consumption and reduced operational costs. Stringent government regulations promoting renewable energy integration and carbon emission reduction further stimulate market growth. The diverse applications of EMS across various sectors, including manufacturing, power and energy, IT and telecommunications, healthcare, and residential and commercial buildings, contribute to the market's broad appeal. The market is segmented by type (BEMS, IEMS, HEMS), end-user, application (energy generation, transmission, monitoring), and component (hardware, software, services), offering various solutions tailored to specific needs. Leading players like General Electric, IBM, Siemens, and Schneider Electric are driving innovation and expanding market penetration through strategic partnerships, technological advancements, and geographical expansion.
The substantial growth potential of the EMS market is further amplified by the increasing demand for reliable and efficient energy infrastructure, particularly in developing economies. The integration of renewable energy sources into the grid necessitates sophisticated EMS solutions for effective management and optimization. Advancements in cloud-based platforms and data analytics are also fueling the market's growth by enhancing system capabilities and providing valuable insights for improved energy management strategies. However, the high initial investment cost of implementing EMS solutions and the complexity involved in integrating these systems with existing infrastructure may pose challenges to market growth. Despite these constraints, the long-term benefits of reduced energy costs, improved operational efficiency, and environmental sustainability are driving widespread adoption and contributing to the overall positive outlook for the EMS market.
Energy Management Systems Market Report: 2019-2033
This comprehensive report provides an in-depth analysis of the Energy Management Systems (EMS) market, offering invaluable insights for stakeholders seeking to understand its current state and future trajectory. Covering the period from 2019 to 2033, with a focus on 2025, this report dissects market composition, industry evolution, leading segments, product innovations, and future opportunities. The global market is projected to reach xx Million by 2033.
Energy Management Systems Market Market Composition & Trends
The Energy Management Systems market is characterized by a moderately concentrated landscape with key players like General Electric, IBM Corporation, Enel X, Siemens AG, Schneider Electric, Oracle Corporation, Rockwell Automation Inc, Eaton, SAP SE, and Honeywell International Inc. List Not Exhaustive,ABB holding significant market share. However, the emergence of innovative startups and technological advancements is fostering increased competition. Market share distribution varies across segments, with the Manufacturing and Power & Energy end-user sectors commanding substantial portions.
M&A activity has been notable, with deal values totaling xx Million in the last five years, primarily driven by companies seeking to expand their product portfolios and geographic reach. Regulatory landscapes, particularly those focused on energy efficiency and sustainability, are significant drivers. The market faces competition from substitute products like decentralized energy generation systems, but overall EMS solutions remain crucial for optimizing energy consumption and reducing costs.
- Market Concentration: Moderately concentrated, with top players holding xx% market share.
- Innovation Catalysts: Advancements in AI, IoT, and cloud computing.
- Regulatory Landscape: Stringent energy efficiency regulations in various regions.
- Substitute Products: Decentralized energy generation, smart grids.
- M&A Activity: xx Million in deal value over the past five years.
Energy Management Systems Market Industry Evolution
The EMS market has experienced significant growth from 2019 to 2024, with a Compound Annual Growth Rate (CAGR) of xx%. This growth is fueled by increasing energy costs, growing environmental concerns, and the widespread adoption of smart technologies. Technological advancements, such as the integration of AI and machine learning for predictive maintenance and optimization, have further propelled market expansion. The shift in consumer demands towards sustainable and efficient energy solutions is a crucial driver. The market is expected to continue its upward trajectory, with a projected CAGR of xx% from 2025 to 2033. Adoption rates of EMS solutions are increasing across various sectors, with the manufacturing sector leading the way. The integration of EMS with other smart building technologies is also contributing to market expansion.
Leading Regions, Countries, or Segments in Energy Management Systems Market
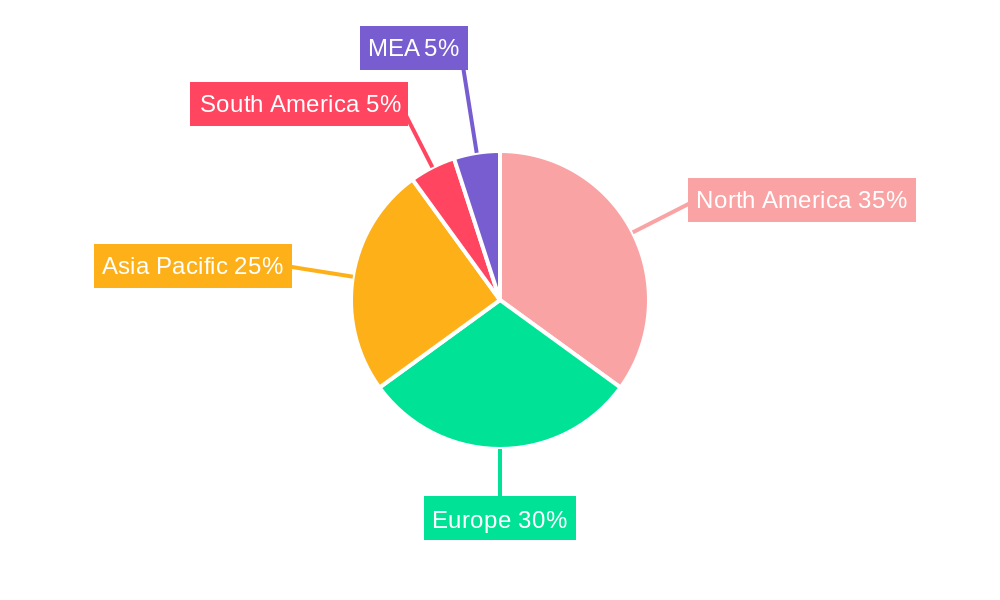
The North American region currently dominates the EMS market, driven by strong government support for energy efficiency initiatives and a high concentration of key players. Within the market segmentation:
- By Type of EMS: BEMS holds the largest market share due to the extensive adoption in commercial buildings.
- By End User: The Manufacturing sector leads due to the high potential for energy savings and operational efficiency improvements.
- By Application: Energy Monitoring is experiencing high growth due to the increasing need for real-time data analysis and optimization.
- By Component: Software solutions are gaining traction, driven by advancements in AI and analytics.
Key Drivers:
- Significant government investments in smart city initiatives and renewable energy projects.
- Stringent environmental regulations promoting energy efficiency.
- Rising energy costs and the need for cost optimization.
The dominance of North America is attributed to factors including substantial investments in smart grid infrastructure, a robust regulatory environment favoring energy efficiency, and the presence of major market players. Europe and Asia-Pacific are also exhibiting strong growth, fueled by increasing industrialization and government initiatives promoting sustainable development.
Energy Management Systems Market Product Innovations
Recent product innovations include the development of advanced analytics platforms capable of predicting energy consumption patterns and optimizing energy use in real-time. Integration with IoT devices allows for remote monitoring and control, enhancing efficiency and reducing operational costs. These innovations offer unique selling propositions focused on improved accuracy, enhanced data visualization, and seamless integration with existing systems.
Propelling Factors for Energy Management Systems Market Growth
Several factors are propelling the growth of the EMS market, including:
- Technological advancements: AI, IoT, and cloud computing enabling smarter, more efficient systems.
- Economic incentives: Government subsidies and tax breaks promoting energy efficiency.
- Regulatory pressures: Stringent environmental regulations driving adoption.
- Rising energy costs: Increased pressure on businesses to reduce energy consumption.
Obstacles in the Energy Management Systems Market Market
Several challenges hinder the market's growth:
- High initial investment costs: Implementing EMS can be expensive, deterring some businesses.
- Complexity of integration: Integrating EMS with existing systems can be challenging.
- Cybersecurity concerns: Protecting sensitive data is crucial but presents a challenge.
- Lack of skilled workforce: A shortage of professionals with expertise in EMS implementation and maintenance.
Future Opportunities in Energy Management Systems Market
Future opportunities lie in:
- Expansion into developing markets: Significant potential for growth in regions with rapidly developing economies.
- Integration with renewable energy sources: Optimizing the use of solar, wind, and other renewable energy sources.
- Development of advanced analytics capabilities: Improved predictive maintenance and optimization features.
- Growth of the smart building market: Increased demand for energy-efficient buildings.
Major Players in the Energy Management Systems Market Ecosystem
- General Electric
- IBM Corporation
- Enel X
- Siemens AG
- Schneider Electric
- Oracle Corporation
- Rockwell Automation Inc
- Eaton
- SAP SE
- Honeywell International Inc
- ABB
Key Developments in Energy Management Systems Market Industry
- March 2023: Schneider Electric's EUR 40 Million investment in a new smart factory in Hungary signifies increased capacity to meet growing demand driven by Europe's energy transition.
- December 2022: Siemens Energy's partnership with Syntax for implementing SAP Digital Manufacturing Cloud infrastructure across 80+ production locations showcases the growing adoption of digital solutions for optimizing energy consumption.
- November 2022: The growing interest in hydrogen production via electrolysis using renewable energy highlights the potential for new energy sources and the role of EMS in managing this transition.
Strategic Energy Management Systems Market Market Forecast
The EMS market is poised for continued growth, driven by factors such as increasing energy costs, rising environmental concerns, and the rapid advancement of smart technologies. The integration of AI, IoT, and cloud computing will further enhance the capabilities of EMS, leading to improved energy efficiency and cost savings. The expansion into new markets and the development of innovative solutions will unlock significant growth potential in the coming years. The market is projected to reach xx Million by 2033, representing a substantial increase from the 2025 figure.
Energy Management Systems Market Segmentation
-
1. Type of EMS
- 1.1. BEMS
- 1.2. IEMS
- 1.3. HEMS
-
2. End User
- 2.1. Manufacturing
- 2.2. Power and Energy
- 2.3. IT and Telecommunication
- 2.4. Healthcare
- 2.5. Residential and Commercial
- 2.6. Other End Users
-
3. Application
- 3.1. Energy Generation
- 3.2. Energy Transmission
- 3.3. Energy Monitoring
-
4. Component
- 4.1. Hardware
- 4.2. Software
- 4.3. Services
Energy Management Systems Market Segmentation By Geography
-
1. North America
- 1.1. United States
- 1.2. Canada
-
2. Europe
- 2.1. United Kingdom
- 2.2. Germany
- 2.3. France
- 2.4. Spain
-
3. Asia
- 3.1. China
- 3.2. India
- 3.3. Japan
- 3.4. South Korea
- 3.5. Australia and New Zealand
-
4. Latin America
- 4.1. Brazil
- 4.2. Argentina
- 4.3. Mexico
-
5. Middle East and Africa
- 5.1. United Arab Emirates
- 5.2. Saudi Arabia
- 5.3. South Africa
Energy Management Systems Market REPORT HIGHLIGHTS
| Aspects | Details |
|---|---|
| Study Period | 2019-2033 |
| Base Year | 2024 |
| Estimated Year | 2025 |
| Forecast Period | 2025-2033 |
| Historical Period | 2019-2024 |
| Growth Rate | CAGR of 15.65% from 2019-2033 |
| Segmentation |
|
Table of Contents
- 1. Introduction
- 1.1. Research Scope
- 1.2. Market Segmentation
- 1.3. Research Methodology
- 1.4. Definitions and Assumptions
- 2. Executive Summary
- 2.1. Introduction
- 3. Market Dynamics
- 3.1. Introduction
- 3.2. Market Drivers
- 3.2.1. Increasing Usage of Smart Grids and Smart Meters; Rising Investments in Energy Efficiency
- 3.3. Market Restrains
- 3.3.1. Privacy and Security Concerns
- 3.4. Market Trends
- 3.4.1. Rising Investments in Energy Efficiency to Drive the Market
- 4. Market Factor Analysis
- 4.1. Porters Five Forces
- 4.2. Supply/Value Chain
- 4.3. PESTEL analysis
- 4.4. Market Entropy
- 4.5. Patent/Trademark Analysis
- 5. Global Energy Management Systems Market Analysis, Insights and Forecast, 2019-2031
- 5.1. Market Analysis, Insights and Forecast - by Type of EMS
- 5.1.1. BEMS
- 5.1.2. IEMS
- 5.1.3. HEMS
- 5.2. Market Analysis, Insights and Forecast - by End User
- 5.2.1. Manufacturing
- 5.2.2. Power and Energy
- 5.2.3. IT and Telecommunication
- 5.2.4. Healthcare
- 5.2.5. Residential and Commercial
- 5.2.6. Other End Users
- 5.3. Market Analysis, Insights and Forecast - by Application
- 5.3.1. Energy Generation
- 5.3.2. Energy Transmission
- 5.3.3. Energy Monitoring
- 5.4. Market Analysis, Insights and Forecast - by Component
- 5.4.1. Hardware
- 5.4.2. Software
- 5.4.3. Services
- 5.5. Market Analysis, Insights and Forecast - by Region
- 5.5.1. North America
- 5.5.2. Europe
- 5.5.3. Asia
- 5.5.4. Latin America
- 5.5.5. Middle East and Africa
- 5.1. Market Analysis, Insights and Forecast - by Type of EMS
- 6. North America Energy Management Systems Market Analysis, Insights and Forecast, 2019-2031
- 6.1. Market Analysis, Insights and Forecast - by Type of EMS
- 6.1.1. BEMS
- 6.1.2. IEMS
- 6.1.3. HEMS
- 6.2. Market Analysis, Insights and Forecast - by End User
- 6.2.1. Manufacturing
- 6.2.2. Power and Energy
- 6.2.3. IT and Telecommunication
- 6.2.4. Healthcare
- 6.2.5. Residential and Commercial
- 6.2.6. Other End Users
- 6.3. Market Analysis, Insights and Forecast - by Application
- 6.3.1. Energy Generation
- 6.3.2. Energy Transmission
- 6.3.3. Energy Monitoring
- 6.4. Market Analysis, Insights and Forecast - by Component
- 6.4.1. Hardware
- 6.4.2. Software
- 6.4.3. Services
- 6.1. Market Analysis, Insights and Forecast - by Type of EMS
- 7. Europe Energy Management Systems Market Analysis, Insights and Forecast, 2019-2031
- 7.1. Market Analysis, Insights and Forecast - by Type of EMS
- 7.1.1. BEMS
- 7.1.2. IEMS
- 7.1.3. HEMS
- 7.2. Market Analysis, Insights and Forecast - by End User
- 7.2.1. Manufacturing
- 7.2.2. Power and Energy
- 7.2.3. IT and Telecommunication
- 7.2.4. Healthcare
- 7.2.5. Residential and Commercial
- 7.2.6. Other End Users
- 7.3. Market Analysis, Insights and Forecast - by Application
- 7.3.1. Energy Generation
- 7.3.2. Energy Transmission
- 7.3.3. Energy Monitoring
- 7.4. Market Analysis, Insights and Forecast - by Component
- 7.4.1. Hardware
- 7.4.2. Software
- 7.4.3. Services
- 7.1. Market Analysis, Insights and Forecast - by Type of EMS
- 8. Asia Energy Management Systems Market Analysis, Insights and Forecast, 2019-2031
- 8.1. Market Analysis, Insights and Forecast - by Type of EMS
- 8.1.1. BEMS
- 8.1.2. IEMS
- 8.1.3. HEMS
- 8.2. Market Analysis, Insights and Forecast - by End User
- 8.2.1. Manufacturing
- 8.2.2. Power and Energy
- 8.2.3. IT and Telecommunication
- 8.2.4. Healthcare
- 8.2.5. Residential and Commercial
- 8.2.6. Other End Users
- 8.3. Market Analysis, Insights and Forecast - by Application
- 8.3.1. Energy Generation
- 8.3.2. Energy Transmission
- 8.3.3. Energy Monitoring
- 8.4. Market Analysis, Insights and Forecast - by Component
- 8.4.1. Hardware
- 8.4.2. Software
- 8.4.3. Services
- 8.1. Market Analysis, Insights and Forecast - by Type of EMS
- 9. Latin America Energy Management Systems Market Analysis, Insights and Forecast, 2019-2031
- 9.1. Market Analysis, Insights and Forecast - by Type of EMS
- 9.1.1. BEMS
- 9.1.2. IEMS
- 9.1.3. HEMS
- 9.2. Market Analysis, Insights and Forecast - by End User
- 9.2.1. Manufacturing
- 9.2.2. Power and Energy
- 9.2.3. IT and Telecommunication
- 9.2.4. Healthcare
- 9.2.5. Residential and Commercial
- 9.2.6. Other End Users
- 9.3. Market Analysis, Insights and Forecast - by Application
- 9.3.1. Energy Generation
- 9.3.2. Energy Transmission
- 9.3.3. Energy Monitoring
- 9.4. Market Analysis, Insights and Forecast - by Component
- 9.4.1. Hardware
- 9.4.2. Software
- 9.4.3. Services
- 9.1. Market Analysis, Insights and Forecast - by Type of EMS
- 10. Middle East and Africa Energy Management Systems Market Analysis, Insights and Forecast, 2019-2031
- 10.1. Market Analysis, Insights and Forecast - by Type of EMS
- 10.1.1. BEMS
- 10.1.2. IEMS
- 10.1.3. HEMS
- 10.2. Market Analysis, Insights and Forecast - by End User
- 10.2.1. Manufacturing
- 10.2.2. Power and Energy
- 10.2.3. IT and Telecommunication
- 10.2.4. Healthcare
- 10.2.5. Residential and Commercial
- 10.2.6. Other End Users
- 10.3. Market Analysis, Insights and Forecast - by Application
- 10.3.1. Energy Generation
- 10.3.2. Energy Transmission
- 10.3.3. Energy Monitoring
- 10.4. Market Analysis, Insights and Forecast - by Component
- 10.4.1. Hardware
- 10.4.2. Software
- 10.4.3. Services
- 10.1. Market Analysis, Insights and Forecast - by Type of EMS
- 11. North America Energy Management Systems Market Analysis, Insights and Forecast, 2019-2031
- 11.1. Market Analysis, Insights and Forecast - By Country/Sub-region
- 11.1.1 United States
- 11.1.2 Canada
- 11.1.3 Mexico
- 12. Europe Energy Management Systems Market Analysis, Insights and Forecast, 2019-2031
- 12.1. Market Analysis, Insights and Forecast - By Country/Sub-region
- 12.1.1 Germany
- 12.1.2 United Kingdom
- 12.1.3 France
- 12.1.4 Spain
- 12.1.5 Italy
- 12.1.6 Spain
- 12.1.7 Belgium
- 12.1.8 Netherland
- 12.1.9 Nordics
- 12.1.10 Rest of Europe
- 13. Asia Pacific Energy Management Systems Market Analysis, Insights and Forecast, 2019-2031
- 13.1. Market Analysis, Insights and Forecast - By Country/Sub-region
- 13.1.1 China
- 13.1.2 Japan
- 13.1.3 India
- 13.1.4 South Korea
- 13.1.5 Southeast Asia
- 13.1.6 Australia
- 13.1.7 Indonesia
- 13.1.8 Phillipes
- 13.1.9 Singapore
- 13.1.10 Thailandc
- 13.1.11 Rest of Asia Pacific
- 14. South America Energy Management Systems Market Analysis, Insights and Forecast, 2019-2031
- 14.1. Market Analysis, Insights and Forecast - By Country/Sub-region
- 14.1.1 Brazil
- 14.1.2 Argentina
- 14.1.3 Peru
- 14.1.4 Chile
- 14.1.5 Colombia
- 14.1.6 Ecuador
- 14.1.7 Venezuela
- 14.1.8 Rest of South America
- 15. North America Energy Management Systems Market Analysis, Insights and Forecast, 2019-2031
- 15.1. Market Analysis, Insights and Forecast - By Country/Sub-region
- 15.1.1 United States
- 15.1.2 Canada
- 15.1.3 Mexico
- 16. MEA Energy Management Systems Market Analysis, Insights and Forecast, 2019-2031
- 16.1. Market Analysis, Insights and Forecast - By Country/Sub-region
- 16.1.1 United Arab Emirates
- 16.1.2 Saudi Arabia
- 16.1.3 South Africa
- 16.1.4 Rest of Middle East and Africa
- 17. Competitive Analysis
- 17.1. Global Market Share Analysis 2024
- 17.2. Company Profiles
- 17.2.1 General Electric
- 17.2.1.1. Overview
- 17.2.1.2. Products
- 17.2.1.3. SWOT Analysis
- 17.2.1.4. Recent Developments
- 17.2.1.5. Financials (Based on Availability)
- 17.2.2 IBM Corporation
- 17.2.2.1. Overview
- 17.2.2.2. Products
- 17.2.2.3. SWOT Analysis
- 17.2.2.4. Recent Developments
- 17.2.2.5. Financials (Based on Availability)
- 17.2.3 Enel X
- 17.2.3.1. Overview
- 17.2.3.2. Products
- 17.2.3.3. SWOT Analysis
- 17.2.3.4. Recent Developments
- 17.2.3.5. Financials (Based on Availability)
- 17.2.4 Siemens AG
- 17.2.4.1. Overview
- 17.2.4.2. Products
- 17.2.4.3. SWOT Analysis
- 17.2.4.4. Recent Developments
- 17.2.4.5. Financials (Based on Availability)
- 17.2.5 Schneider Electric
- 17.2.5.1. Overview
- 17.2.5.2. Products
- 17.2.5.3. SWOT Analysis
- 17.2.5.4. Recent Developments
- 17.2.5.5. Financials (Based on Availability)
- 17.2.6 Oracle Corporation
- 17.2.6.1. Overview
- 17.2.6.2. Products
- 17.2.6.3. SWOT Analysis
- 17.2.6.4. Recent Developments
- 17.2.6.5. Financials (Based on Availability)
- 17.2.7 Rockwell Automation Inc
- 17.2.7.1. Overview
- 17.2.7.2. Products
- 17.2.7.3. SWOT Analysis
- 17.2.7.4. Recent Developments
- 17.2.7.5. Financials (Based on Availability)
- 17.2.8 Eaton
- 17.2.8.1. Overview
- 17.2.8.2. Products
- 17.2.8.3. SWOT Analysis
- 17.2.8.4. Recent Developments
- 17.2.8.5. Financials (Based on Availability)
- 17.2.9 SAP SE
- 17.2.9.1. Overview
- 17.2.9.2. Products
- 17.2.9.3. SWOT Analysis
- 17.2.9.4. Recent Developments
- 17.2.9.5. Financials (Based on Availability)
- 17.2.10 Honeywell International Inc *List Not Exhaustive
- 17.2.10.1. Overview
- 17.2.10.2. Products
- 17.2.10.3. SWOT Analysis
- 17.2.10.4. Recent Developments
- 17.2.10.5. Financials (Based on Availability)
- 17.2.11 ABB
- 17.2.11.1. Overview
- 17.2.11.2. Products
- 17.2.11.3. SWOT Analysis
- 17.2.11.4. Recent Developments
- 17.2.11.5. Financials (Based on Availability)
- 17.2.1 General Electric
List of Figures
- Figure 1: Global Energy Management Systems Market Revenue Breakdown (Million, %) by Region 2024 & 2032
- Figure 2: North America Energy Management Systems Market Revenue (Million), by Country 2024 & 2032
- Figure 3: North America Energy Management Systems Market Revenue Share (%), by Country 2024 & 2032
- Figure 4: Europe Energy Management Systems Market Revenue (Million), by Country 2024 & 2032
- Figure 5: Europe Energy Management Systems Market Revenue Share (%), by Country 2024 & 2032
- Figure 6: Asia Pacific Energy Management Systems Market Revenue (Million), by Country 2024 & 2032
- Figure 7: Asia Pacific Energy Management Systems Market Revenue Share (%), by Country 2024 & 2032
- Figure 8: South America Energy Management Systems Market Revenue (Million), by Country 2024 & 2032
- Figure 9: South America Energy Management Systems Market Revenue Share (%), by Country 2024 & 2032
- Figure 10: North America Energy Management Systems Market Revenue (Million), by Country 2024 & 2032
- Figure 11: North America Energy Management Systems Market Revenue Share (%), by Country 2024 & 2032
- Figure 12: MEA Energy Management Systems Market Revenue (Million), by Country 2024 & 2032
- Figure 13: MEA Energy Management Systems Market Revenue Share (%), by Country 2024 & 2032
- Figure 14: North America Energy Management Systems Market Revenue (Million), by Type of EMS 2024 & 2032
- Figure 15: North America Energy Management Systems Market Revenue Share (%), by Type of EMS 2024 & 2032
- Figure 16: North America Energy Management Systems Market Revenue (Million), by End User 2024 & 2032
- Figure 17: North America Energy Management Systems Market Revenue Share (%), by End User 2024 & 2032
- Figure 18: North America Energy Management Systems Market Revenue (Million), by Application 2024 & 2032
- Figure 19: North America Energy Management Systems Market Revenue Share (%), by Application 2024 & 2032
- Figure 20: North America Energy Management Systems Market Revenue (Million), by Component 2024 & 2032
- Figure 21: North America Energy Management Systems Market Revenue Share (%), by Component 2024 & 2032
- Figure 22: North America Energy Management Systems Market Revenue (Million), by Country 2024 & 2032
- Figure 23: North America Energy Management Systems Market Revenue Share (%), by Country 2024 & 2032
- Figure 24: Europe Energy Management Systems Market Revenue (Million), by Type of EMS 2024 & 2032
- Figure 25: Europe Energy Management Systems Market Revenue Share (%), by Type of EMS 2024 & 2032
- Figure 26: Europe Energy Management Systems Market Revenue (Million), by End User 2024 & 2032
- Figure 27: Europe Energy Management Systems Market Revenue Share (%), by End User 2024 & 2032
- Figure 28: Europe Energy Management Systems Market Revenue (Million), by Application 2024 & 2032
- Figure 29: Europe Energy Management Systems Market Revenue Share (%), by Application 2024 & 2032
- Figure 30: Europe Energy Management Systems Market Revenue (Million), by Component 2024 & 2032
- Figure 31: Europe Energy Management Systems Market Revenue Share (%), by Component 2024 & 2032
- Figure 32: Europe Energy Management Systems Market Revenue (Million), by Country 2024 & 2032
- Figure 33: Europe Energy Management Systems Market Revenue Share (%), by Country 2024 & 2032
- Figure 34: Asia Energy Management Systems Market Revenue (Million), by Type of EMS 2024 & 2032
- Figure 35: Asia Energy Management Systems Market Revenue Share (%), by Type of EMS 2024 & 2032
- Figure 36: Asia Energy Management Systems Market Revenue (Million), by End User 2024 & 2032
- Figure 37: Asia Energy Management Systems Market Revenue Share (%), by End User 2024 & 2032
- Figure 38: Asia Energy Management Systems Market Revenue (Million), by Application 2024 & 2032
- Figure 39: Asia Energy Management Systems Market Revenue Share (%), by Application 2024 & 2032
- Figure 40: Asia Energy Management Systems Market Revenue (Million), by Component 2024 & 2032
- Figure 41: Asia Energy Management Systems Market Revenue Share (%), by Component 2024 & 2032
- Figure 42: Asia Energy Management Systems Market Revenue (Million), by Country 2024 & 2032
- Figure 43: Asia Energy Management Systems Market Revenue Share (%), by Country 2024 & 2032
- Figure 44: Latin America Energy Management Systems Market Revenue (Million), by Type of EMS 2024 & 2032
- Figure 45: Latin America Energy Management Systems Market Revenue Share (%), by Type of EMS 2024 & 2032
- Figure 46: Latin America Energy Management Systems Market Revenue (Million), by End User 2024 & 2032
- Figure 47: Latin America Energy Management Systems Market Revenue Share (%), by End User 2024 & 2032
- Figure 48: Latin America Energy Management Systems Market Revenue (Million), by Application 2024 & 2032
- Figure 49: Latin America Energy Management Systems Market Revenue Share (%), by Application 2024 & 2032
- Figure 50: Latin America Energy Management Systems Market Revenue (Million), by Component 2024 & 2032
- Figure 51: Latin America Energy Management Systems Market Revenue Share (%), by Component 2024 & 2032
- Figure 52: Latin America Energy Management Systems Market Revenue (Million), by Country 2024 & 2032
- Figure 53: Latin America Energy Management Systems Market Revenue Share (%), by Country 2024 & 2032
- Figure 54: Middle East and Africa Energy Management Systems Market Revenue (Million), by Type of EMS 2024 & 2032
- Figure 55: Middle East and Africa Energy Management Systems Market Revenue Share (%), by Type of EMS 2024 & 2032
- Figure 56: Middle East and Africa Energy Management Systems Market Revenue (Million), by End User 2024 & 2032
- Figure 57: Middle East and Africa Energy Management Systems Market Revenue Share (%), by End User 2024 & 2032
- Figure 58: Middle East and Africa Energy Management Systems Market Revenue (Million), by Application 2024 & 2032
- Figure 59: Middle East and Africa Energy Management Systems Market Revenue Share (%), by Application 2024 & 2032
- Figure 60: Middle East and Africa Energy Management Systems Market Revenue (Million), by Component 2024 & 2032
- Figure 61: Middle East and Africa Energy Management Systems Market Revenue Share (%), by Component 2024 & 2032
- Figure 62: Middle East and Africa Energy Management Systems Market Revenue (Million), by Country 2024 & 2032
- Figure 63: Middle East and Africa Energy Management Systems Market Revenue Share (%), by Country 2024 & 2032
List of Tables
- Table 1: Global Energy Management Systems Market Revenue Million Forecast, by Region 2019 & 2032
- Table 2: Global Energy Management Systems Market Revenue Million Forecast, by Type of EMS 2019 & 2032
- Table 3: Global Energy Management Systems Market Revenue Million Forecast, by End User 2019 & 2032
- Table 4: Global Energy Management Systems Market Revenue Million Forecast, by Application 2019 & 2032
- Table 5: Global Energy Management Systems Market Revenue Million Forecast, by Component 2019 & 2032
- Table 6: Global Energy Management Systems Market Revenue Million Forecast, by Region 2019 & 2032
- Table 7: Global Energy Management Systems Market Revenue Million Forecast, by Country 2019 & 2032
- Table 8: United States Energy Management Systems Market Revenue (Million) Forecast, by Application 2019 & 2032
- Table 9: Canada Energy Management Systems Market Revenue (Million) Forecast, by Application 2019 & 2032
- Table 10: Mexico Energy Management Systems Market Revenue (Million) Forecast, by Application 2019 & 2032
- Table 11: Global Energy Management Systems Market Revenue Million Forecast, by Country 2019 & 2032
- Table 12: Germany Energy Management Systems Market Revenue (Million) Forecast, by Application 2019 & 2032
- Table 13: United Kingdom Energy Management Systems Market Revenue (Million) Forecast, by Application 2019 & 2032
- Table 14: France Energy Management Systems Market Revenue (Million) Forecast, by Application 2019 & 2032
- Table 15: Spain Energy Management Systems Market Revenue (Million) Forecast, by Application 2019 & 2032
- Table 16: Italy Energy Management Systems Market Revenue (Million) Forecast, by Application 2019 & 2032
- Table 17: Spain Energy Management Systems Market Revenue (Million) Forecast, by Application 2019 & 2032
- Table 18: Belgium Energy Management Systems Market Revenue (Million) Forecast, by Application 2019 & 2032
- Table 19: Netherland Energy Management Systems Market Revenue (Million) Forecast, by Application 2019 & 2032
- Table 20: Nordics Energy Management Systems Market Revenue (Million) Forecast, by Application 2019 & 2032
- Table 21: Rest of Europe Energy Management Systems Market Revenue (Million) Forecast, by Application 2019 & 2032
- Table 22: Global Energy Management Systems Market Revenue Million Forecast, by Country 2019 & 2032
- Table 23: China Energy Management Systems Market Revenue (Million) Forecast, by Application 2019 & 2032
- Table 24: Japan Energy Management Systems Market Revenue (Million) Forecast, by Application 2019 & 2032
- Table 25: India Energy Management Systems Market Revenue (Million) Forecast, by Application 2019 & 2032
- Table 26: South Korea Energy Management Systems Market Revenue (Million) Forecast, by Application 2019 & 2032
- Table 27: Southeast Asia Energy Management Systems Market Revenue (Million) Forecast, by Application 2019 & 2032
- Table 28: Australia Energy Management Systems Market Revenue (Million) Forecast, by Application 2019 & 2032
- Table 29: Indonesia Energy Management Systems Market Revenue (Million) Forecast, by Application 2019 & 2032
- Table 30: Phillipes Energy Management Systems Market Revenue (Million) Forecast, by Application 2019 & 2032
- Table 31: Singapore Energy Management Systems Market Revenue (Million) Forecast, by Application 2019 & 2032
- Table 32: Thailandc Energy Management Systems Market Revenue (Million) Forecast, by Application 2019 & 2032
- Table 33: Rest of Asia Pacific Energy Management Systems Market Revenue (Million) Forecast, by Application 2019 & 2032
- Table 34: Global Energy Management Systems Market Revenue Million Forecast, by Country 2019 & 2032
- Table 35: Brazil Energy Management Systems Market Revenue (Million) Forecast, by Application 2019 & 2032
- Table 36: Argentina Energy Management Systems Market Revenue (Million) Forecast, by Application 2019 & 2032
- Table 37: Peru Energy Management Systems Market Revenue (Million) Forecast, by Application 2019 & 2032
- Table 38: Chile Energy Management Systems Market Revenue (Million) Forecast, by Application 2019 & 2032
- Table 39: Colombia Energy Management Systems Market Revenue (Million) Forecast, by Application 2019 & 2032
- Table 40: Ecuador Energy Management Systems Market Revenue (Million) Forecast, by Application 2019 & 2032
- Table 41: Venezuela Energy Management Systems Market Revenue (Million) Forecast, by Application 2019 & 2032
- Table 42: Rest of South America Energy Management Systems Market Revenue (Million) Forecast, by Application 2019 & 2032
- Table 43: Global Energy Management Systems Market Revenue Million Forecast, by Country 2019 & 2032
- Table 44: United States Energy Management Systems Market Revenue (Million) Forecast, by Application 2019 & 2032
- Table 45: Canada Energy Management Systems Market Revenue (Million) Forecast, by Application 2019 & 2032
- Table 46: Mexico Energy Management Systems Market Revenue (Million) Forecast, by Application 2019 & 2032
- Table 47: Global Energy Management Systems Market Revenue Million Forecast, by Country 2019 & 2032
- Table 48: United Arab Emirates Energy Management Systems Market Revenue (Million) Forecast, by Application 2019 & 2032
- Table 49: Saudi Arabia Energy Management Systems Market Revenue (Million) Forecast, by Application 2019 & 2032
- Table 50: South Africa Energy Management Systems Market Revenue (Million) Forecast, by Application 2019 & 2032
- Table 51: Rest of Middle East and Africa Energy Management Systems Market Revenue (Million) Forecast, by Application 2019 & 2032
- Table 52: Global Energy Management Systems Market Revenue Million Forecast, by Type of EMS 2019 & 2032
- Table 53: Global Energy Management Systems Market Revenue Million Forecast, by End User 2019 & 2032
- Table 54: Global Energy Management Systems Market Revenue Million Forecast, by Application 2019 & 2032
- Table 55: Global Energy Management Systems Market Revenue Million Forecast, by Component 2019 & 2032
- Table 56: Global Energy Management Systems Market Revenue Million Forecast, by Country 2019 & 2032
- Table 57: United States Energy Management Systems Market Revenue (Million) Forecast, by Application 2019 & 2032
- Table 58: Canada Energy Management Systems Market Revenue (Million) Forecast, by Application 2019 & 2032
- Table 59: Global Energy Management Systems Market Revenue Million Forecast, by Type of EMS 2019 & 2032
- Table 60: Global Energy Management Systems Market Revenue Million Forecast, by End User 2019 & 2032
- Table 61: Global Energy Management Systems Market Revenue Million Forecast, by Application 2019 & 2032
- Table 62: Global Energy Management Systems Market Revenue Million Forecast, by Component 2019 & 2032
- Table 63: Global Energy Management Systems Market Revenue Million Forecast, by Country 2019 & 2032
- Table 64: United Kingdom Energy Management Systems Market Revenue (Million) Forecast, by Application 2019 & 2032
- Table 65: Germany Energy Management Systems Market Revenue (Million) Forecast, by Application 2019 & 2032
- Table 66: France Energy Management Systems Market Revenue (Million) Forecast, by Application 2019 & 2032
- Table 67: Spain Energy Management Systems Market Revenue (Million) Forecast, by Application 2019 & 2032
- Table 68: Global Energy Management Systems Market Revenue Million Forecast, by Type of EMS 2019 & 2032
- Table 69: Global Energy Management Systems Market Revenue Million Forecast, by End User 2019 & 2032
- Table 70: Global Energy Management Systems Market Revenue Million Forecast, by Application 2019 & 2032
- Table 71: Global Energy Management Systems Market Revenue Million Forecast, by Component 2019 & 2032
- Table 72: Global Energy Management Systems Market Revenue Million Forecast, by Country 2019 & 2032
- Table 73: China Energy Management Systems Market Revenue (Million) Forecast, by Application 2019 & 2032
- Table 74: India Energy Management Systems Market Revenue (Million) Forecast, by Application 2019 & 2032
- Table 75: Japan Energy Management Systems Market Revenue (Million) Forecast, by Application 2019 & 2032
- Table 76: South Korea Energy Management Systems Market Revenue (Million) Forecast, by Application 2019 & 2032
- Table 77: Australia and New Zealand Energy Management Systems Market Revenue (Million) Forecast, by Application 2019 & 2032
- Table 78: Global Energy Management Systems Market Revenue Million Forecast, by Type of EMS 2019 & 2032
- Table 79: Global Energy Management Systems Market Revenue Million Forecast, by End User 2019 & 2032
- Table 80: Global Energy Management Systems Market Revenue Million Forecast, by Application 2019 & 2032
- Table 81: Global Energy Management Systems Market Revenue Million Forecast, by Component 2019 & 2032
- Table 82: Global Energy Management Systems Market Revenue Million Forecast, by Country 2019 & 2032
- Table 83: Brazil Energy Management Systems Market Revenue (Million) Forecast, by Application 2019 & 2032
- Table 84: Argentina Energy Management Systems Market Revenue (Million) Forecast, by Application 2019 & 2032
- Table 85: Mexico Energy Management Systems Market Revenue (Million) Forecast, by Application 2019 & 2032
- Table 86: Global Energy Management Systems Market Revenue Million Forecast, by Type of EMS 2019 & 2032
- Table 87: Global Energy Management Systems Market Revenue Million Forecast, by End User 2019 & 2032
- Table 88: Global Energy Management Systems Market Revenue Million Forecast, by Application 2019 & 2032
- Table 89: Global Energy Management Systems Market Revenue Million Forecast, by Component 2019 & 2032
- Table 90: Global Energy Management Systems Market Revenue Million Forecast, by Country 2019 & 2032
- Table 91: United Arab Emirates Energy Management Systems Market Revenue (Million) Forecast, by Application 2019 & 2032
- Table 92: Saudi Arabia Energy Management Systems Market Revenue (Million) Forecast, by Application 2019 & 2032
- Table 93: South Africa Energy Management Systems Market Revenue (Million) Forecast, by Application 2019 & 2032
Frequently Asked Questions
1. What is the projected Compound Annual Growth Rate (CAGR) of the Energy Management Systems Market?
The projected CAGR is approximately 15.65%.
2. Which companies are prominent players in the Energy Management Systems Market?
Key companies in the market include General Electric, IBM Corporation, Enel X, Siemens AG, Schneider Electric, Oracle Corporation, Rockwell Automation Inc, Eaton, SAP SE, Honeywell International Inc *List Not Exhaustive, ABB.
3. What are the main segments of the Energy Management Systems Market?
The market segments include Type of EMS, End User, Application, Component.
4. Can you provide details about the market size?
The market size is estimated to be USD 55.03 Million as of 2022.
5. What are some drivers contributing to market growth?
Increasing Usage of Smart Grids and Smart Meters; Rising Investments in Energy Efficiency.
6. What are the notable trends driving market growth?
Rising Investments in Energy Efficiency to Drive the Market.
7. Are there any restraints impacting market growth?
Privacy and Security Concerns.
8. Can you provide examples of recent developments in the market?
March 2023: Schneider Electric began constructing its new smart factory in Dunavesce, Hungary. The new site will span 25,000 m2 and employ 500 people, with a EUR 40 million investment planned. As Europe accelerates through the energy transition and strengthens its energy independence, this new smart factory will increase capacity to meet increased demand.
9. What pricing options are available for accessing the report?
Pricing options include single-user, multi-user, and enterprise licenses priced at USD 4750, USD 5250, and USD 8750 respectively.
10. Is the market size provided in terms of value or volume?
The market size is provided in terms of value, measured in Million.
11. Are there any specific market keywords associated with the report?
Yes, the market keyword associated with the report is "Energy Management Systems Market," which aids in identifying and referencing the specific market segment covered.
12. How do I determine which pricing option suits my needs best?
The pricing options vary based on user requirements and access needs. Individual users may opt for single-user licenses, while businesses requiring broader access may choose multi-user or enterprise licenses for cost-effective access to the report.
13. Are there any additional resources or data provided in the Energy Management Systems Market report?
While the report offers comprehensive insights, it's advisable to review the specific contents or supplementary materials provided to ascertain if additional resources or data are available.
14. How can I stay updated on further developments or reports in the Energy Management Systems Market?
To stay informed about further developments, trends, and reports in the Energy Management Systems Market, consider subscribing to industry newsletters, following relevant companies and organizations, or regularly checking reputable industry news sources and publications.
Methodology
Step 1 - Identification of Relevant Samples Size from Population Database


Step 2 - Approaches for Defining Global Market Size (Value, Volume* & Price*)

Note*: In applicable scenarios
Step 3 - Data Sources
Primary Research
- Web Analytics
- Survey Reports
- Research Institute
- Latest Research Reports
- Opinion Leaders
Secondary Research
- Annual Reports
- White Paper
- Latest Press Release
- Industry Association
- Paid Database
- Investor Presentations

Step 4 - Data Triangulation
Involves using different sources of information in order to increase the validity of a study
These sources are likely to be stakeholders in a program - participants, other researchers, program staff, other community members, and so on.
Then we put all data in single framework & apply various statistical tools to find out the dynamic on the market.
During the analysis stage, feedback from the stakeholder groups would be compared to determine areas of agreement as well as areas of divergence
