

Key Insights
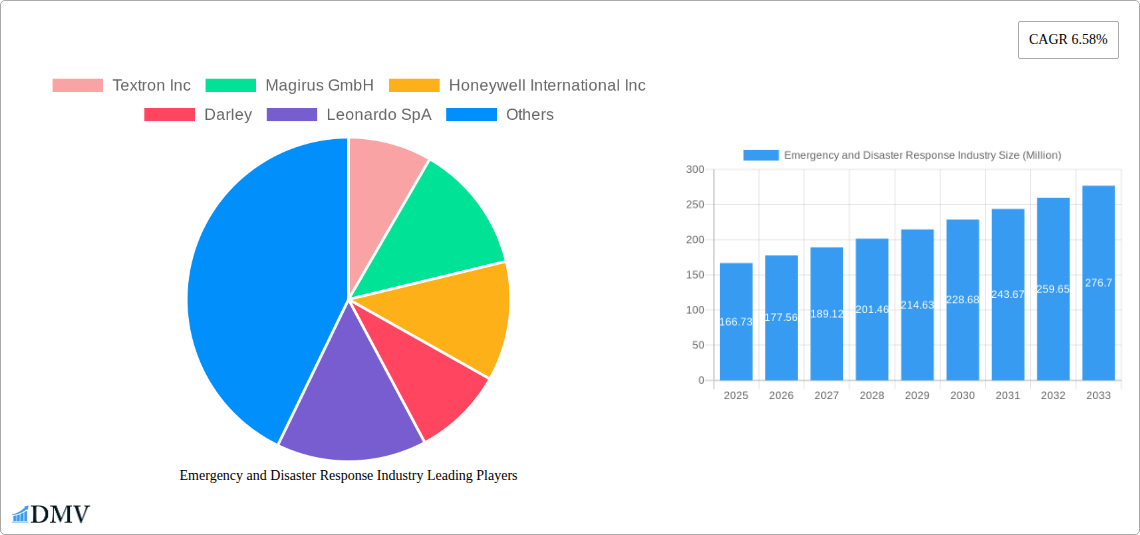
The global emergency and disaster response market, valued at $166.73 million in 2025, is projected to experience robust growth, driven by several key factors. Increasing frequency and intensity of natural disasters, coupled with rising urbanization and population density in vulnerable areas, significantly amplify the demand for effective emergency response systems. Government initiatives promoting preparedness and resilience, along with advancements in technology such as AI-powered predictive analytics and drone technology for search and rescue, are further accelerating market expansion. The market's segmentation reflects the diverse needs within the sector, encompassing specialized equipment like threat detection systems, personal protective gear, medical equipment, and various vehicle platforms (land, marine, and airborne) tailored to specific disaster scenarios. The significant investments in technological advancements are driving innovation in areas such as improved communication systems, enhanced situational awareness tools, and more efficient resource allocation. This technological progress contributes significantly to improving response times and minimizing casualties during emergencies.
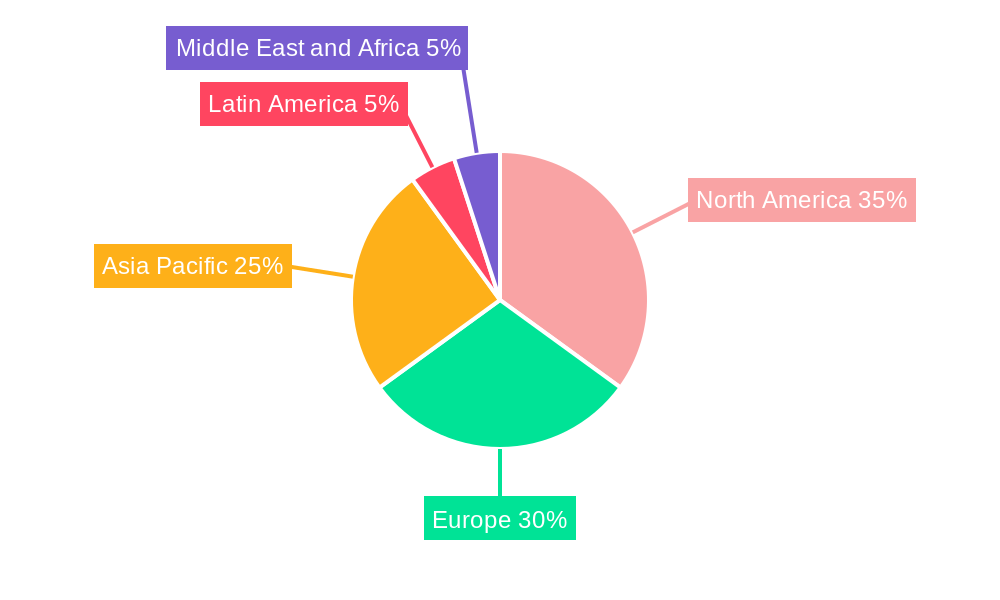
Furthermore, the growth is fueled by a growing awareness of the importance of proactive disaster preparedness. This includes increased investment in training programs for first responders and community-based disaster mitigation strategies. The market also benefits from a growing collaboration between public and private sectors, fostering innovation and efficient resource management. While economic downturns could potentially act as a restraint, the essential nature of emergency response services ensures a relatively stable demand even during challenging economic conditions. Competition within the market is intense, with established players such as Textron Inc., Honeywell International Inc., and Rosenbauer International AG vying for market share alongside emerging companies focusing on niche technologies and solutions. Regional variations in market growth reflect differing levels of infrastructure development and preparedness across the globe. North America and Europe currently hold significant market shares, but the Asia-Pacific region is expected to witness considerable growth driven by economic development and urbanization.
Emergency and Disaster Response Industry Market Report: 2019-2033
This comprehensive report provides an in-depth analysis of the global Emergency and Disaster Response Industry, projecting a market value exceeding $XX Million by 2033. The study covers the period 2019-2033, with a base year of 2025 and a forecast period of 2025-2033. It offers crucial insights into market dynamics, technological advancements, and key players, enabling stakeholders to make informed strategic decisions.
Emergency and Disaster Response Industry Market Composition & Trends
This section delves into the competitive landscape of the Emergency and Disaster Response Industry, evaluating market concentration, innovation drivers, regulatory frameworks, substitute products, end-user profiles, and mergers & acquisitions (M&A) activities. The report analyzes the market share distribution among key players such as Textron Inc, Magirus GmbH, Honeywell International Inc, and others, revealing a moderately consolidated market with significant opportunities for growth. M&A activity analysis includes deal values exceeding $XX Million in the historical period (2019-2024), indicating a trend of consolidation and strategic expansion within the sector. The report further examines the influence of regulatory changes, such as updated safety standards and environmental regulations, on market dynamics. Finally, it profiles end-users, including government agencies, military forces, and private organizations, highlighting their specific needs and purchasing patterns.
- Market Concentration: Moderately consolidated, with top 5 players holding approximately XX% market share in 2025.
- Innovation Catalysts: Increasing demand for advanced technologies, government funding for R&D, and rising awareness of disaster preparedness.
- Regulatory Landscape: Stringent safety standards and environmental regulations driving innovation and shaping product development.
- Substitute Products: Limited, but advancements in alternative technologies pose a potential long-term threat.
- M&A Activity: Significant activity in the historical period (2019-2024), with total deal values exceeding $XX Million. A further $XX Million is predicted in the forecast period.
- End-User Profiles: Government agencies (XX%), Military (XX%), Private Organizations (XX%).
Emergency and Disaster Response Industry Industry Evolution
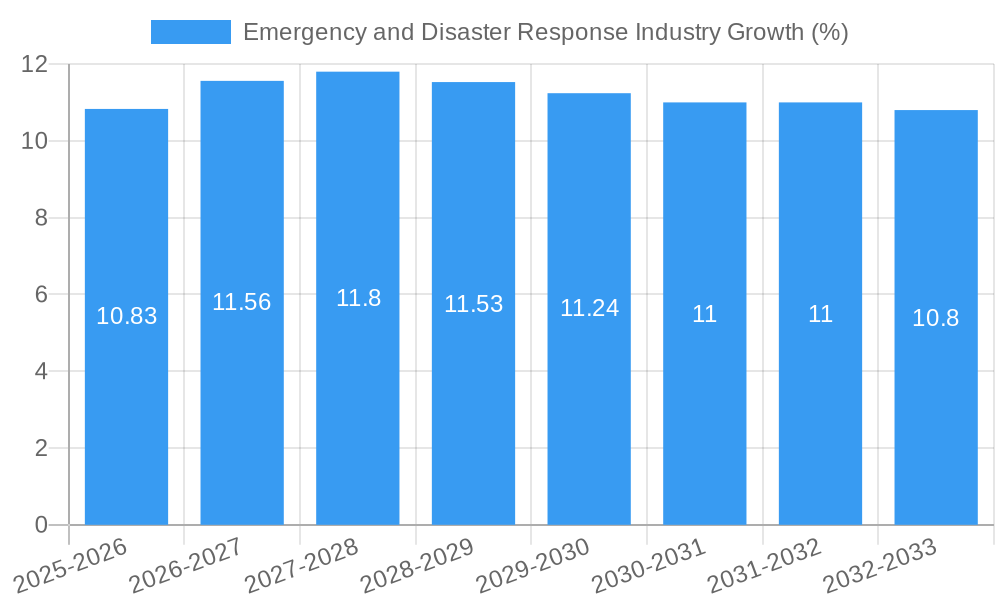
This section analyzes the evolution of the Emergency and Disaster Response Industry, focusing on market growth trajectories, technological advancements, and evolving consumer demands. The industry has experienced significant growth, driven by factors such as increasing frequency and severity of natural disasters, rising urbanization, and heightened awareness of emergency preparedness. Technological advancements, including the integration of AI, IoT, and big data analytics, are transforming emergency response strategies and enhancing operational efficiency. Consumer demands are shifting towards more sophisticated, user-friendly, and technologically advanced solutions. The report projects a compound annual growth rate (CAGR) of XX% from 2025 to 2033, driven by increasing government spending and technological innovation, reaching a market size of $XX Million by 2033. Adoption of AI-powered solutions is projected to reach XX% by 2033.
Leading Regions, Countries, or Segments in Emergency and Disaster Response Industry
North America currently holds the largest market share in the Emergency and Disaster Response Industry, driven by high government spending on disaster preparedness and a well-established emergency response infrastructure. However, the Asia-Pacific region is expected to experience the fastest growth due to rapid urbanization and increasing vulnerability to natural disasters.
- Key Drivers for North America Dominance:
- High government spending on emergency preparedness.
- Well-established emergency response infrastructure.
- Strong technological advancements.
- Key Drivers for Asia-Pacific Growth:
- Rapid urbanization and increasing population density.
- High vulnerability to natural disasters.
- Rising government investments in emergency response systems.
Within equipment segments, Fire Fighting Equipment and Personal Protection Gear command the largest market share, driven by consistent demand and robust technological innovation. In terms of vehicle platforms, Land vehicles dominate the market due to their versatility and accessibility, followed by Airborne vehicles for rapid response in remote areas. The market for Marine vehicles is relatively smaller, largely serving coastal and offshore disaster relief operations.
Emergency and Disaster Response Industry Product Innovations
Recent innovations include the development of advanced threat detection systems, lightweight and durable personal protective gear, and AI-powered medical equipment for improved triage and treatment in emergency situations. These innovations enhance efficiency, improve safety, and streamline response times. Unique selling propositions include improved portability, enhanced durability, and integration of advanced technologies like predictive analytics and real-time data monitoring.
Propelling Factors for Emergency and Disaster Response Industry Growth
Several factors are propelling the growth of the Emergency and Disaster Response Industry. These include increasing government investments in disaster preparedness, rising awareness of the importance of emergency response, and technological advancements resulting in more efficient and effective solutions. The rising frequency and severity of natural disasters, coupled with urbanization, are significant drivers. Technological advancements, including AI-powered predictive analytics and IoT-enabled remote monitoring, are transforming emergency response capabilities.
Obstacles in the Emergency and Disaster Response Industry Market
The Emergency and Disaster Response Industry faces several challenges, including stringent regulatory hurdles impacting product approval and deployment, supply chain disruptions causing material shortages and price increases, and intense competition among established players and new entrants. These factors impact production costs, lead times, and overall market profitability. For example, supply chain disruptions in 2022 resulted in a XX% increase in the price of certain critical components, impacting overall profitability by approximately $XX Million.
Future Opportunities in Emergency and Disaster Response Industry
Emerging opportunities include the expansion into new markets (especially developing economies facing infrastructure gaps and rising disaster risk), the development and adoption of new technologies such as drone-based surveillance and autonomous vehicles, and the increasing focus on sustainability and resilient infrastructure solutions. The integration of AI and machine learning into emergency response systems presents significant potential for improving efficiency and effectiveness.
Major Players in the Emergency and Disaster Response Industry Ecosystem
- Textron Inc
- Magirus GmbH
- Honeywell International Inc
- Darley
- Leonardo SpA
- Smiths Group PLC
- Viking Air Ltd
- Emergency Medical International
- Ziegler GmbH
- 3M
- Juvare LLC
- Emergency One Group
- Everbridge Inc
- Hexagon A
- Esri Inc
- Rosenbauer International AG
- REV Group Inc
Key Developments in Emergency and Disaster Response Industry Industry
- January 2023: Honeywell International Inc. launches a new generation of portable gas detectors, enhancing safety in hazardous environments.
- March 2022: Magirus GmbH and Rosenbauer International AG announce a joint venture to develop next-generation firefighting vehicles.
- June 2021: Textron Inc. acquires a specialized drone technology company to expand its capabilities in aerial surveillance.
Strategic Emergency and Disaster Response Industry Market Forecast
The Emergency and Disaster Response Industry is poised for robust growth, driven by technological innovation, increasing government investments, and rising awareness of disaster preparedness. The market is expected to experience substantial expansion in the forecast period, exceeding $XX Million by 2033, driven by increasing demand for advanced technologies, coupled with opportunities in emerging markets. New technologies, such as AI-powered predictive analytics and drone technology, will further accelerate growth and reshape emergency response capabilities.
Emergency and Disaster Response Industry Segmentation
-
1. Equipment
- 1.1. Threat Detection Equipment
- 1.2. Personal Protection Gear
- 1.3. Medical Equipment
- 1.4. Temporary Shelter Equipment
- 1.5. Mountaineering Equipment
- 1.6. Fire Fighting Equipment
- 1.7. Other Equipment
-
2. Vehicle Platform
- 2.1. Land
- 2.2. Marine
- 2.3. Airborne
Emergency and Disaster Response Industry Segmentation By Geography
-
1. North America
- 1.1. United States
- 1.2. Canada
-
2. Europe
- 2.1. United Kingdom
- 2.2. Germany
- 2.3. France
- 2.4. Italy
- 2.5. Russia
- 2.6. Rest of Europe
-
3. Asia Pacific
- 3.1. China
- 3.2. India
- 3.3. Japan
- 3.4. South Korea
- 3.5. Australia
- 3.6. Rest of Asia Pacific
-
4. Latin America
- 4.1. Brazil
- 4.2. Mexico
- 4.3. Rest of Latin America
-
5. Middle East and Africa
- 5.1. United Arab Emirates
- 5.2. Saudi Arabia
- 5.3. Egypt
- 5.4. South Africa
- 5.5. Rest of Middle East and Africa
Emergency and Disaster Response Industry REPORT HIGHLIGHTS
| Aspects | Details |
|---|---|
| Study Period | 2019-2033 |
| Base Year | 2024 |
| Estimated Year | 2025 |
| Forecast Period | 2025-2033 |
| Historical Period | 2019-2024 |
| Growth Rate | CAGR of 6.58% from 2019-2033 |
| Segmentation |
|
Table of Contents
- 1. Introduction
- 1.1. Research Scope
- 1.2. Market Segmentation
- 1.3. Research Methodology
- 1.4. Definitions and Assumptions
- 2. Executive Summary
- 2.1. Introduction
- 3. Market Dynamics
- 3.1. Introduction
- 3.2. Market Drivers
- 3.2.1. ; Increasing Number Of Air Passengers; Use Of Portable Electronic Devices
- 3.3. Market Restrains
- 3.3.1. ; High Cost Of Connectivity Equipments
- 3.4. Market Trends
- 3.4.1. Land Segment to Register the Highest CAGR during the Forecast Period
- 4. Market Factor Analysis
- 4.1. Porters Five Forces
- 4.2. Supply/Value Chain
- 4.3. PESTEL analysis
- 4.4. Market Entropy
- 4.5. Patent/Trademark Analysis
- 5. Global Emergency and Disaster Response Industry Analysis, Insights and Forecast, 2019-2031
- 5.1. Market Analysis, Insights and Forecast - by Equipment
- 5.1.1. Threat Detection Equipment
- 5.1.2. Personal Protection Gear
- 5.1.3. Medical Equipment
- 5.1.4. Temporary Shelter Equipment
- 5.1.5. Mountaineering Equipment
- 5.1.6. Fire Fighting Equipment
- 5.1.7. Other Equipment
- 5.2. Market Analysis, Insights and Forecast - by Vehicle Platform
- 5.2.1. Land
- 5.2.2. Marine
- 5.2.3. Airborne
- 5.3. Market Analysis, Insights and Forecast - by Region
- 5.3.1. North America
- 5.3.2. Europe
- 5.3.3. Asia Pacific
- 5.3.4. Latin America
- 5.3.5. Middle East and Africa
- 5.1. Market Analysis, Insights and Forecast - by Equipment
- 6. North America Emergency and Disaster Response Industry Analysis, Insights and Forecast, 2019-2031
- 6.1. Market Analysis, Insights and Forecast - by Equipment
- 6.1.1. Threat Detection Equipment
- 6.1.2. Personal Protection Gear
- 6.1.3. Medical Equipment
- 6.1.4. Temporary Shelter Equipment
- 6.1.5. Mountaineering Equipment
- 6.1.6. Fire Fighting Equipment
- 6.1.7. Other Equipment
- 6.2. Market Analysis, Insights and Forecast - by Vehicle Platform
- 6.2.1. Land
- 6.2.2. Marine
- 6.2.3. Airborne
- 6.1. Market Analysis, Insights and Forecast - by Equipment
- 7. Europe Emergency and Disaster Response Industry Analysis, Insights and Forecast, 2019-2031
- 7.1. Market Analysis, Insights and Forecast - by Equipment
- 7.1.1. Threat Detection Equipment
- 7.1.2. Personal Protection Gear
- 7.1.3. Medical Equipment
- 7.1.4. Temporary Shelter Equipment
- 7.1.5. Mountaineering Equipment
- 7.1.6. Fire Fighting Equipment
- 7.1.7. Other Equipment
- 7.2. Market Analysis, Insights and Forecast - by Vehicle Platform
- 7.2.1. Land
- 7.2.2. Marine
- 7.2.3. Airborne
- 7.1. Market Analysis, Insights and Forecast - by Equipment
- 8. Asia Pacific Emergency and Disaster Response Industry Analysis, Insights and Forecast, 2019-2031
- 8.1. Market Analysis, Insights and Forecast - by Equipment
- 8.1.1. Threat Detection Equipment
- 8.1.2. Personal Protection Gear
- 8.1.3. Medical Equipment
- 8.1.4. Temporary Shelter Equipment
- 8.1.5. Mountaineering Equipment
- 8.1.6. Fire Fighting Equipment
- 8.1.7. Other Equipment
- 8.2. Market Analysis, Insights and Forecast - by Vehicle Platform
- 8.2.1. Land
- 8.2.2. Marine
- 8.2.3. Airborne
- 8.1. Market Analysis, Insights and Forecast - by Equipment
- 9. Latin America Emergency and Disaster Response Industry Analysis, Insights and Forecast, 2019-2031
- 9.1. Market Analysis, Insights and Forecast - by Equipment
- 9.1.1. Threat Detection Equipment
- 9.1.2. Personal Protection Gear
- 9.1.3. Medical Equipment
- 9.1.4. Temporary Shelter Equipment
- 9.1.5. Mountaineering Equipment
- 9.1.6. Fire Fighting Equipment
- 9.1.7. Other Equipment
- 9.2. Market Analysis, Insights and Forecast - by Vehicle Platform
- 9.2.1. Land
- 9.2.2. Marine
- 9.2.3. Airborne
- 9.1. Market Analysis, Insights and Forecast - by Equipment
- 10. Middle East and Africa Emergency and Disaster Response Industry Analysis, Insights and Forecast, 2019-2031
- 10.1. Market Analysis, Insights and Forecast - by Equipment
- 10.1.1. Threat Detection Equipment
- 10.1.2. Personal Protection Gear
- 10.1.3. Medical Equipment
- 10.1.4. Temporary Shelter Equipment
- 10.1.5. Mountaineering Equipment
- 10.1.6. Fire Fighting Equipment
- 10.1.7. Other Equipment
- 10.2. Market Analysis, Insights and Forecast - by Vehicle Platform
- 10.2.1. Land
- 10.2.2. Marine
- 10.2.3. Airborne
- 10.1. Market Analysis, Insights and Forecast - by Equipment
- 11. North America Emergency and Disaster Response Industry Analysis, Insights and Forecast, 2019-2031
- 11.1. Market Analysis, Insights and Forecast - By Country/Sub-region
- 11.1.1 United States
- 11.1.2 Canada
- 12. Europe Emergency and Disaster Response Industry Analysis, Insights and Forecast, 2019-2031
- 12.1. Market Analysis, Insights and Forecast - By Country/Sub-region
- 12.1.1 United Kingdom
- 12.1.2 Germany
- 12.1.3 France
- 12.1.4 Italy
- 12.1.5 Russia
- 12.1.6 Rest of Europe
- 13. Asia Pacific Emergency and Disaster Response Industry Analysis, Insights and Forecast, 2019-2031
- 13.1. Market Analysis, Insights and Forecast - By Country/Sub-region
- 13.1.1 China
- 13.1.2 India
- 13.1.3 Japan
- 13.1.4 South Korea
- 13.1.5 Australia
- 13.1.6 Rest of Asia Pacific
- 14. Latin America Emergency and Disaster Response Industry Analysis, Insights and Forecast, 2019-2031
- 14.1. Market Analysis, Insights and Forecast - By Country/Sub-region
- 14.1.1 Brazil
- 14.1.2 Mexico
- 14.1.3 Rest of Latin America
- 15. Middle East and Africa Emergency and Disaster Response Industry Analysis, Insights and Forecast, 2019-2031
- 15.1. Market Analysis, Insights and Forecast - By Country/Sub-region
- 15.1.1 United Arab Emirates
- 15.1.2 Saudi Arabia
- 15.1.3 Egypt
- 15.1.4 South Africa
- 15.1.5 Rest of Middle East and Africa
- 16. Competitive Analysis
- 16.1. Global Market Share Analysis 2024
- 16.2. Company Profiles
- 16.2.1 Textron Inc
- 16.2.1.1. Overview
- 16.2.1.2. Products
- 16.2.1.3. SWOT Analysis
- 16.2.1.4. Recent Developments
- 16.2.1.5. Financials (Based on Availability)
- 16.2.2 Magirus GmbH
- 16.2.2.1. Overview
- 16.2.2.2. Products
- 16.2.2.3. SWOT Analysis
- 16.2.2.4. Recent Developments
- 16.2.2.5. Financials (Based on Availability)
- 16.2.3 Honeywell International Inc
- 16.2.3.1. Overview
- 16.2.3.2. Products
- 16.2.3.3. SWOT Analysis
- 16.2.3.4. Recent Developments
- 16.2.3.5. Financials (Based on Availability)
- 16.2.4 Darley
- 16.2.4.1. Overview
- 16.2.4.2. Products
- 16.2.4.3. SWOT Analysis
- 16.2.4.4. Recent Developments
- 16.2.4.5. Financials (Based on Availability)
- 16.2.5 Leonardo SpA
- 16.2.5.1. Overview
- 16.2.5.2. Products
- 16.2.5.3. SWOT Analysis
- 16.2.5.4. Recent Developments
- 16.2.5.5. Financials (Based on Availability)
- 16.2.6 Smiths Group PLC
- 16.2.6.1. Overview
- 16.2.6.2. Products
- 16.2.6.3. SWOT Analysis
- 16.2.6.4. Recent Developments
- 16.2.6.5. Financials (Based on Availability)
- 16.2.7 Viking Air Ltd
- 16.2.7.1. Overview
- 16.2.7.2. Products
- 16.2.7.3. SWOT Analysis
- 16.2.7.4. Recent Developments
- 16.2.7.5. Financials (Based on Availability)
- 16.2.8 Emergency Medical International
- 16.2.8.1. Overview
- 16.2.8.2. Products
- 16.2.8.3. SWOT Analysis
- 16.2.8.4. Recent Developments
- 16.2.8.5. Financials (Based on Availability)
- 16.2.9 Ziegler GmbH
- 16.2.9.1. Overview
- 16.2.9.2. Products
- 16.2.9.3. SWOT Analysis
- 16.2.9.4. Recent Developments
- 16.2.9.5. Financials (Based on Availability)
- 16.2.10 3M
- 16.2.10.1. Overview
- 16.2.10.2. Products
- 16.2.10.3. SWOT Analysis
- 16.2.10.4. Recent Developments
- 16.2.10.5. Financials (Based on Availability)
- 16.2.11 Juvare LLC
- 16.2.11.1. Overview
- 16.2.11.2. Products
- 16.2.11.3. SWOT Analysis
- 16.2.11.4. Recent Developments
- 16.2.11.5. Financials (Based on Availability)
- 16.2.12 Emergency One Group
- 16.2.12.1. Overview
- 16.2.12.2. Products
- 16.2.12.3. SWOT Analysis
- 16.2.12.4. Recent Developments
- 16.2.12.5. Financials (Based on Availability)
- 16.2.13 Everbridge Inc
- 16.2.13.1. Overview
- 16.2.13.2. Products
- 16.2.13.3. SWOT Analysis
- 16.2.13.4. Recent Developments
- 16.2.13.5. Financials (Based on Availability)
- 16.2.14 Hexagon A
- 16.2.14.1. Overview
- 16.2.14.2. Products
- 16.2.14.3. SWOT Analysis
- 16.2.14.4. Recent Developments
- 16.2.14.5. Financials (Based on Availability)
- 16.2.15 Esri Inc
- 16.2.15.1. Overview
- 16.2.15.2. Products
- 16.2.15.3. SWOT Analysis
- 16.2.15.4. Recent Developments
- 16.2.15.5. Financials (Based on Availability)
- 16.2.16 Rosenbauer International AG
- 16.2.16.1. Overview
- 16.2.16.2. Products
- 16.2.16.3. SWOT Analysis
- 16.2.16.4. Recent Developments
- 16.2.16.5. Financials (Based on Availability)
- 16.2.17 REV Group Inc
- 16.2.17.1. Overview
- 16.2.17.2. Products
- 16.2.17.3. SWOT Analysis
- 16.2.17.4. Recent Developments
- 16.2.17.5. Financials (Based on Availability)
- 16.2.1 Textron Inc
List of Figures
- Figure 1: Global Emergency and Disaster Response Industry Revenue Breakdown (Million, %) by Region 2024 & 2032
- Figure 2: North America Emergency and Disaster Response Industry Revenue (Million), by Country 2024 & 2032
- Figure 3: North America Emergency and Disaster Response Industry Revenue Share (%), by Country 2024 & 2032
- Figure 4: Europe Emergency and Disaster Response Industry Revenue (Million), by Country 2024 & 2032
- Figure 5: Europe Emergency and Disaster Response Industry Revenue Share (%), by Country 2024 & 2032
- Figure 6: Asia Pacific Emergency and Disaster Response Industry Revenue (Million), by Country 2024 & 2032
- Figure 7: Asia Pacific Emergency and Disaster Response Industry Revenue Share (%), by Country 2024 & 2032
- Figure 8: Latin America Emergency and Disaster Response Industry Revenue (Million), by Country 2024 & 2032
- Figure 9: Latin America Emergency and Disaster Response Industry Revenue Share (%), by Country 2024 & 2032
- Figure 10: Middle East and Africa Emergency and Disaster Response Industry Revenue (Million), by Country 2024 & 2032
- Figure 11: Middle East and Africa Emergency and Disaster Response Industry Revenue Share (%), by Country 2024 & 2032
- Figure 12: North America Emergency and Disaster Response Industry Revenue (Million), by Equipment 2024 & 2032
- Figure 13: North America Emergency and Disaster Response Industry Revenue Share (%), by Equipment 2024 & 2032
- Figure 14: North America Emergency and Disaster Response Industry Revenue (Million), by Vehicle Platform 2024 & 2032
- Figure 15: North America Emergency and Disaster Response Industry Revenue Share (%), by Vehicle Platform 2024 & 2032
- Figure 16: North America Emergency and Disaster Response Industry Revenue (Million), by Country 2024 & 2032
- Figure 17: North America Emergency and Disaster Response Industry Revenue Share (%), by Country 2024 & 2032
- Figure 18: Europe Emergency and Disaster Response Industry Revenue (Million), by Equipment 2024 & 2032
- Figure 19: Europe Emergency and Disaster Response Industry Revenue Share (%), by Equipment 2024 & 2032
- Figure 20: Europe Emergency and Disaster Response Industry Revenue (Million), by Vehicle Platform 2024 & 2032
- Figure 21: Europe Emergency and Disaster Response Industry Revenue Share (%), by Vehicle Platform 2024 & 2032
- Figure 22: Europe Emergency and Disaster Response Industry Revenue (Million), by Country 2024 & 2032
- Figure 23: Europe Emergency and Disaster Response Industry Revenue Share (%), by Country 2024 & 2032
- Figure 24: Asia Pacific Emergency and Disaster Response Industry Revenue (Million), by Equipment 2024 & 2032
- Figure 25: Asia Pacific Emergency and Disaster Response Industry Revenue Share (%), by Equipment 2024 & 2032
- Figure 26: Asia Pacific Emergency and Disaster Response Industry Revenue (Million), by Vehicle Platform 2024 & 2032
- Figure 27: Asia Pacific Emergency and Disaster Response Industry Revenue Share (%), by Vehicle Platform 2024 & 2032
- Figure 28: Asia Pacific Emergency and Disaster Response Industry Revenue (Million), by Country 2024 & 2032
- Figure 29: Asia Pacific Emergency and Disaster Response Industry Revenue Share (%), by Country 2024 & 2032
- Figure 30: Latin America Emergency and Disaster Response Industry Revenue (Million), by Equipment 2024 & 2032
- Figure 31: Latin America Emergency and Disaster Response Industry Revenue Share (%), by Equipment 2024 & 2032
- Figure 32: Latin America Emergency and Disaster Response Industry Revenue (Million), by Vehicle Platform 2024 & 2032
- Figure 33: Latin America Emergency and Disaster Response Industry Revenue Share (%), by Vehicle Platform 2024 & 2032
- Figure 34: Latin America Emergency and Disaster Response Industry Revenue (Million), by Country 2024 & 2032
- Figure 35: Latin America Emergency and Disaster Response Industry Revenue Share (%), by Country 2024 & 2032
- Figure 36: Middle East and Africa Emergency and Disaster Response Industry Revenue (Million), by Equipment 2024 & 2032
- Figure 37: Middle East and Africa Emergency and Disaster Response Industry Revenue Share (%), by Equipment 2024 & 2032
- Figure 38: Middle East and Africa Emergency and Disaster Response Industry Revenue (Million), by Vehicle Platform 2024 & 2032
- Figure 39: Middle East and Africa Emergency and Disaster Response Industry Revenue Share (%), by Vehicle Platform 2024 & 2032
- Figure 40: Middle East and Africa Emergency and Disaster Response Industry Revenue (Million), by Country 2024 & 2032
- Figure 41: Middle East and Africa Emergency and Disaster Response Industry Revenue Share (%), by Country 2024 & 2032
List of Tables
- Table 1: Global Emergency and Disaster Response Industry Revenue Million Forecast, by Region 2019 & 2032
- Table 2: Global Emergency and Disaster Response Industry Revenue Million Forecast, by Equipment 2019 & 2032
- Table 3: Global Emergency and Disaster Response Industry Revenue Million Forecast, by Vehicle Platform 2019 & 2032
- Table 4: Global Emergency and Disaster Response Industry Revenue Million Forecast, by Region 2019 & 2032
- Table 5: Global Emergency and Disaster Response Industry Revenue Million Forecast, by Country 2019 & 2032
- Table 6: United States Emergency and Disaster Response Industry Revenue (Million) Forecast, by Application 2019 & 2032
- Table 7: Canada Emergency and Disaster Response Industry Revenue (Million) Forecast, by Application 2019 & 2032
- Table 8: Global Emergency and Disaster Response Industry Revenue Million Forecast, by Country 2019 & 2032
- Table 9: United Kingdom Emergency and Disaster Response Industry Revenue (Million) Forecast, by Application 2019 & 2032
- Table 10: Germany Emergency and Disaster Response Industry Revenue (Million) Forecast, by Application 2019 & 2032
- Table 11: France Emergency and Disaster Response Industry Revenue (Million) Forecast, by Application 2019 & 2032
- Table 12: Italy Emergency and Disaster Response Industry Revenue (Million) Forecast, by Application 2019 & 2032
- Table 13: Russia Emergency and Disaster Response Industry Revenue (Million) Forecast, by Application 2019 & 2032
- Table 14: Rest of Europe Emergency and Disaster Response Industry Revenue (Million) Forecast, by Application 2019 & 2032
- Table 15: Global Emergency and Disaster Response Industry Revenue Million Forecast, by Country 2019 & 2032
- Table 16: China Emergency and Disaster Response Industry Revenue (Million) Forecast, by Application 2019 & 2032
- Table 17: India Emergency and Disaster Response Industry Revenue (Million) Forecast, by Application 2019 & 2032
- Table 18: Japan Emergency and Disaster Response Industry Revenue (Million) Forecast, by Application 2019 & 2032
- Table 19: South Korea Emergency and Disaster Response Industry Revenue (Million) Forecast, by Application 2019 & 2032
- Table 20: Australia Emergency and Disaster Response Industry Revenue (Million) Forecast, by Application 2019 & 2032
- Table 21: Rest of Asia Pacific Emergency and Disaster Response Industry Revenue (Million) Forecast, by Application 2019 & 2032
- Table 22: Global Emergency and Disaster Response Industry Revenue Million Forecast, by Country 2019 & 2032
- Table 23: Brazil Emergency and Disaster Response Industry Revenue (Million) Forecast, by Application 2019 & 2032
- Table 24: Mexico Emergency and Disaster Response Industry Revenue (Million) Forecast, by Application 2019 & 2032
- Table 25: Rest of Latin America Emergency and Disaster Response Industry Revenue (Million) Forecast, by Application 2019 & 2032
- Table 26: Global Emergency and Disaster Response Industry Revenue Million Forecast, by Country 2019 & 2032
- Table 27: United Arab Emirates Emergency and Disaster Response Industry Revenue (Million) Forecast, by Application 2019 & 2032
- Table 28: Saudi Arabia Emergency and Disaster Response Industry Revenue (Million) Forecast, by Application 2019 & 2032
- Table 29: Egypt Emergency and Disaster Response Industry Revenue (Million) Forecast, by Application 2019 & 2032
- Table 30: South Africa Emergency and Disaster Response Industry Revenue (Million) Forecast, by Application 2019 & 2032
- Table 31: Rest of Middle East and Africa Emergency and Disaster Response Industry Revenue (Million) Forecast, by Application 2019 & 2032
- Table 32: Global Emergency and Disaster Response Industry Revenue Million Forecast, by Equipment 2019 & 2032
- Table 33: Global Emergency and Disaster Response Industry Revenue Million Forecast, by Vehicle Platform 2019 & 2032
- Table 34: Global Emergency and Disaster Response Industry Revenue Million Forecast, by Country 2019 & 2032
- Table 35: United States Emergency and Disaster Response Industry Revenue (Million) Forecast, by Application 2019 & 2032
- Table 36: Canada Emergency and Disaster Response Industry Revenue (Million) Forecast, by Application 2019 & 2032
- Table 37: Global Emergency and Disaster Response Industry Revenue Million Forecast, by Equipment 2019 & 2032
- Table 38: Global Emergency and Disaster Response Industry Revenue Million Forecast, by Vehicle Platform 2019 & 2032
- Table 39: Global Emergency and Disaster Response Industry Revenue Million Forecast, by Country 2019 & 2032
- Table 40: United Kingdom Emergency and Disaster Response Industry Revenue (Million) Forecast, by Application 2019 & 2032
- Table 41: Germany Emergency and Disaster Response Industry Revenue (Million) Forecast, by Application 2019 & 2032
- Table 42: France Emergency and Disaster Response Industry Revenue (Million) Forecast, by Application 2019 & 2032
- Table 43: Italy Emergency and Disaster Response Industry Revenue (Million) Forecast, by Application 2019 & 2032
- Table 44: Russia Emergency and Disaster Response Industry Revenue (Million) Forecast, by Application 2019 & 2032
- Table 45: Rest of Europe Emergency and Disaster Response Industry Revenue (Million) Forecast, by Application 2019 & 2032
- Table 46: Global Emergency and Disaster Response Industry Revenue Million Forecast, by Equipment 2019 & 2032
- Table 47: Global Emergency and Disaster Response Industry Revenue Million Forecast, by Vehicle Platform 2019 & 2032
- Table 48: Global Emergency and Disaster Response Industry Revenue Million Forecast, by Country 2019 & 2032
- Table 49: China Emergency and Disaster Response Industry Revenue (Million) Forecast, by Application 2019 & 2032
- Table 50: India Emergency and Disaster Response Industry Revenue (Million) Forecast, by Application 2019 & 2032
- Table 51: Japan Emergency and Disaster Response Industry Revenue (Million) Forecast, by Application 2019 & 2032
- Table 52: South Korea Emergency and Disaster Response Industry Revenue (Million) Forecast, by Application 2019 & 2032
- Table 53: Australia Emergency and Disaster Response Industry Revenue (Million) Forecast, by Application 2019 & 2032
- Table 54: Rest of Asia Pacific Emergency and Disaster Response Industry Revenue (Million) Forecast, by Application 2019 & 2032
- Table 55: Global Emergency and Disaster Response Industry Revenue Million Forecast, by Equipment 2019 & 2032
- Table 56: Global Emergency and Disaster Response Industry Revenue Million Forecast, by Vehicle Platform 2019 & 2032
- Table 57: Global Emergency and Disaster Response Industry Revenue Million Forecast, by Country 2019 & 2032
- Table 58: Brazil Emergency and Disaster Response Industry Revenue (Million) Forecast, by Application 2019 & 2032
- Table 59: Mexico Emergency and Disaster Response Industry Revenue (Million) Forecast, by Application 2019 & 2032
- Table 60: Rest of Latin America Emergency and Disaster Response Industry Revenue (Million) Forecast, by Application 2019 & 2032
- Table 61: Global Emergency and Disaster Response Industry Revenue Million Forecast, by Equipment 2019 & 2032
- Table 62: Global Emergency and Disaster Response Industry Revenue Million Forecast, by Vehicle Platform 2019 & 2032
- Table 63: Global Emergency and Disaster Response Industry Revenue Million Forecast, by Country 2019 & 2032
- Table 64: United Arab Emirates Emergency and Disaster Response Industry Revenue (Million) Forecast, by Application 2019 & 2032
- Table 65: Saudi Arabia Emergency and Disaster Response Industry Revenue (Million) Forecast, by Application 2019 & 2032
- Table 66: Egypt Emergency and Disaster Response Industry Revenue (Million) Forecast, by Application 2019 & 2032
- Table 67: South Africa Emergency and Disaster Response Industry Revenue (Million) Forecast, by Application 2019 & 2032
- Table 68: Rest of Middle East and Africa Emergency and Disaster Response Industry Revenue (Million) Forecast, by Application 2019 & 2032
Frequently Asked Questions
1. What is the projected Compound Annual Growth Rate (CAGR) of the Emergency and Disaster Response Industry?
The projected CAGR is approximately 6.58%.
2. Which companies are prominent players in the Emergency and Disaster Response Industry?
Key companies in the market include Textron Inc, Magirus GmbH, Honeywell International Inc, Darley, Leonardo SpA, Smiths Group PLC, Viking Air Ltd, Emergency Medical International, Ziegler GmbH, 3M, Juvare LLC, Emergency One Group, Everbridge Inc, Hexagon A, Esri Inc, Rosenbauer International AG, REV Group Inc.
3. What are the main segments of the Emergency and Disaster Response Industry?
The market segments include Equipment, Vehicle Platform.
4. Can you provide details about the market size?
The market size is estimated to be USD 166.73 Million as of 2022.
5. What are some drivers contributing to market growth?
; Increasing Number Of Air Passengers; Use Of Portable Electronic Devices.
6. What are the notable trends driving market growth?
Land Segment to Register the Highest CAGR during the Forecast Period.
7. Are there any restraints impacting market growth?
; High Cost Of Connectivity Equipments.
8. Can you provide examples of recent developments in the market?
N/A
9. What pricing options are available for accessing the report?
Pricing options include single-user, multi-user, and enterprise licenses priced at USD 4750, USD 5250, and USD 8750 respectively.
10. Is the market size provided in terms of value or volume?
The market size is provided in terms of value, measured in Million.
11. Are there any specific market keywords associated with the report?
Yes, the market keyword associated with the report is "Emergency and Disaster Response Industry," which aids in identifying and referencing the specific market segment covered.
12. How do I determine which pricing option suits my needs best?
The pricing options vary based on user requirements and access needs. Individual users may opt for single-user licenses, while businesses requiring broader access may choose multi-user or enterprise licenses for cost-effective access to the report.
13. Are there any additional resources or data provided in the Emergency and Disaster Response Industry report?
While the report offers comprehensive insights, it's advisable to review the specific contents or supplementary materials provided to ascertain if additional resources or data are available.
14. How can I stay updated on further developments or reports in the Emergency and Disaster Response Industry?
To stay informed about further developments, trends, and reports in the Emergency and Disaster Response Industry, consider subscribing to industry newsletters, following relevant companies and organizations, or regularly checking reputable industry news sources and publications.
Methodology
Step 1 - Identification of Relevant Samples Size from Population Database


Step 2 - Approaches for Defining Global Market Size (Value, Volume* & Price*)

Note*: In applicable scenarios
Step 3 - Data Sources
Primary Research
- Web Analytics
- Survey Reports
- Research Institute
- Latest Research Reports
- Opinion Leaders
Secondary Research
- Annual Reports
- White Paper
- Latest Press Release
- Industry Association
- Paid Database
- Investor Presentations

Step 4 - Data Triangulation
Involves using different sources of information in order to increase the validity of a study
These sources are likely to be stakeholders in a program - participants, other researchers, program staff, other community members, and so on.
Then we put all data in single framework & apply various statistical tools to find out the dynamic on the market.
During the analysis stage, feedback from the stakeholder groups would be compared to determine areas of agreement as well as areas of divergence
