

Key Insights
The global electrolyte battery market is experiencing robust growth, projected to reach a substantial size by 2033, driven by the increasing demand for energy storage solutions across various sectors. The 11.60% CAGR indicates a significant upward trajectory, fueled primarily by the burgeoning electric vehicle (EV) market and the expanding need for grid-scale energy storage systems to accommodate renewable energy sources. Lithium-ion batteries currently dominate the market, owing to their high energy density and relatively long lifespan, while other battery types, such as flow batteries and lead-acid batteries, cater to specific niche applications. Market segmentation by electrolyte type (lead-acid, gel, liquid, zinc bromide, etc.) and end-user (electric vehicles, energy storage, consumer electronics) highlights the diverse applications driving market expansion. Geographic distribution shows strong growth in Asia Pacific, particularly in China and Japan, due to large-scale EV adoption and government support for renewable energy initiatives. North America and Europe also exhibit significant market presence, driven by strong consumer demand for EVs and energy storage solutions. While the market faces challenges such as raw material price volatility and environmental concerns related to battery production and disposal, ongoing technological advancements in battery chemistry and improved recycling infrastructure are expected to mitigate these restraints, sustaining the overall market growth.
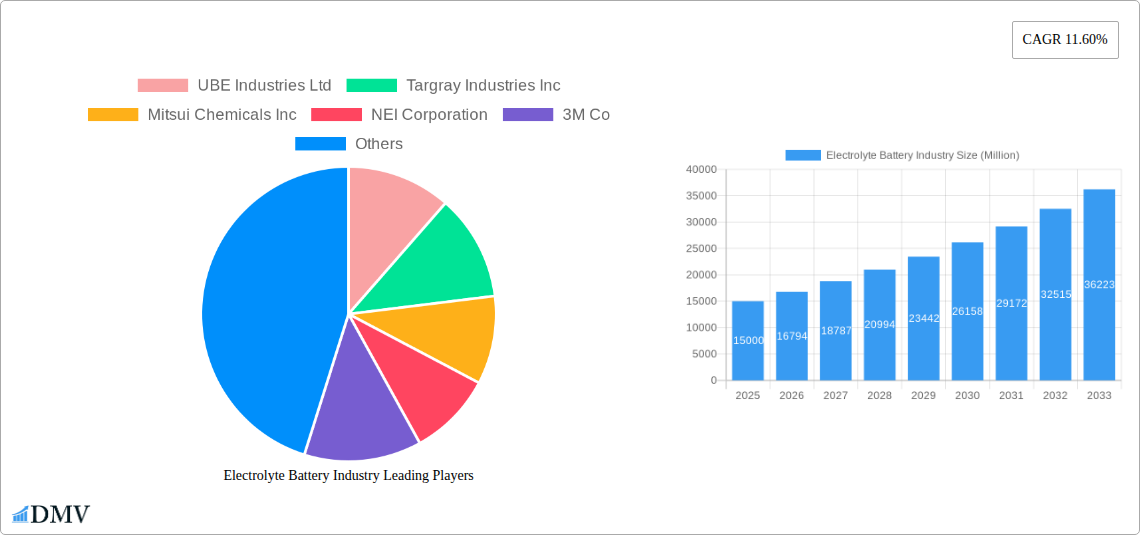
The competitive landscape is marked by a mix of established chemical companies and specialized battery manufacturers. Companies like UBE Industries Ltd, Targray Industries Inc, and Mitsui Chemicals Inc play a vital role in supplying key electrolyte materials. The intense competition fosters innovation and drives down costs, benefiting end-users. Looking ahead, the electrolyte battery market's success hinges on further improvements in battery technology, particularly in enhancing energy density, lifespan, and safety, alongside addressing sustainability concerns through improved recycling processes and the development of more environmentally friendly electrolyte materials. Government regulations and incentives promoting EV adoption and renewable energy integration will further contribute to market expansion in the coming years. The market's future looks bright, with continuous growth fueled by technological advancements and increasing global demand.
Electrolyte Battery Industry: A Comprehensive Market Report (2019-2033)
This insightful report provides a detailed analysis of the Electrolyte Battery Industry, encompassing market size, segmentation, leading players, technological advancements, and future growth prospects. Covering the period from 2019 to 2033, with a base year of 2025 and a forecast period of 2025-2033, this report is an essential resource for stakeholders seeking to understand and capitalize on opportunities within this dynamic sector. The total market size is projected to reach xx Million by 2033.
Electrolyte Battery Industry Market Composition & Trends
This section evaluates the Electrolyte Battery Industry's competitive landscape, analyzing market concentration, key innovation drivers, regulatory influences, substitute product impacts, end-user behavior, and mergers & acquisitions (M&A) activity. The market is moderately concentrated, with several key players holding significant market share. However, the emergence of new technologies and entrants is increasing competition.
- Market Share Distribution: Lithium-ion batteries dominate the market, holding approximately 60% share in 2025, followed by Lead-Acid batteries at 25%, and Flow batteries at 10%. Other battery types account for the remaining 5%. This distribution is expected to shift with growing demand for energy storage solutions.
- M&A Activity: The industry has witnessed significant M&A activity in recent years, with deal values exceeding xx Million in the period 2019-2024. These activities reflect the strategic importance of securing supply chains and technological advantages. For example, the acquisition of xx company by xx company in 2023 valued at xx Million strengthened the acquirer's position in the lithium-ion battery electrolyte market.
- Innovation Catalysts: Government incentives for electric vehicle adoption and renewable energy storage are significant drivers of innovation. Research and development efforts focused on enhancing energy density, lifespan, and safety are constantly shaping the industry.
- Regulatory Landscape: Stringent environmental regulations and safety standards are influencing the adoption of certain battery types and electrolytes, particularly impacting the use of lead-acid batteries.
Electrolyte Battery Industry Industry Evolution
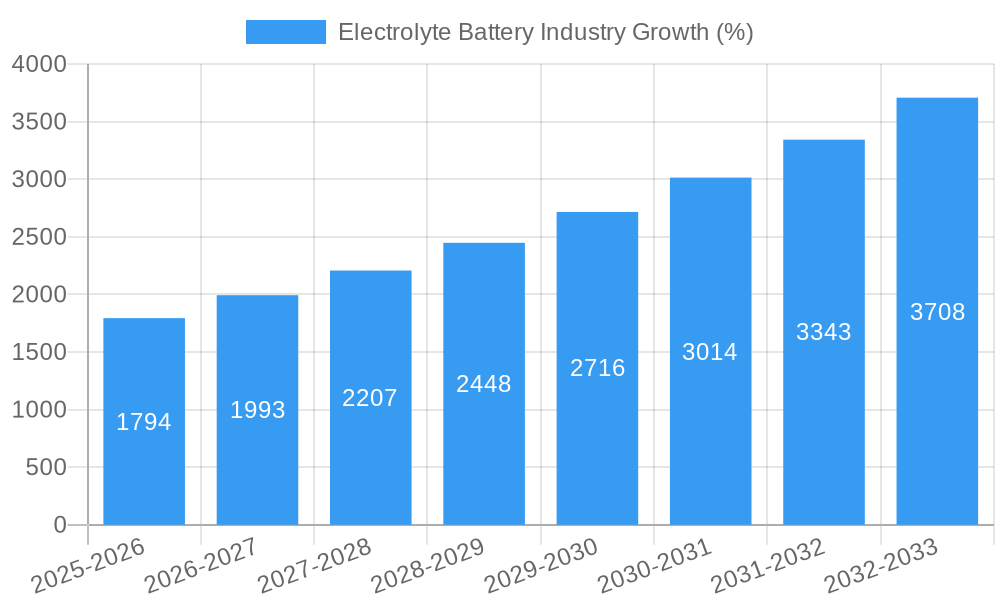
The Electrolyte Battery Industry has witnessed substantial growth over the past few years, driven by technological advancements and the rising demand for energy storage solutions. The historical period (2019-2024) saw a Compound Annual Growth Rate (CAGR) of approximately xx%, primarily fueled by the growth of the electric vehicle market. The growth trajectory is projected to continue, with a forecasted CAGR of xx% during the forecast period (2025-2033), exceeding xx Million by 2033. Technological advancements, particularly in lithium-ion battery technology, are playing a critical role in this growth. The shift toward higher energy density batteries and improved safety features are key factors. Consumer demand for portable electronic devices and electric vehicles continues to drive the market, while the increasing adoption of renewable energy sources is bolstering the energy storage sector, creating a significant demand for flow batteries and other advanced storage systems.
Leading Regions, Countries, or Segments in Electrolyte Battery Industry
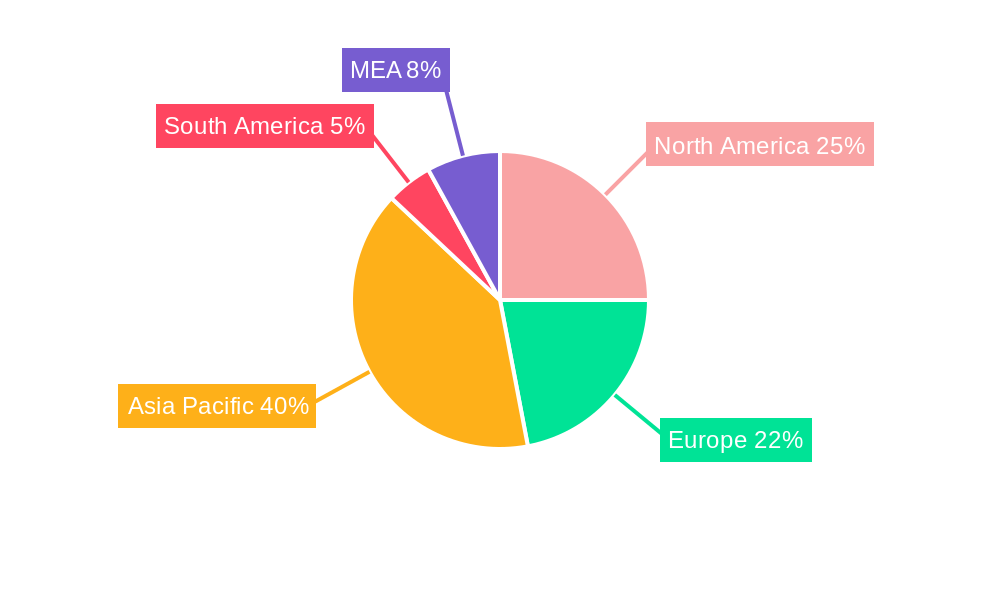
- Dominant Regions: Asia-Pacific, particularly China, currently leads the Electrolyte Battery Industry due to robust manufacturing capabilities, government support, and a large consumer base. North America and Europe are significant markets with considerable growth potential.
- Dominant Battery Type: Lithium-ion batteries are the dominant segment due to their high energy density, making them suitable for electric vehicles and portable electronics. However, the flow battery segment is experiencing substantial growth, driven by large-scale energy storage applications.
- Key Drivers:
- Significant Investment: Massive investments in research and development and manufacturing facilities are driving growth in key regions.
- Government Policies: Government subsidies and regulations promoting renewable energy and electric vehicle adoption are propelling market expansion.
- Technological Advancements: Continuous improvements in battery technology, such as enhanced energy density and lifespan, are increasing market appeal.
Electrolyte Battery Industry Product Innovations
Recent innovations have focused on improving energy density, extending battery lifespan, enhancing safety features, and reducing production costs. Solid-state batteries, for example, are emerging as a promising technology, offering potentially higher energy density and improved safety compared to traditional lithium-ion batteries. Advances in electrolyte materials are improving battery performance and reducing production costs. These innovations are driving wider adoption across diverse applications.
Propelling Factors for Electrolyte Battery Industry Growth
Technological advancements, economic factors, and regulatory support are all driving growth. Technological improvements lead to higher energy density and longer lifespans, enhancing the attractiveness of electric vehicles and energy storage systems. Government incentives and subsidies for renewable energy and electric vehicle adoption are also substantial drivers. Furthermore, the declining cost of battery production is making them increasingly affordable, contributing to market expansion.
Obstacles in the Electrolyte Battery Industry Market
The industry faces several challenges, including supply chain disruptions, particularly for critical raw materials like lithium and cobalt, leading to price volatility. The stringent regulatory environment surrounding battery safety and environmental impact necessitates compliance costs. Intense competition among manufacturers also exerts downward pressure on prices and profit margins.
Future Opportunities in Electrolyte Battery Industry
Significant opportunities exist in emerging markets, particularly in developing economies with growing energy demands and infrastructure development. The development of advanced battery technologies, such as solid-state batteries and improved flow battery designs, presents substantial growth potential. The increasing adoption of electric vehicles and renewable energy sources will continue to fuel demand.
Major Players in the Electrolyte Battery Industry Ecosystem
- UBE Industries Ltd
- Targray Industries Inc
- Mitsui Chemicals Inc
- NEI Corporation
- 3M Co
- Guangzhou Tinci Materials Technology Co Ltd
- Mitsubishi Chemical Holdings Corporation
- Shenzhen Capchem Technology Co Ltd
Key Developments in Electrolyte Battery Industry Industry
- February 2022: US Vanadium announced an expanded purchase agreement with Enerox for up to 3 Million additional liters/year of ultra-high-purity electrolyte. This signifies increased demand for vanadium redox flow batteries.
- January 2022: Nexeon Limited licensed its NSP-1 technology to SKC Co. Ltd., enhancing global access to advanced silicon anode materials for next-generation lithium-ion batteries.
Strategic Electrolyte Battery Industry Market Forecast
The Electrolyte Battery Industry is poised for significant growth, driven by technological advancements, increasing demand for electric vehicles and renewable energy storage, and supportive government policies. Future opportunities lie in the development and adoption of next-generation battery technologies, expansion into new markets, and continued innovation in materials science. The market is expected to experience robust growth, surpassing xx Million by 2033.
Electrolyte Battery Industry Segmentation
-
1. Battery Type and Electrolyte Type
-
1.1. Lead Acid
- 1.1.1. Liquid Electrolyte
- 1.1.2. Gel Electrolyte
-
1.2. Lithium-ion
- 1.2.1. Solid Electrolyte
-
1.3. Flow Battery
- 1.3.1. Vanadium
- 1.3.2. Zinc Bromide
- 1.4. Other Battery Types and Electrolyte Types
- 1.5. Liquid Electrolyte
-
1.1. Lead Acid
-
2. End User
- 2.1. Electric Vehicle
- 2.2. Energy Storage
- 2.3. Consumer Electronics
- 2.4. Other End Users
Electrolyte Battery Industry Segmentation By Geography
- 1. North America
- 2. Europe
- 3. Asia Pacific
- 4. South America
- 5. Middle East and Africa
Electrolyte Battery Industry REPORT HIGHLIGHTS
| Aspects | Details |
|---|---|
| Study Period | 2019-2033 |
| Base Year | 2024 |
| Estimated Year | 2025 |
| Forecast Period | 2025-2033 |
| Historical Period | 2019-2024 |
| Growth Rate | CAGR of 11.60% from 2019-2033 |
| Segmentation |
|
Table of Contents
- 1. Introduction
- 1.1. Research Scope
- 1.2. Market Segmentation
- 1.3. Research Methodology
- 1.4. Definitions and Assumptions
- 2. Executive Summary
- 2.1. Introduction
- 3. Market Dynamics
- 3.1. Introduction
- 3.2. Market Drivers
- 3.2.1. Increasing Energy Demand.; Increasing Export Opportunities
- 3.3. Market Restrains
- 3.3.1. Volatility in Energy Prices
- 3.4. Market Trends
- 3.4.1. Lithium-ion Battery Expected to Dominate the Market
- 4. Market Factor Analysis
- 4.1. Porters Five Forces
- 4.2. Supply/Value Chain
- 4.3. PESTEL analysis
- 4.4. Market Entropy
- 4.5. Patent/Trademark Analysis
- 5. Global Electrolyte Battery Industry Analysis, Insights and Forecast, 2019-2031
- 5.1. Market Analysis, Insights and Forecast - by Battery Type and Electrolyte Type
- 5.1.1. Lead Acid
- 5.1.1.1. Liquid Electrolyte
- 5.1.1.2. Gel Electrolyte
- 5.1.2. Lithium-ion
- 5.1.2.1. Solid Electrolyte
- 5.1.3. Flow Battery
- 5.1.3.1. Vanadium
- 5.1.3.2. Zinc Bromide
- 5.1.4. Other Battery Types and Electrolyte Types
- 5.1.5. Liquid Electrolyte
- 5.1.1. Lead Acid
- 5.2. Market Analysis, Insights and Forecast - by End User
- 5.2.1. Electric Vehicle
- 5.2.2. Energy Storage
- 5.2.3. Consumer Electronics
- 5.2.4. Other End Users
- 5.3. Market Analysis, Insights and Forecast - by Region
- 5.3.1. North America
- 5.3.2. Europe
- 5.3.3. Asia Pacific
- 5.3.4. South America
- 5.3.5. Middle East and Africa
- 5.1. Market Analysis, Insights and Forecast - by Battery Type and Electrolyte Type
- 6. North America Electrolyte Battery Industry Analysis, Insights and Forecast, 2019-2031
- 6.1. Market Analysis, Insights and Forecast - by Battery Type and Electrolyte Type
- 6.1.1. Lead Acid
- 6.1.1.1. Liquid Electrolyte
- 6.1.1.2. Gel Electrolyte
- 6.1.2. Lithium-ion
- 6.1.2.1. Solid Electrolyte
- 6.1.3. Flow Battery
- 6.1.3.1. Vanadium
- 6.1.3.2. Zinc Bromide
- 6.1.4. Other Battery Types and Electrolyte Types
- 6.1.5. Liquid Electrolyte
- 6.1.1. Lead Acid
- 6.2. Market Analysis, Insights and Forecast - by End User
- 6.2.1. Electric Vehicle
- 6.2.2. Energy Storage
- 6.2.3. Consumer Electronics
- 6.2.4. Other End Users
- 6.1. Market Analysis, Insights and Forecast - by Battery Type and Electrolyte Type
- 7. Europe Electrolyte Battery Industry Analysis, Insights and Forecast, 2019-2031
- 7.1. Market Analysis, Insights and Forecast - by Battery Type and Electrolyte Type
- 7.1.1. Lead Acid
- 7.1.1.1. Liquid Electrolyte
- 7.1.1.2. Gel Electrolyte
- 7.1.2. Lithium-ion
- 7.1.2.1. Solid Electrolyte
- 7.1.3. Flow Battery
- 7.1.3.1. Vanadium
- 7.1.3.2. Zinc Bromide
- 7.1.4. Other Battery Types and Electrolyte Types
- 7.1.5. Liquid Electrolyte
- 7.1.1. Lead Acid
- 7.2. Market Analysis, Insights and Forecast - by End User
- 7.2.1. Electric Vehicle
- 7.2.2. Energy Storage
- 7.2.3. Consumer Electronics
- 7.2.4. Other End Users
- 7.1. Market Analysis, Insights and Forecast - by Battery Type and Electrolyte Type
- 8. Asia Pacific Electrolyte Battery Industry Analysis, Insights and Forecast, 2019-2031
- 8.1. Market Analysis, Insights and Forecast - by Battery Type and Electrolyte Type
- 8.1.1. Lead Acid
- 8.1.1.1. Liquid Electrolyte
- 8.1.1.2. Gel Electrolyte
- 8.1.2. Lithium-ion
- 8.1.2.1. Solid Electrolyte
- 8.1.3. Flow Battery
- 8.1.3.1. Vanadium
- 8.1.3.2. Zinc Bromide
- 8.1.4. Other Battery Types and Electrolyte Types
- 8.1.5. Liquid Electrolyte
- 8.1.1. Lead Acid
- 8.2. Market Analysis, Insights and Forecast - by End User
- 8.2.1. Electric Vehicle
- 8.2.2. Energy Storage
- 8.2.3. Consumer Electronics
- 8.2.4. Other End Users
- 8.1. Market Analysis, Insights and Forecast - by Battery Type and Electrolyte Type
- 9. South America Electrolyte Battery Industry Analysis, Insights and Forecast, 2019-2031
- 9.1. Market Analysis, Insights and Forecast - by Battery Type and Electrolyte Type
- 9.1.1. Lead Acid
- 9.1.1.1. Liquid Electrolyte
- 9.1.1.2. Gel Electrolyte
- 9.1.2. Lithium-ion
- 9.1.2.1. Solid Electrolyte
- 9.1.3. Flow Battery
- 9.1.3.1. Vanadium
- 9.1.3.2. Zinc Bromide
- 9.1.4. Other Battery Types and Electrolyte Types
- 9.1.5. Liquid Electrolyte
- 9.1.1. Lead Acid
- 9.2. Market Analysis, Insights and Forecast - by End User
- 9.2.1. Electric Vehicle
- 9.2.2. Energy Storage
- 9.2.3. Consumer Electronics
- 9.2.4. Other End Users
- 9.1. Market Analysis, Insights and Forecast - by Battery Type and Electrolyte Type
- 10. Middle East and Africa Electrolyte Battery Industry Analysis, Insights and Forecast, 2019-2031
- 10.1. Market Analysis, Insights and Forecast - by Battery Type and Electrolyte Type
- 10.1.1. Lead Acid
- 10.1.1.1. Liquid Electrolyte
- 10.1.1.2. Gel Electrolyte
- 10.1.2. Lithium-ion
- 10.1.2.1. Solid Electrolyte
- 10.1.3. Flow Battery
- 10.1.3.1. Vanadium
- 10.1.3.2. Zinc Bromide
- 10.1.4. Other Battery Types and Electrolyte Types
- 10.1.5. Liquid Electrolyte
- 10.1.1. Lead Acid
- 10.2. Market Analysis, Insights and Forecast - by End User
- 10.2.1. Electric Vehicle
- 10.2.2. Energy Storage
- 10.2.3. Consumer Electronics
- 10.2.4. Other End Users
- 10.1. Market Analysis, Insights and Forecast - by Battery Type and Electrolyte Type
- 11. North America Electrolyte Battery Industry Analysis, Insights and Forecast, 2019-2031
- 11.1. Market Analysis, Insights and Forecast - By Country/Sub-region
- 11.1.1 United States
- 11.1.2 Canada
- 11.1.3 Mexico
- 12. Europe Electrolyte Battery Industry Analysis, Insights and Forecast, 2019-2031
- 12.1. Market Analysis, Insights and Forecast - By Country/Sub-region
- 12.1.1 Germany
- 12.1.2 United Kingdom
- 12.1.3 France
- 12.1.4 Spain
- 12.1.5 Italy
- 12.1.6 Spain
- 12.1.7 Belgium
- 12.1.8 Netherland
- 12.1.9 Nordics
- 12.1.10 Rest of Europe
- 13. Asia Pacific Electrolyte Battery Industry Analysis, Insights and Forecast, 2019-2031
- 13.1. Market Analysis, Insights and Forecast - By Country/Sub-region
- 13.1.1 China
- 13.1.2 Japan
- 13.1.3 India
- 13.1.4 South Korea
- 13.1.5 Southeast Asia
- 13.1.6 Australia
- 13.1.7 Indonesia
- 13.1.8 Phillipes
- 13.1.9 Singapore
- 13.1.10 Thailandc
- 13.1.11 Rest of Asia Pacific
- 14. South America Electrolyte Battery Industry Analysis, Insights and Forecast, 2019-2031
- 14.1. Market Analysis, Insights and Forecast - By Country/Sub-region
- 14.1.1 Brazil
- 14.1.2 Argentina
- 14.1.3 Peru
- 14.1.4 Chile
- 14.1.5 Colombia
- 14.1.6 Ecuador
- 14.1.7 Venezuela
- 14.1.8 Rest of South America
- 15. North America Electrolyte Battery Industry Analysis, Insights and Forecast, 2019-2031
- 15.1. Market Analysis, Insights and Forecast - By Country/Sub-region
- 15.1.1 United States
- 15.1.2 Canada
- 15.1.3 Mexico
- 16. MEA Electrolyte Battery Industry Analysis, Insights and Forecast, 2019-2031
- 16.1. Market Analysis, Insights and Forecast - By Country/Sub-region
- 16.1.1 United Arab Emirates
- 16.1.2 Saudi Arabia
- 16.1.3 South Africa
- 16.1.4 Rest of Middle East and Africa
- 17. Competitive Analysis
- 17.1. Global Market Share Analysis 2024
- 17.2. Company Profiles
- 17.2.1 UBE Industries Ltd
- 17.2.1.1. Overview
- 17.2.1.2. Products
- 17.2.1.3. SWOT Analysis
- 17.2.1.4. Recent Developments
- 17.2.1.5. Financials (Based on Availability)
- 17.2.2 Targray Industries Inc
- 17.2.2.1. Overview
- 17.2.2.2. Products
- 17.2.2.3. SWOT Analysis
- 17.2.2.4. Recent Developments
- 17.2.2.5. Financials (Based on Availability)
- 17.2.3 Mitsui Chemicals Inc
- 17.2.3.1. Overview
- 17.2.3.2. Products
- 17.2.3.3. SWOT Analysis
- 17.2.3.4. Recent Developments
- 17.2.3.5. Financials (Based on Availability)
- 17.2.4 NEI Corporation
- 17.2.4.1. Overview
- 17.2.4.2. Products
- 17.2.4.3. SWOT Analysis
- 17.2.4.4. Recent Developments
- 17.2.4.5. Financials (Based on Availability)
- 17.2.5 3M Co
- 17.2.5.1. Overview
- 17.2.5.2. Products
- 17.2.5.3. SWOT Analysis
- 17.2.5.4. Recent Developments
- 17.2.5.5. Financials (Based on Availability)
- 17.2.6 Guangzhou Tinci Materials Technology Co Ltd
- 17.2.6.1. Overview
- 17.2.6.2. Products
- 17.2.6.3. SWOT Analysis
- 17.2.6.4. Recent Developments
- 17.2.6.5. Financials (Based on Availability)
- 17.2.7 Mitsubishi Chemical Holdings Corporation
- 17.2.7.1. Overview
- 17.2.7.2. Products
- 17.2.7.3. SWOT Analysis
- 17.2.7.4. Recent Developments
- 17.2.7.5. Financials (Based on Availability)
- 17.2.8 Shenzhen Capchem Technology Co Ltd
- 17.2.8.1. Overview
- 17.2.8.2. Products
- 17.2.8.3. SWOT Analysis
- 17.2.8.4. Recent Developments
- 17.2.8.5. Financials (Based on Availability)
- 17.2.1 UBE Industries Ltd
List of Figures
- Figure 1: Global Electrolyte Battery Industry Revenue Breakdown (Million, %) by Region 2024 & 2032
- Figure 2: North America Electrolyte Battery Industry Revenue (Million), by Country 2024 & 2032
- Figure 3: North America Electrolyte Battery Industry Revenue Share (%), by Country 2024 & 2032
- Figure 4: Europe Electrolyte Battery Industry Revenue (Million), by Country 2024 & 2032
- Figure 5: Europe Electrolyte Battery Industry Revenue Share (%), by Country 2024 & 2032
- Figure 6: Asia Pacific Electrolyte Battery Industry Revenue (Million), by Country 2024 & 2032
- Figure 7: Asia Pacific Electrolyte Battery Industry Revenue Share (%), by Country 2024 & 2032
- Figure 8: South America Electrolyte Battery Industry Revenue (Million), by Country 2024 & 2032
- Figure 9: South America Electrolyte Battery Industry Revenue Share (%), by Country 2024 & 2032
- Figure 10: North America Electrolyte Battery Industry Revenue (Million), by Country 2024 & 2032
- Figure 11: North America Electrolyte Battery Industry Revenue Share (%), by Country 2024 & 2032
- Figure 12: MEA Electrolyte Battery Industry Revenue (Million), by Country 2024 & 2032
- Figure 13: MEA Electrolyte Battery Industry Revenue Share (%), by Country 2024 & 2032
- Figure 14: North America Electrolyte Battery Industry Revenue (Million), by Battery Type and Electrolyte Type 2024 & 2032
- Figure 15: North America Electrolyte Battery Industry Revenue Share (%), by Battery Type and Electrolyte Type 2024 & 2032
- Figure 16: North America Electrolyte Battery Industry Revenue (Million), by End User 2024 & 2032
- Figure 17: North America Electrolyte Battery Industry Revenue Share (%), by End User 2024 & 2032
- Figure 18: North America Electrolyte Battery Industry Revenue (Million), by Country 2024 & 2032
- Figure 19: North America Electrolyte Battery Industry Revenue Share (%), by Country 2024 & 2032
- Figure 20: Europe Electrolyte Battery Industry Revenue (Million), by Battery Type and Electrolyte Type 2024 & 2032
- Figure 21: Europe Electrolyte Battery Industry Revenue Share (%), by Battery Type and Electrolyte Type 2024 & 2032
- Figure 22: Europe Electrolyte Battery Industry Revenue (Million), by End User 2024 & 2032
- Figure 23: Europe Electrolyte Battery Industry Revenue Share (%), by End User 2024 & 2032
- Figure 24: Europe Electrolyte Battery Industry Revenue (Million), by Country 2024 & 2032
- Figure 25: Europe Electrolyte Battery Industry Revenue Share (%), by Country 2024 & 2032
- Figure 26: Asia Pacific Electrolyte Battery Industry Revenue (Million), by Battery Type and Electrolyte Type 2024 & 2032
- Figure 27: Asia Pacific Electrolyte Battery Industry Revenue Share (%), by Battery Type and Electrolyte Type 2024 & 2032
- Figure 28: Asia Pacific Electrolyte Battery Industry Revenue (Million), by End User 2024 & 2032
- Figure 29: Asia Pacific Electrolyte Battery Industry Revenue Share (%), by End User 2024 & 2032
- Figure 30: Asia Pacific Electrolyte Battery Industry Revenue (Million), by Country 2024 & 2032
- Figure 31: Asia Pacific Electrolyte Battery Industry Revenue Share (%), by Country 2024 & 2032
- Figure 32: South America Electrolyte Battery Industry Revenue (Million), by Battery Type and Electrolyte Type 2024 & 2032
- Figure 33: South America Electrolyte Battery Industry Revenue Share (%), by Battery Type and Electrolyte Type 2024 & 2032
- Figure 34: South America Electrolyte Battery Industry Revenue (Million), by End User 2024 & 2032
- Figure 35: South America Electrolyte Battery Industry Revenue Share (%), by End User 2024 & 2032
- Figure 36: South America Electrolyte Battery Industry Revenue (Million), by Country 2024 & 2032
- Figure 37: South America Electrolyte Battery Industry Revenue Share (%), by Country 2024 & 2032
- Figure 38: Middle East and Africa Electrolyte Battery Industry Revenue (Million), by Battery Type and Electrolyte Type 2024 & 2032
- Figure 39: Middle East and Africa Electrolyte Battery Industry Revenue Share (%), by Battery Type and Electrolyte Type 2024 & 2032
- Figure 40: Middle East and Africa Electrolyte Battery Industry Revenue (Million), by End User 2024 & 2032
- Figure 41: Middle East and Africa Electrolyte Battery Industry Revenue Share (%), by End User 2024 & 2032
- Figure 42: Middle East and Africa Electrolyte Battery Industry Revenue (Million), by Country 2024 & 2032
- Figure 43: Middle East and Africa Electrolyte Battery Industry Revenue Share (%), by Country 2024 & 2032
List of Tables
- Table 1: Global Electrolyte Battery Industry Revenue Million Forecast, by Region 2019 & 2032
- Table 2: Global Electrolyte Battery Industry Revenue Million Forecast, by Battery Type and Electrolyte Type 2019 & 2032
- Table 3: Global Electrolyte Battery Industry Revenue Million Forecast, by End User 2019 & 2032
- Table 4: Global Electrolyte Battery Industry Revenue Million Forecast, by Region 2019 & 2032
- Table 5: Global Electrolyte Battery Industry Revenue Million Forecast, by Country 2019 & 2032
- Table 6: United States Electrolyte Battery Industry Revenue (Million) Forecast, by Application 2019 & 2032
- Table 7: Canada Electrolyte Battery Industry Revenue (Million) Forecast, by Application 2019 & 2032
- Table 8: Mexico Electrolyte Battery Industry Revenue (Million) Forecast, by Application 2019 & 2032
- Table 9: Global Electrolyte Battery Industry Revenue Million Forecast, by Country 2019 & 2032
- Table 10: Germany Electrolyte Battery Industry Revenue (Million) Forecast, by Application 2019 & 2032
- Table 11: United Kingdom Electrolyte Battery Industry Revenue (Million) Forecast, by Application 2019 & 2032
- Table 12: France Electrolyte Battery Industry Revenue (Million) Forecast, by Application 2019 & 2032
- Table 13: Spain Electrolyte Battery Industry Revenue (Million) Forecast, by Application 2019 & 2032
- Table 14: Italy Electrolyte Battery Industry Revenue (Million) Forecast, by Application 2019 & 2032
- Table 15: Spain Electrolyte Battery Industry Revenue (Million) Forecast, by Application 2019 & 2032
- Table 16: Belgium Electrolyte Battery Industry Revenue (Million) Forecast, by Application 2019 & 2032
- Table 17: Netherland Electrolyte Battery Industry Revenue (Million) Forecast, by Application 2019 & 2032
- Table 18: Nordics Electrolyte Battery Industry Revenue (Million) Forecast, by Application 2019 & 2032
- Table 19: Rest of Europe Electrolyte Battery Industry Revenue (Million) Forecast, by Application 2019 & 2032
- Table 20: Global Electrolyte Battery Industry Revenue Million Forecast, by Country 2019 & 2032
- Table 21: China Electrolyte Battery Industry Revenue (Million) Forecast, by Application 2019 & 2032
- Table 22: Japan Electrolyte Battery Industry Revenue (Million) Forecast, by Application 2019 & 2032
- Table 23: India Electrolyte Battery Industry Revenue (Million) Forecast, by Application 2019 & 2032
- Table 24: South Korea Electrolyte Battery Industry Revenue (Million) Forecast, by Application 2019 & 2032
- Table 25: Southeast Asia Electrolyte Battery Industry Revenue (Million) Forecast, by Application 2019 & 2032
- Table 26: Australia Electrolyte Battery Industry Revenue (Million) Forecast, by Application 2019 & 2032
- Table 27: Indonesia Electrolyte Battery Industry Revenue (Million) Forecast, by Application 2019 & 2032
- Table 28: Phillipes Electrolyte Battery Industry Revenue (Million) Forecast, by Application 2019 & 2032
- Table 29: Singapore Electrolyte Battery Industry Revenue (Million) Forecast, by Application 2019 & 2032
- Table 30: Thailandc Electrolyte Battery Industry Revenue (Million) Forecast, by Application 2019 & 2032
- Table 31: Rest of Asia Pacific Electrolyte Battery Industry Revenue (Million) Forecast, by Application 2019 & 2032
- Table 32: Global Electrolyte Battery Industry Revenue Million Forecast, by Country 2019 & 2032
- Table 33: Brazil Electrolyte Battery Industry Revenue (Million) Forecast, by Application 2019 & 2032
- Table 34: Argentina Electrolyte Battery Industry Revenue (Million) Forecast, by Application 2019 & 2032
- Table 35: Peru Electrolyte Battery Industry Revenue (Million) Forecast, by Application 2019 & 2032
- Table 36: Chile Electrolyte Battery Industry Revenue (Million) Forecast, by Application 2019 & 2032
- Table 37: Colombia Electrolyte Battery Industry Revenue (Million) Forecast, by Application 2019 & 2032
- Table 38: Ecuador Electrolyte Battery Industry Revenue (Million) Forecast, by Application 2019 & 2032
- Table 39: Venezuela Electrolyte Battery Industry Revenue (Million) Forecast, by Application 2019 & 2032
- Table 40: Rest of South America Electrolyte Battery Industry Revenue (Million) Forecast, by Application 2019 & 2032
- Table 41: Global Electrolyte Battery Industry Revenue Million Forecast, by Country 2019 & 2032
- Table 42: United States Electrolyte Battery Industry Revenue (Million) Forecast, by Application 2019 & 2032
- Table 43: Canada Electrolyte Battery Industry Revenue (Million) Forecast, by Application 2019 & 2032
- Table 44: Mexico Electrolyte Battery Industry Revenue (Million) Forecast, by Application 2019 & 2032
- Table 45: Global Electrolyte Battery Industry Revenue Million Forecast, by Country 2019 & 2032
- Table 46: United Arab Emirates Electrolyte Battery Industry Revenue (Million) Forecast, by Application 2019 & 2032
- Table 47: Saudi Arabia Electrolyte Battery Industry Revenue (Million) Forecast, by Application 2019 & 2032
- Table 48: South Africa Electrolyte Battery Industry Revenue (Million) Forecast, by Application 2019 & 2032
- Table 49: Rest of Middle East and Africa Electrolyte Battery Industry Revenue (Million) Forecast, by Application 2019 & 2032
- Table 50: Global Electrolyte Battery Industry Revenue Million Forecast, by Battery Type and Electrolyte Type 2019 & 2032
- Table 51: Global Electrolyte Battery Industry Revenue Million Forecast, by End User 2019 & 2032
- Table 52: Global Electrolyte Battery Industry Revenue Million Forecast, by Country 2019 & 2032
- Table 53: Global Electrolyte Battery Industry Revenue Million Forecast, by Battery Type and Electrolyte Type 2019 & 2032
- Table 54: Global Electrolyte Battery Industry Revenue Million Forecast, by End User 2019 & 2032
- Table 55: Global Electrolyte Battery Industry Revenue Million Forecast, by Country 2019 & 2032
- Table 56: Global Electrolyte Battery Industry Revenue Million Forecast, by Battery Type and Electrolyte Type 2019 & 2032
- Table 57: Global Electrolyte Battery Industry Revenue Million Forecast, by End User 2019 & 2032
- Table 58: Global Electrolyte Battery Industry Revenue Million Forecast, by Country 2019 & 2032
- Table 59: Global Electrolyte Battery Industry Revenue Million Forecast, by Battery Type and Electrolyte Type 2019 & 2032
- Table 60: Global Electrolyte Battery Industry Revenue Million Forecast, by End User 2019 & 2032
- Table 61: Global Electrolyte Battery Industry Revenue Million Forecast, by Country 2019 & 2032
- Table 62: Global Electrolyte Battery Industry Revenue Million Forecast, by Battery Type and Electrolyte Type 2019 & 2032
- Table 63: Global Electrolyte Battery Industry Revenue Million Forecast, by End User 2019 & 2032
- Table 64: Global Electrolyte Battery Industry Revenue Million Forecast, by Country 2019 & 2032
Frequently Asked Questions
1. What is the projected Compound Annual Growth Rate (CAGR) of the Electrolyte Battery Industry?
The projected CAGR is approximately 11.60%.
2. Which companies are prominent players in the Electrolyte Battery Industry?
Key companies in the market include UBE Industries Ltd, Targray Industries Inc, Mitsui Chemicals Inc, NEI Corporation, 3M Co, Guangzhou Tinci Materials Technology Co Ltd, Mitsubishi Chemical Holdings Corporation, Shenzhen Capchem Technology Co Ltd.
3. What are the main segments of the Electrolyte Battery Industry?
The market segments include Battery Type and Electrolyte Type, End User.
4. Can you provide details about the market size?
The market size is estimated to be USD XX Million as of 2022.
5. What are some drivers contributing to market growth?
Increasing Energy Demand.; Increasing Export Opportunities.
6. What are the notable trends driving market growth?
Lithium-ion Battery Expected to Dominate the Market.
7. Are there any restraints impacting market growth?
Volatility in Energy Prices.
8. Can you provide examples of recent developments in the market?
In February 2022, US Vanadium announced an expanded purchase agreement under which Austrian-based Enerox, which sells vanadium redox flow battery (VRFB) systems under its brand name CellCube, can purchase up to 3 million additional liters/year of US Vanadium's ultra-high-purity electrolyte with a price cap over the next five years. The agreement boosts the initial purchase agreement for 580,000 liters/year of US Vanadium electrolyte, announced in September 2021.
9. What pricing options are available for accessing the report?
Pricing options include single-user, multi-user, and enterprise licenses priced at USD 4750, USD 5250, and USD 8750 respectively.
10. Is the market size provided in terms of value or volume?
The market size is provided in terms of value, measured in Million.
11. Are there any specific market keywords associated with the report?
Yes, the market keyword associated with the report is "Electrolyte Battery Industry," which aids in identifying and referencing the specific market segment covered.
12. How do I determine which pricing option suits my needs best?
The pricing options vary based on user requirements and access needs. Individual users may opt for single-user licenses, while businesses requiring broader access may choose multi-user or enterprise licenses for cost-effective access to the report.
13. Are there any additional resources or data provided in the Electrolyte Battery Industry report?
While the report offers comprehensive insights, it's advisable to review the specific contents or supplementary materials provided to ascertain if additional resources or data are available.
14. How can I stay updated on further developments or reports in the Electrolyte Battery Industry?
To stay informed about further developments, trends, and reports in the Electrolyte Battery Industry, consider subscribing to industry newsletters, following relevant companies and organizations, or regularly checking reputable industry news sources and publications.
Methodology
Step 1 - Identification of Relevant Samples Size from Population Database


Step 2 - Approaches for Defining Global Market Size (Value, Volume* & Price*)

Note*: In applicable scenarios
Step 3 - Data Sources
Primary Research
- Web Analytics
- Survey Reports
- Research Institute
- Latest Research Reports
- Opinion Leaders
Secondary Research
- Annual Reports
- White Paper
- Latest Press Release
- Industry Association
- Paid Database
- Investor Presentations

Step 4 - Data Triangulation
Involves using different sources of information in order to increase the validity of a study
These sources are likely to be stakeholders in a program - participants, other researchers, program staff, other community members, and so on.
Then we put all data in single framework & apply various statistical tools to find out the dynamic on the market.
During the analysis stage, feedback from the stakeholder groups would be compared to determine areas of agreement as well as areas of divergence
