

Key Insights
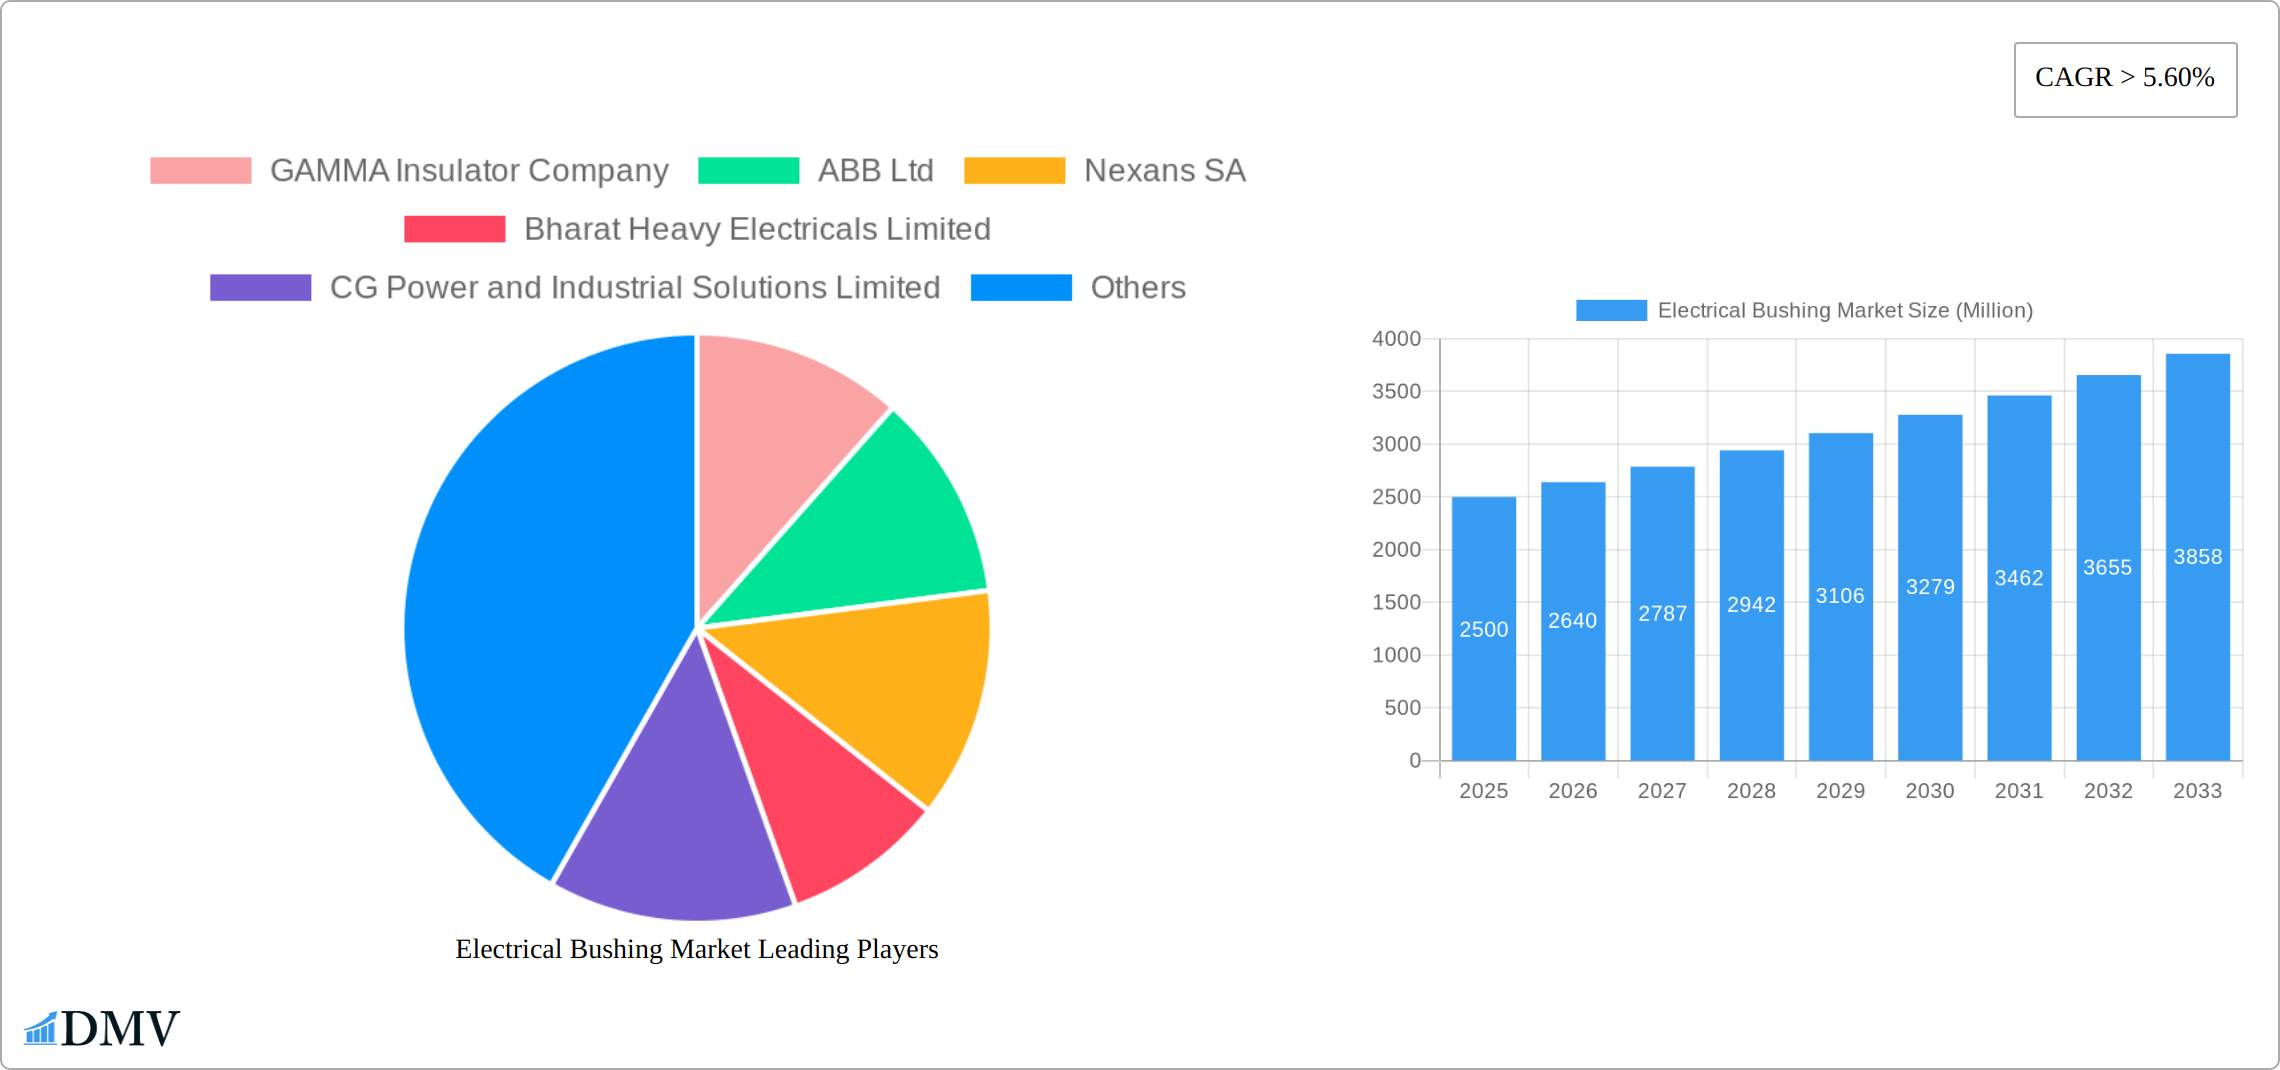
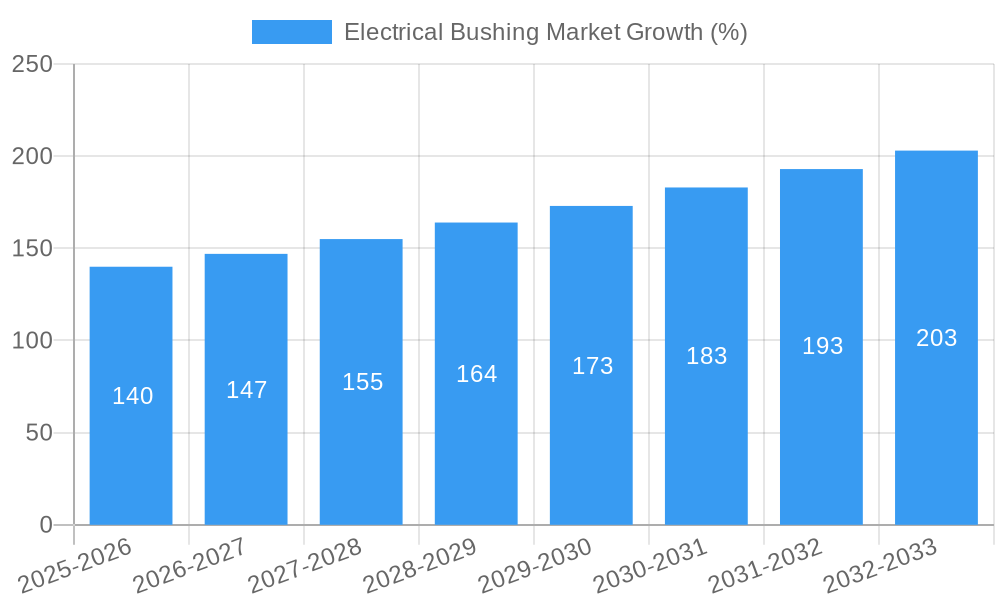
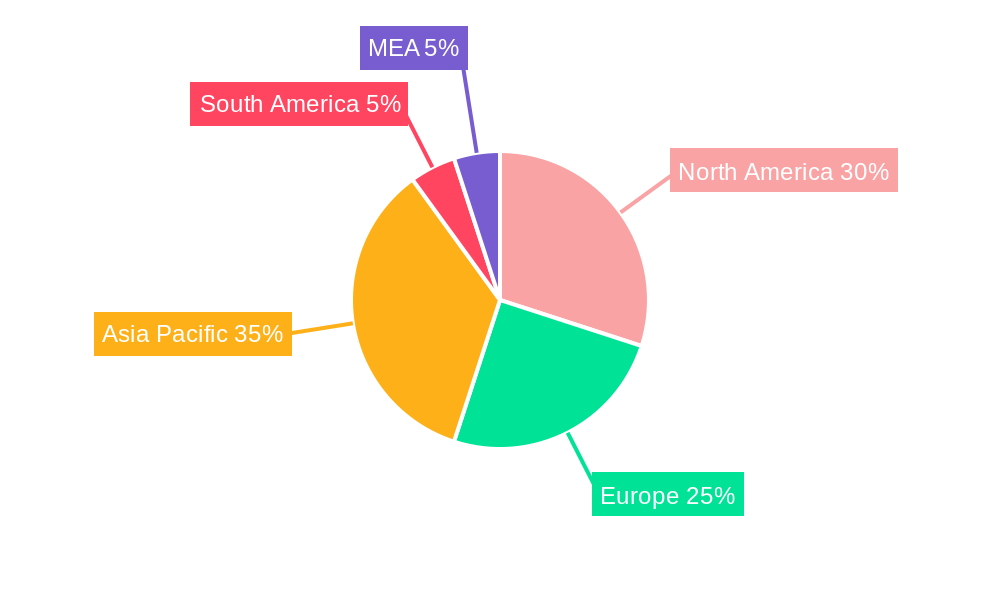
The global electrical bushing market is experiencing robust growth, projected to maintain a Compound Annual Growth Rate (CAGR) exceeding 5.60% from 2025 to 2033. This expansion is driven by the increasing demand for reliable electrical insulation in power transmission and distribution infrastructure, particularly within the burgeoning renewable energy sector and the modernization of existing grids. The rising adoption of smart grids and the growth of industrial automation are further contributing factors. Market segmentation reveals significant demand for oil-impregnated paper bushings due to their established reliability and cost-effectiveness in traditional transformer applications. However, resin-impregnated paper bushings are gaining traction due to their superior performance characteristics and suitability for higher voltage applications. Geographically, North America and Europe currently hold substantial market shares, driven by mature infrastructure and stringent safety regulations. However, the Asia-Pacific region is poised for significant growth, fueled by rapid industrialization and expanding power generation capacity, particularly in countries like China and India. Key players like ABB, Siemens, and Eaton are strategically investing in research and development to enhance bushing technologies, focusing on improved insulation materials and miniaturization for space-constrained applications. Competitive landscape analysis suggests a mix of established multinational corporations and regional players vying for market dominance through technological innovation and strategic partnerships.
The market restraints primarily stem from the high initial investment costs associated with installing high-quality bushings and the complex manufacturing processes involved. Stringent regulatory standards regarding electrical safety further impact market dynamics. Nevertheless, the long-term growth outlook remains positive, driven by the unwavering need for reliable power transmission and distribution worldwide. The increasing focus on grid stability and enhanced energy efficiency will continue to stimulate market demand throughout the forecast period. The integration of advanced monitoring systems and predictive maintenance technologies within power infrastructure represents a significant opportunity for the electrical bushing market in the coming years.
Electrical Bushing Market: A Comprehensive Report (2019-2033)
This insightful report provides a comprehensive analysis of the global Electrical Bushing Market, offering a detailed examination of market trends, key players, and future growth prospects. The study period spans from 2019 to 2033, with 2025 serving as the base and estimated year. The forecast period covers 2025-2033, and the historical period encompasses 2019-2024. This report is crucial for stakeholders seeking to understand the dynamics of this vital sector, valued at xx Million in 2025 and projected to reach xx Million by 2033.
Electrical Bushing Market Composition & Trends
This section delves into the competitive landscape of the electrical bushing market, analyzing market concentration, innovation drivers, regulatory frameworks, substitute products, end-user profiles, and mergers and acquisitions (M&A) activities. The report provides a granular view of market share distribution amongst key players such as GAMMA Insulator Company, ABB Ltd, Nexans SA, Bharat Heavy Electricals Limited, CG Power and Industrial Solutions Limited, Siemens AG, Eaton Corporation PLC, General Electric Company, and others. We examine the impact of recent M&A activities, estimating the total value of deals closed during the study period at approximately xx Million.
- Market Concentration: Analysis of market share held by top 5 players.
- Innovation Catalysts: Exploration of R&D investments and technological advancements driving market growth.
- Regulatory Landscape: Assessment of the impact of international and regional regulations on market dynamics.
- Substitute Products: Evaluation of alternative technologies and their potential impact on market share.
- End-User Profiles: Detailed analysis of the key end-use sectors (Transformers, Switchgears, etc.) and their respective demand patterns.
- M&A Activities: Comprehensive overview of significant mergers and acquisitions, including deal values and strategic implications.
Electrical Bushing Market Industry Evolution
From 2019 to 2024, the electrical bushing market experienced significant growth, driven by technological advancements, evolving consumer preferences, and the increasing demand for robust power transmission and distribution infrastructure. This period witnessed a notable Compound Annual Growth Rate (CAGR) across various segments, fueled by the adoption of innovative technologies such as improved insulation materials and digitally enhanced monitoring systems. The expanding need for higher voltage transmission systems, particularly in developing economies undergoing rapid industrialization, significantly propelled market expansion. The integration of smart grids, demanding sophisticated and reliable bushings for efficient energy management, further stimulated growth. This section delves into a detailed analysis of these trends, their impact on market segmentation, and their influence on the competitive landscape, providing a comprehensive overview of the market's dynamic evolution.
Leading Regions, Countries, or Segments in Electrical Bushing Market
This section pinpoints the key regions, countries, and segments dominating the electrical bushing market, focusing on the leading applications (Transformers, Switchgears, and Other Applications) and types (Oil Impregnated Paper, Resin Impregnated Paper, and Other Types). The analysis provides a granular view of market share distribution and identifies the factors contributing to the success of each segment.
- Dominant Region: A detailed examination of the factors contributing to the leading region's dominance, including but not limited to robust industrial growth, significant investments in infrastructure development, and favorable government policies supporting the energy sector.
- Key Drivers (Oil Impregnated Paper Bushings):
- Sustained growth in the transformer manufacturing sector, particularly in [Region/Country], driven by increased energy demands.
- Government initiatives promoting grid modernization and expansion, creating a strong demand for cost-effective solutions.
- Cost-competitiveness compared to alternative bushing types, making it a preferred choice for various applications.
- Key Drivers (Resin Impregnated Paper Bushings):
- Growing preference for high-performance bushings that offer enhanced reliability and longer lifespans, reducing maintenance costs.
- Technological breakthroughs resulting in improved dielectric strength, thermal stability, and environmental friendliness.
- Increasing adoption in high-voltage applications requiring superior insulation properties and resistance to harsh operating conditions.
- Key Drivers (Transformers):
- Expansion of power grids in developing and developed economies, driven by increasing energy consumption across all sectors.
- Surge in electricity demand from industrial and commercial sectors, necessitating enhanced power transmission capabilities.
- Significant investments in renewable energy infrastructure, demanding reliable and efficient power transfer components.
- In-depth Analysis: A comprehensive discussion exploring the diverse factors driving the success of specific regions, countries, and market segments, providing a nuanced understanding of market dynamics.
Electrical Bushing Market Product Innovations
This section highlights recent product innovations and technological advancements in the electrical bushing market. The focus will be on features that enhance performance, reliability, and efficiency. We'll detail the unique selling propositions (USPs) of new products and explore the impact of these innovations on market competition and consumer adoption. For example, the development of xx technology has improved xx by xx%, leading to increased market demand.
Propelling Factors for Electrical Bushing Market Growth
Several factors fuel the growth of the electrical bushing market. Technological advancements, such as improved insulation materials and enhanced designs, are key drivers. Economic growth, particularly in developing nations, is significantly increasing energy consumption and infrastructure development, boosting demand for electrical bushings. Furthermore, favorable government regulations and policies promoting renewable energy and grid modernization contribute to market expansion.
Obstacles in the Electrical Bushing Market
The electrical bushing market faces several challenges that impact its growth trajectory. Stringent environmental regulations necessitate the adoption of eco-friendly materials and manufacturing processes, increasing production costs and potentially lengthening lead times. Global supply chain disruptions, especially concerning raw material sourcing, can lead to production delays and price volatility. Furthermore, intense competition among established players and emerging market entrants puts pressure on profit margins, requiring continuous innovation and cost optimization strategies.
Future Opportunities in Electrical Bushing Market
The electrical bushing market holds promising future opportunities. Emerging economies, expanding power grids, and the growing adoption of smart grids are expected to drive significant demand. Technological advancements, such as the development of advanced materials and improved designs, will offer opportunities for innovation and market expansion. New markets and applications in renewable energy, electric vehicles, and other emerging sectors further add to the positive outlook.
Major Players in the Electrical Bushing Market Ecosystem
- ABB Ltd
- Nexans SA
- Bharat Heavy Electricals Limited
- CG Power and Industrial Solutions Limited
- Siemens AG
- Eaton Corporation PLC
- GAMMA Insulator Company
- General Electric Company
Key Developments in Electrical Bushing Market Industry
- [Month, Year]: [Company Name] launched a new line of high-voltage bushings featuring improved insulation and increased efficiency. This development is expected to enhance market competition.
- [Month, Year]: ABB Ltd and [Partner Company] announced a strategic partnership to develop next-generation electrical bushings for renewable energy applications.
- [Month, Year]: New regulations regarding environmental compliance were introduced in [Region/Country], impacting the manufacturing processes of electrical bushings.
Strategic Electrical Bushing Market Forecast
The electrical bushing market is poised for robust growth driven by increasing demand for reliable and efficient power transmission and distribution systems. Expansion into new markets, technological advancements, and favorable regulatory landscapes are expected to be key drivers. Opportunities in renewable energy and emerging applications will further propel market expansion, leading to substantial growth over the forecast period.
Electrical Bushing Market Segmentation
-
1. Type
- 1.1. Oil Impregnated Paper
- 1.2. Resin Impregnated Paper
- 1.3. Other Types
-
2. Application
- 2.1. Transformers
- 2.2. Switchgears
- 2.3. Other Applications
Electrical Bushing Market Segmentation By Geography
- 1. North America
- 2. Europe
- 3. Asia Pacific
- 4. South America
- 5. Middle East and Africa
Electrical Bushing Market REPORT HIGHLIGHTS
| Aspects | Details |
|---|---|
| Study Period | 2019-2033 |
| Base Year | 2024 |
| Estimated Year | 2025 |
| Forecast Period | 2025-2033 |
| Historical Period | 2019-2024 |
| Growth Rate | CAGR of > 5.60% from 2019-2033 |
| Segmentation |
|
Table of Contents
- 1. Introduction
- 1.1. Research Scope
- 1.2. Market Segmentation
- 1.3. Research Methodology
- 1.4. Definitions and Assumptions
- 2. Executive Summary
- 2.1. Introduction
- 3. Market Dynamics
- 3.1. Introduction
- 3.2. Market Drivers
- 3.2.1. Replacement of Existing Grids and the Expansion of Distribution Networks
- 3.3. Market Restrains
- 3.3.1. High Installation Costs
- 3.4. Market Trends
- 3.4.1. Transformer Application to Dominate the Market
- 4. Market Factor Analysis
- 4.1. Porters Five Forces
- 4.2. Supply/Value Chain
- 4.3. PESTEL analysis
- 4.4. Market Entropy
- 4.5. Patent/Trademark Analysis
- 5. Global Electrical Bushing Market Analysis, Insights and Forecast, 2019-2031
- 5.1. Market Analysis, Insights and Forecast - by Type
- 5.1.1. Oil Impregnated Paper
- 5.1.2. Resin Impregnated Paper
- 5.1.3. Other Types
- 5.2. Market Analysis, Insights and Forecast - by Application
- 5.2.1. Transformers
- 5.2.2. Switchgears
- 5.2.3. Other Applications
- 5.3. Market Analysis, Insights and Forecast - by Region
- 5.3.1. North America
- 5.3.2. Europe
- 5.3.3. Asia Pacific
- 5.3.4. South America
- 5.3.5. Middle East and Africa
- 5.1. Market Analysis, Insights and Forecast - by Type
- 6. North America Electrical Bushing Market Analysis, Insights and Forecast, 2019-2031
- 6.1. Market Analysis, Insights and Forecast - by Type
- 6.1.1. Oil Impregnated Paper
- 6.1.2. Resin Impregnated Paper
- 6.1.3. Other Types
- 6.2. Market Analysis, Insights and Forecast - by Application
- 6.2.1. Transformers
- 6.2.2. Switchgears
- 6.2.3. Other Applications
- 6.1. Market Analysis, Insights and Forecast - by Type
- 7. Europe Electrical Bushing Market Analysis, Insights and Forecast, 2019-2031
- 7.1. Market Analysis, Insights and Forecast - by Type
- 7.1.1. Oil Impregnated Paper
- 7.1.2. Resin Impregnated Paper
- 7.1.3. Other Types
- 7.2. Market Analysis, Insights and Forecast - by Application
- 7.2.1. Transformers
- 7.2.2. Switchgears
- 7.2.3. Other Applications
- 7.1. Market Analysis, Insights and Forecast - by Type
- 8. Asia Pacific Electrical Bushing Market Analysis, Insights and Forecast, 2019-2031
- 8.1. Market Analysis, Insights and Forecast - by Type
- 8.1.1. Oil Impregnated Paper
- 8.1.2. Resin Impregnated Paper
- 8.1.3. Other Types
- 8.2. Market Analysis, Insights and Forecast - by Application
- 8.2.1. Transformers
- 8.2.2. Switchgears
- 8.2.3. Other Applications
- 8.1. Market Analysis, Insights and Forecast - by Type
- 9. South America Electrical Bushing Market Analysis, Insights and Forecast, 2019-2031
- 9.1. Market Analysis, Insights and Forecast - by Type
- 9.1.1. Oil Impregnated Paper
- 9.1.2. Resin Impregnated Paper
- 9.1.3. Other Types
- 9.2. Market Analysis, Insights and Forecast - by Application
- 9.2.1. Transformers
- 9.2.2. Switchgears
- 9.2.3. Other Applications
- 9.1. Market Analysis, Insights and Forecast - by Type
- 10. Middle East and Africa Electrical Bushing Market Analysis, Insights and Forecast, 2019-2031
- 10.1. Market Analysis, Insights and Forecast - by Type
- 10.1.1. Oil Impregnated Paper
- 10.1.2. Resin Impregnated Paper
- 10.1.3. Other Types
- 10.2. Market Analysis, Insights and Forecast - by Application
- 10.2.1. Transformers
- 10.2.2. Switchgears
- 10.2.3. Other Applications
- 10.1. Market Analysis, Insights and Forecast - by Type
- 11. North America Electrical Bushing Market Analysis, Insights and Forecast, 2019-2031
- 11.1. Market Analysis, Insights and Forecast - By Country/Sub-region
- 11.1.1 United States
- 11.1.2 Canada
- 11.1.3 Mexico
- 12. Europe Electrical Bushing Market Analysis, Insights and Forecast, 2019-2031
- 12.1. Market Analysis, Insights and Forecast - By Country/Sub-region
- 12.1.1 Germany
- 12.1.2 United Kingdom
- 12.1.3 France
- 12.1.4 Spain
- 12.1.5 Italy
- 12.1.6 Spain
- 12.1.7 Belgium
- 12.1.8 Netherland
- 12.1.9 Nordics
- 12.1.10 Rest of Europe
- 13. Asia Pacific Electrical Bushing Market Analysis, Insights and Forecast, 2019-2031
- 13.1. Market Analysis, Insights and Forecast - By Country/Sub-region
- 13.1.1 China
- 13.1.2 Japan
- 13.1.3 India
- 13.1.4 South Korea
- 13.1.5 Southeast Asia
- 13.1.6 Australia
- 13.1.7 Indonesia
- 13.1.8 Phillipes
- 13.1.9 Singapore
- 13.1.10 Thailandc
- 13.1.11 Rest of Asia Pacific
- 14. South America Electrical Bushing Market Analysis, Insights and Forecast, 2019-2031
- 14.1. Market Analysis, Insights and Forecast - By Country/Sub-region
- 14.1.1 Brazil
- 14.1.2 Argentina
- 14.1.3 Peru
- 14.1.4 Chile
- 14.1.5 Colombia
- 14.1.6 Ecuador
- 14.1.7 Venezuela
- 14.1.8 Rest of South America
- 15. MEA Electrical Bushing Market Analysis, Insights and Forecast, 2019-2031
- 15.1. Market Analysis, Insights and Forecast - By Country/Sub-region
- 15.1.1 United Arab Emirates
- 15.1.2 Saudi Arabia
- 15.1.3 South Africa
- 15.1.4 Rest of Middle East and Africa
- 16. Competitive Analysis
- 16.1. Global Market Share Analysis 2024
- 16.2. Company Profiles
- 16.2.1 GAMMA Insulator Company
- 16.2.1.1. Overview
- 16.2.1.2. Products
- 16.2.1.3. SWOT Analysis
- 16.2.1.4. Recent Developments
- 16.2.1.5. Financials (Based on Availability)
- 16.2.2 ABB Ltd
- 16.2.2.1. Overview
- 16.2.2.2. Products
- 16.2.2.3. SWOT Analysis
- 16.2.2.4. Recent Developments
- 16.2.2.5. Financials (Based on Availability)
- 16.2.3 Nexans SA
- 16.2.3.1. Overview
- 16.2.3.2. Products
- 16.2.3.3. SWOT Analysis
- 16.2.3.4. Recent Developments
- 16.2.3.5. Financials (Based on Availability)
- 16.2.4 Bharat Heavy Electricals Limited
- 16.2.4.1. Overview
- 16.2.4.2. Products
- 16.2.4.3. SWOT Analysis
- 16.2.4.4. Recent Developments
- 16.2.4.5. Financials (Based on Availability)
- 16.2.5 CG Power and Industrial Solutions Limited
- 16.2.5.1. Overview
- 16.2.5.2. Products
- 16.2.5.3. SWOT Analysis
- 16.2.5.4. Recent Developments
- 16.2.5.5. Financials (Based on Availability)
- 16.2.6 Siemens AG
- 16.2.6.1. Overview
- 16.2.6.2. Products
- 16.2.6.3. SWOT Analysis
- 16.2.6.4. Recent Developments
- 16.2.6.5. Financials (Based on Availability)
- 16.2.7 Eaton Corporation PLC
- 16.2.7.1. Overview
- 16.2.7.2. Products
- 16.2.7.3. SWOT Analysis
- 16.2.7.4. Recent Developments
- 16.2.7.5. Financials (Based on Availability)
- 16.2.8 Nexans SA*List Not Exhaustive
- 16.2.8.1. Overview
- 16.2.8.2. Products
- 16.2.8.3. SWOT Analysis
- 16.2.8.4. Recent Developments
- 16.2.8.5. Financials (Based on Availability)
- 16.2.9 General Electric Company
- 16.2.9.1. Overview
- 16.2.9.2. Products
- 16.2.9.3. SWOT Analysis
- 16.2.9.4. Recent Developments
- 16.2.9.5. Financials (Based on Availability)
- 16.2.1 GAMMA Insulator Company
List of Figures
- Figure 1: Global Electrical Bushing Market Revenue Breakdown (Million, %) by Region 2024 & 2032
- Figure 2: Global Electrical Bushing Market Volume Breakdown (K Unit, %) by Region 2024 & 2032
- Figure 3: North America Electrical Bushing Market Revenue (Million), by Country 2024 & 2032
- Figure 4: North America Electrical Bushing Market Volume (K Unit), by Country 2024 & 2032
- Figure 5: North America Electrical Bushing Market Revenue Share (%), by Country 2024 & 2032
- Figure 6: North America Electrical Bushing Market Volume Share (%), by Country 2024 & 2032
- Figure 7: Europe Electrical Bushing Market Revenue (Million), by Country 2024 & 2032
- Figure 8: Europe Electrical Bushing Market Volume (K Unit), by Country 2024 & 2032
- Figure 9: Europe Electrical Bushing Market Revenue Share (%), by Country 2024 & 2032
- Figure 10: Europe Electrical Bushing Market Volume Share (%), by Country 2024 & 2032
- Figure 11: Asia Pacific Electrical Bushing Market Revenue (Million), by Country 2024 & 2032
- Figure 12: Asia Pacific Electrical Bushing Market Volume (K Unit), by Country 2024 & 2032
- Figure 13: Asia Pacific Electrical Bushing Market Revenue Share (%), by Country 2024 & 2032
- Figure 14: Asia Pacific Electrical Bushing Market Volume Share (%), by Country 2024 & 2032
- Figure 15: South America Electrical Bushing Market Revenue (Million), by Country 2024 & 2032
- Figure 16: South America Electrical Bushing Market Volume (K Unit), by Country 2024 & 2032
- Figure 17: South America Electrical Bushing Market Revenue Share (%), by Country 2024 & 2032
- Figure 18: South America Electrical Bushing Market Volume Share (%), by Country 2024 & 2032
- Figure 19: MEA Electrical Bushing Market Revenue (Million), by Country 2024 & 2032
- Figure 20: MEA Electrical Bushing Market Volume (K Unit), by Country 2024 & 2032
- Figure 21: MEA Electrical Bushing Market Revenue Share (%), by Country 2024 & 2032
- Figure 22: MEA Electrical Bushing Market Volume Share (%), by Country 2024 & 2032
- Figure 23: North America Electrical Bushing Market Revenue (Million), by Type 2024 & 2032
- Figure 24: North America Electrical Bushing Market Volume (K Unit), by Type 2024 & 2032
- Figure 25: North America Electrical Bushing Market Revenue Share (%), by Type 2024 & 2032
- Figure 26: North America Electrical Bushing Market Volume Share (%), by Type 2024 & 2032
- Figure 27: North America Electrical Bushing Market Revenue (Million), by Application 2024 & 2032
- Figure 28: North America Electrical Bushing Market Volume (K Unit), by Application 2024 & 2032
- Figure 29: North America Electrical Bushing Market Revenue Share (%), by Application 2024 & 2032
- Figure 30: North America Electrical Bushing Market Volume Share (%), by Application 2024 & 2032
- Figure 31: North America Electrical Bushing Market Revenue (Million), by Country 2024 & 2032
- Figure 32: North America Electrical Bushing Market Volume (K Unit), by Country 2024 & 2032
- Figure 33: North America Electrical Bushing Market Revenue Share (%), by Country 2024 & 2032
- Figure 34: North America Electrical Bushing Market Volume Share (%), by Country 2024 & 2032
- Figure 35: Europe Electrical Bushing Market Revenue (Million), by Type 2024 & 2032
- Figure 36: Europe Electrical Bushing Market Volume (K Unit), by Type 2024 & 2032
- Figure 37: Europe Electrical Bushing Market Revenue Share (%), by Type 2024 & 2032
- Figure 38: Europe Electrical Bushing Market Volume Share (%), by Type 2024 & 2032
- Figure 39: Europe Electrical Bushing Market Revenue (Million), by Application 2024 & 2032
- Figure 40: Europe Electrical Bushing Market Volume (K Unit), by Application 2024 & 2032
- Figure 41: Europe Electrical Bushing Market Revenue Share (%), by Application 2024 & 2032
- Figure 42: Europe Electrical Bushing Market Volume Share (%), by Application 2024 & 2032
- Figure 43: Europe Electrical Bushing Market Revenue (Million), by Country 2024 & 2032
- Figure 44: Europe Electrical Bushing Market Volume (K Unit), by Country 2024 & 2032
- Figure 45: Europe Electrical Bushing Market Revenue Share (%), by Country 2024 & 2032
- Figure 46: Europe Electrical Bushing Market Volume Share (%), by Country 2024 & 2032
- Figure 47: Asia Pacific Electrical Bushing Market Revenue (Million), by Type 2024 & 2032
- Figure 48: Asia Pacific Electrical Bushing Market Volume (K Unit), by Type 2024 & 2032
- Figure 49: Asia Pacific Electrical Bushing Market Revenue Share (%), by Type 2024 & 2032
- Figure 50: Asia Pacific Electrical Bushing Market Volume Share (%), by Type 2024 & 2032
- Figure 51: Asia Pacific Electrical Bushing Market Revenue (Million), by Application 2024 & 2032
- Figure 52: Asia Pacific Electrical Bushing Market Volume (K Unit), by Application 2024 & 2032
- Figure 53: Asia Pacific Electrical Bushing Market Revenue Share (%), by Application 2024 & 2032
- Figure 54: Asia Pacific Electrical Bushing Market Volume Share (%), by Application 2024 & 2032
- Figure 55: Asia Pacific Electrical Bushing Market Revenue (Million), by Country 2024 & 2032
- Figure 56: Asia Pacific Electrical Bushing Market Volume (K Unit), by Country 2024 & 2032
- Figure 57: Asia Pacific Electrical Bushing Market Revenue Share (%), by Country 2024 & 2032
- Figure 58: Asia Pacific Electrical Bushing Market Volume Share (%), by Country 2024 & 2032
- Figure 59: South America Electrical Bushing Market Revenue (Million), by Type 2024 & 2032
- Figure 60: South America Electrical Bushing Market Volume (K Unit), by Type 2024 & 2032
- Figure 61: South America Electrical Bushing Market Revenue Share (%), by Type 2024 & 2032
- Figure 62: South America Electrical Bushing Market Volume Share (%), by Type 2024 & 2032
- Figure 63: South America Electrical Bushing Market Revenue (Million), by Application 2024 & 2032
- Figure 64: South America Electrical Bushing Market Volume (K Unit), by Application 2024 & 2032
- Figure 65: South America Electrical Bushing Market Revenue Share (%), by Application 2024 & 2032
- Figure 66: South America Electrical Bushing Market Volume Share (%), by Application 2024 & 2032
- Figure 67: South America Electrical Bushing Market Revenue (Million), by Country 2024 & 2032
- Figure 68: South America Electrical Bushing Market Volume (K Unit), by Country 2024 & 2032
- Figure 69: South America Electrical Bushing Market Revenue Share (%), by Country 2024 & 2032
- Figure 70: South America Electrical Bushing Market Volume Share (%), by Country 2024 & 2032
- Figure 71: Middle East and Africa Electrical Bushing Market Revenue (Million), by Type 2024 & 2032
- Figure 72: Middle East and Africa Electrical Bushing Market Volume (K Unit), by Type 2024 & 2032
- Figure 73: Middle East and Africa Electrical Bushing Market Revenue Share (%), by Type 2024 & 2032
- Figure 74: Middle East and Africa Electrical Bushing Market Volume Share (%), by Type 2024 & 2032
- Figure 75: Middle East and Africa Electrical Bushing Market Revenue (Million), by Application 2024 & 2032
- Figure 76: Middle East and Africa Electrical Bushing Market Volume (K Unit), by Application 2024 & 2032
- Figure 77: Middle East and Africa Electrical Bushing Market Revenue Share (%), by Application 2024 & 2032
- Figure 78: Middle East and Africa Electrical Bushing Market Volume Share (%), by Application 2024 & 2032
- Figure 79: Middle East and Africa Electrical Bushing Market Revenue (Million), by Country 2024 & 2032
- Figure 80: Middle East and Africa Electrical Bushing Market Volume (K Unit), by Country 2024 & 2032
- Figure 81: Middle East and Africa Electrical Bushing Market Revenue Share (%), by Country 2024 & 2032
- Figure 82: Middle East and Africa Electrical Bushing Market Volume Share (%), by Country 2024 & 2032
List of Tables
- Table 1: Global Electrical Bushing Market Revenue Million Forecast, by Region 2019 & 2032
- Table 2: Global Electrical Bushing Market Volume K Unit Forecast, by Region 2019 & 2032
- Table 3: Global Electrical Bushing Market Revenue Million Forecast, by Type 2019 & 2032
- Table 4: Global Electrical Bushing Market Volume K Unit Forecast, by Type 2019 & 2032
- Table 5: Global Electrical Bushing Market Revenue Million Forecast, by Application 2019 & 2032
- Table 6: Global Electrical Bushing Market Volume K Unit Forecast, by Application 2019 & 2032
- Table 7: Global Electrical Bushing Market Revenue Million Forecast, by Region 2019 & 2032
- Table 8: Global Electrical Bushing Market Volume K Unit Forecast, by Region 2019 & 2032
- Table 9: Global Electrical Bushing Market Revenue Million Forecast, by Country 2019 & 2032
- Table 10: Global Electrical Bushing Market Volume K Unit Forecast, by Country 2019 & 2032
- Table 11: United States Electrical Bushing Market Revenue (Million) Forecast, by Application 2019 & 2032
- Table 12: United States Electrical Bushing Market Volume (K Unit) Forecast, by Application 2019 & 2032
- Table 13: Canada Electrical Bushing Market Revenue (Million) Forecast, by Application 2019 & 2032
- Table 14: Canada Electrical Bushing Market Volume (K Unit) Forecast, by Application 2019 & 2032
- Table 15: Mexico Electrical Bushing Market Revenue (Million) Forecast, by Application 2019 & 2032
- Table 16: Mexico Electrical Bushing Market Volume (K Unit) Forecast, by Application 2019 & 2032
- Table 17: Global Electrical Bushing Market Revenue Million Forecast, by Country 2019 & 2032
- Table 18: Global Electrical Bushing Market Volume K Unit Forecast, by Country 2019 & 2032
- Table 19: Germany Electrical Bushing Market Revenue (Million) Forecast, by Application 2019 & 2032
- Table 20: Germany Electrical Bushing Market Volume (K Unit) Forecast, by Application 2019 & 2032
- Table 21: United Kingdom Electrical Bushing Market Revenue (Million) Forecast, by Application 2019 & 2032
- Table 22: United Kingdom Electrical Bushing Market Volume (K Unit) Forecast, by Application 2019 & 2032
- Table 23: France Electrical Bushing Market Revenue (Million) Forecast, by Application 2019 & 2032
- Table 24: France Electrical Bushing Market Volume (K Unit) Forecast, by Application 2019 & 2032
- Table 25: Spain Electrical Bushing Market Revenue (Million) Forecast, by Application 2019 & 2032
- Table 26: Spain Electrical Bushing Market Volume (K Unit) Forecast, by Application 2019 & 2032
- Table 27: Italy Electrical Bushing Market Revenue (Million) Forecast, by Application 2019 & 2032
- Table 28: Italy Electrical Bushing Market Volume (K Unit) Forecast, by Application 2019 & 2032
- Table 29: Spain Electrical Bushing Market Revenue (Million) Forecast, by Application 2019 & 2032
- Table 30: Spain Electrical Bushing Market Volume (K Unit) Forecast, by Application 2019 & 2032
- Table 31: Belgium Electrical Bushing Market Revenue (Million) Forecast, by Application 2019 & 2032
- Table 32: Belgium Electrical Bushing Market Volume (K Unit) Forecast, by Application 2019 & 2032
- Table 33: Netherland Electrical Bushing Market Revenue (Million) Forecast, by Application 2019 & 2032
- Table 34: Netherland Electrical Bushing Market Volume (K Unit) Forecast, by Application 2019 & 2032
- Table 35: Nordics Electrical Bushing Market Revenue (Million) Forecast, by Application 2019 & 2032
- Table 36: Nordics Electrical Bushing Market Volume (K Unit) Forecast, by Application 2019 & 2032
- Table 37: Rest of Europe Electrical Bushing Market Revenue (Million) Forecast, by Application 2019 & 2032
- Table 38: Rest of Europe Electrical Bushing Market Volume (K Unit) Forecast, by Application 2019 & 2032
- Table 39: Global Electrical Bushing Market Revenue Million Forecast, by Country 2019 & 2032
- Table 40: Global Electrical Bushing Market Volume K Unit Forecast, by Country 2019 & 2032
- Table 41: China Electrical Bushing Market Revenue (Million) Forecast, by Application 2019 & 2032
- Table 42: China Electrical Bushing Market Volume (K Unit) Forecast, by Application 2019 & 2032
- Table 43: Japan Electrical Bushing Market Revenue (Million) Forecast, by Application 2019 & 2032
- Table 44: Japan Electrical Bushing Market Volume (K Unit) Forecast, by Application 2019 & 2032
- Table 45: India Electrical Bushing Market Revenue (Million) Forecast, by Application 2019 & 2032
- Table 46: India Electrical Bushing Market Volume (K Unit) Forecast, by Application 2019 & 2032
- Table 47: South Korea Electrical Bushing Market Revenue (Million) Forecast, by Application 2019 & 2032
- Table 48: South Korea Electrical Bushing Market Volume (K Unit) Forecast, by Application 2019 & 2032
- Table 49: Southeast Asia Electrical Bushing Market Revenue (Million) Forecast, by Application 2019 & 2032
- Table 50: Southeast Asia Electrical Bushing Market Volume (K Unit) Forecast, by Application 2019 & 2032
- Table 51: Australia Electrical Bushing Market Revenue (Million) Forecast, by Application 2019 & 2032
- Table 52: Australia Electrical Bushing Market Volume (K Unit) Forecast, by Application 2019 & 2032
- Table 53: Indonesia Electrical Bushing Market Revenue (Million) Forecast, by Application 2019 & 2032
- Table 54: Indonesia Electrical Bushing Market Volume (K Unit) Forecast, by Application 2019 & 2032
- Table 55: Phillipes Electrical Bushing Market Revenue (Million) Forecast, by Application 2019 & 2032
- Table 56: Phillipes Electrical Bushing Market Volume (K Unit) Forecast, by Application 2019 & 2032
- Table 57: Singapore Electrical Bushing Market Revenue (Million) Forecast, by Application 2019 & 2032
- Table 58: Singapore Electrical Bushing Market Volume (K Unit) Forecast, by Application 2019 & 2032
- Table 59: Thailandc Electrical Bushing Market Revenue (Million) Forecast, by Application 2019 & 2032
- Table 60: Thailandc Electrical Bushing Market Volume (K Unit) Forecast, by Application 2019 & 2032
- Table 61: Rest of Asia Pacific Electrical Bushing Market Revenue (Million) Forecast, by Application 2019 & 2032
- Table 62: Rest of Asia Pacific Electrical Bushing Market Volume (K Unit) Forecast, by Application 2019 & 2032
- Table 63: Global Electrical Bushing Market Revenue Million Forecast, by Country 2019 & 2032
- Table 64: Global Electrical Bushing Market Volume K Unit Forecast, by Country 2019 & 2032
- Table 65: Brazil Electrical Bushing Market Revenue (Million) Forecast, by Application 2019 & 2032
- Table 66: Brazil Electrical Bushing Market Volume (K Unit) Forecast, by Application 2019 & 2032
- Table 67: Argentina Electrical Bushing Market Revenue (Million) Forecast, by Application 2019 & 2032
- Table 68: Argentina Electrical Bushing Market Volume (K Unit) Forecast, by Application 2019 & 2032
- Table 69: Peru Electrical Bushing Market Revenue (Million) Forecast, by Application 2019 & 2032
- Table 70: Peru Electrical Bushing Market Volume (K Unit) Forecast, by Application 2019 & 2032
- Table 71: Chile Electrical Bushing Market Revenue (Million) Forecast, by Application 2019 & 2032
- Table 72: Chile Electrical Bushing Market Volume (K Unit) Forecast, by Application 2019 & 2032
- Table 73: Colombia Electrical Bushing Market Revenue (Million) Forecast, by Application 2019 & 2032
- Table 74: Colombia Electrical Bushing Market Volume (K Unit) Forecast, by Application 2019 & 2032
- Table 75: Ecuador Electrical Bushing Market Revenue (Million) Forecast, by Application 2019 & 2032
- Table 76: Ecuador Electrical Bushing Market Volume (K Unit) Forecast, by Application 2019 & 2032
- Table 77: Venezuela Electrical Bushing Market Revenue (Million) Forecast, by Application 2019 & 2032
- Table 78: Venezuela Electrical Bushing Market Volume (K Unit) Forecast, by Application 2019 & 2032
- Table 79: Rest of South America Electrical Bushing Market Revenue (Million) Forecast, by Application 2019 & 2032
- Table 80: Rest of South America Electrical Bushing Market Volume (K Unit) Forecast, by Application 2019 & 2032
- Table 81: Global Electrical Bushing Market Revenue Million Forecast, by Country 2019 & 2032
- Table 82: Global Electrical Bushing Market Volume K Unit Forecast, by Country 2019 & 2032
- Table 83: United Arab Emirates Electrical Bushing Market Revenue (Million) Forecast, by Application 2019 & 2032
- Table 84: United Arab Emirates Electrical Bushing Market Volume (K Unit) Forecast, by Application 2019 & 2032
- Table 85: Saudi Arabia Electrical Bushing Market Revenue (Million) Forecast, by Application 2019 & 2032
- Table 86: Saudi Arabia Electrical Bushing Market Volume (K Unit) Forecast, by Application 2019 & 2032
- Table 87: South Africa Electrical Bushing Market Revenue (Million) Forecast, by Application 2019 & 2032
- Table 88: South Africa Electrical Bushing Market Volume (K Unit) Forecast, by Application 2019 & 2032
- Table 89: Rest of Middle East and Africa Electrical Bushing Market Revenue (Million) Forecast, by Application 2019 & 2032
- Table 90: Rest of Middle East and Africa Electrical Bushing Market Volume (K Unit) Forecast, by Application 2019 & 2032
- Table 91: Global Electrical Bushing Market Revenue Million Forecast, by Type 2019 & 2032
- Table 92: Global Electrical Bushing Market Volume K Unit Forecast, by Type 2019 & 2032
- Table 93: Global Electrical Bushing Market Revenue Million Forecast, by Application 2019 & 2032
- Table 94: Global Electrical Bushing Market Volume K Unit Forecast, by Application 2019 & 2032
- Table 95: Global Electrical Bushing Market Revenue Million Forecast, by Country 2019 & 2032
- Table 96: Global Electrical Bushing Market Volume K Unit Forecast, by Country 2019 & 2032
- Table 97: Global Electrical Bushing Market Revenue Million Forecast, by Type 2019 & 2032
- Table 98: Global Electrical Bushing Market Volume K Unit Forecast, by Type 2019 & 2032
- Table 99: Global Electrical Bushing Market Revenue Million Forecast, by Application 2019 & 2032
- Table 100: Global Electrical Bushing Market Volume K Unit Forecast, by Application 2019 & 2032
- Table 101: Global Electrical Bushing Market Revenue Million Forecast, by Country 2019 & 2032
- Table 102: Global Electrical Bushing Market Volume K Unit Forecast, by Country 2019 & 2032
- Table 103: Global Electrical Bushing Market Revenue Million Forecast, by Type 2019 & 2032
- Table 104: Global Electrical Bushing Market Volume K Unit Forecast, by Type 2019 & 2032
- Table 105: Global Electrical Bushing Market Revenue Million Forecast, by Application 2019 & 2032
- Table 106: Global Electrical Bushing Market Volume K Unit Forecast, by Application 2019 & 2032
- Table 107: Global Electrical Bushing Market Revenue Million Forecast, by Country 2019 & 2032
- Table 108: Global Electrical Bushing Market Volume K Unit Forecast, by Country 2019 & 2032
- Table 109: Global Electrical Bushing Market Revenue Million Forecast, by Type 2019 & 2032
- Table 110: Global Electrical Bushing Market Volume K Unit Forecast, by Type 2019 & 2032
- Table 111: Global Electrical Bushing Market Revenue Million Forecast, by Application 2019 & 2032
- Table 112: Global Electrical Bushing Market Volume K Unit Forecast, by Application 2019 & 2032
- Table 113: Global Electrical Bushing Market Revenue Million Forecast, by Country 2019 & 2032
- Table 114: Global Electrical Bushing Market Volume K Unit Forecast, by Country 2019 & 2032
- Table 115: Global Electrical Bushing Market Revenue Million Forecast, by Type 2019 & 2032
- Table 116: Global Electrical Bushing Market Volume K Unit Forecast, by Type 2019 & 2032
- Table 117: Global Electrical Bushing Market Revenue Million Forecast, by Application 2019 & 2032
- Table 118: Global Electrical Bushing Market Volume K Unit Forecast, by Application 2019 & 2032
- Table 119: Global Electrical Bushing Market Revenue Million Forecast, by Country 2019 & 2032
- Table 120: Global Electrical Bushing Market Volume K Unit Forecast, by Country 2019 & 2032
Frequently Asked Questions
1. What is the projected Compound Annual Growth Rate (CAGR) of the Electrical Bushing Market?
The projected CAGR is approximately > 5.60%.
2. Which companies are prominent players in the Electrical Bushing Market?
Key companies in the market include GAMMA Insulator Company, ABB Ltd, Nexans SA, Bharat Heavy Electricals Limited, CG Power and Industrial Solutions Limited, Siemens AG, Eaton Corporation PLC, Nexans SA*List Not Exhaustive, General Electric Company.
3. What are the main segments of the Electrical Bushing Market?
The market segments include Type, Application.
4. Can you provide details about the market size?
The market size is estimated to be USD XX Million as of 2022.
5. What are some drivers contributing to market growth?
Replacement of Existing Grids and the Expansion of Distribution Networks.
6. What are the notable trends driving market growth?
Transformer Application to Dominate the Market.
7. Are there any restraints impacting market growth?
High Installation Costs.
8. Can you provide examples of recent developments in the market?
N/A
9. What pricing options are available for accessing the report?
Pricing options include single-user, multi-user, and enterprise licenses priced at USD 4750, USD 5250, and USD 8750 respectively.
10. Is the market size provided in terms of value or volume?
The market size is provided in terms of value, measured in Million and volume, measured in K Unit.
11. Are there any specific market keywords associated with the report?
Yes, the market keyword associated with the report is "Electrical Bushing Market," which aids in identifying and referencing the specific market segment covered.
12. How do I determine which pricing option suits my needs best?
The pricing options vary based on user requirements and access needs. Individual users may opt for single-user licenses, while businesses requiring broader access may choose multi-user or enterprise licenses for cost-effective access to the report.
13. Are there any additional resources or data provided in the Electrical Bushing Market report?
While the report offers comprehensive insights, it's advisable to review the specific contents or supplementary materials provided to ascertain if additional resources or data are available.
14. How can I stay updated on further developments or reports in the Electrical Bushing Market?
To stay informed about further developments, trends, and reports in the Electrical Bushing Market, consider subscribing to industry newsletters, following relevant companies and organizations, or regularly checking reputable industry news sources and publications.
Methodology
Step 1 - Identification of Relevant Samples Size from Population Database


Step 2 - Approaches for Defining Global Market Size (Value, Volume* & Price*)

Note*: In applicable scenarios
Step 3 - Data Sources
Primary Research
- Web Analytics
- Survey Reports
- Research Institute
- Latest Research Reports
- Opinion Leaders
Secondary Research
- Annual Reports
- White Paper
- Latest Press Release
- Industry Association
- Paid Database
- Investor Presentations

Step 4 - Data Triangulation
Involves using different sources of information in order to increase the validity of a study
These sources are likely to be stakeholders in a program - participants, other researchers, program staff, other community members, and so on.
Then we put all data in single framework & apply various statistical tools to find out the dynamic on the market.
During the analysis stage, feedback from the stakeholder groups would be compared to determine areas of agreement as well as areas of divergence
