

Key Insights
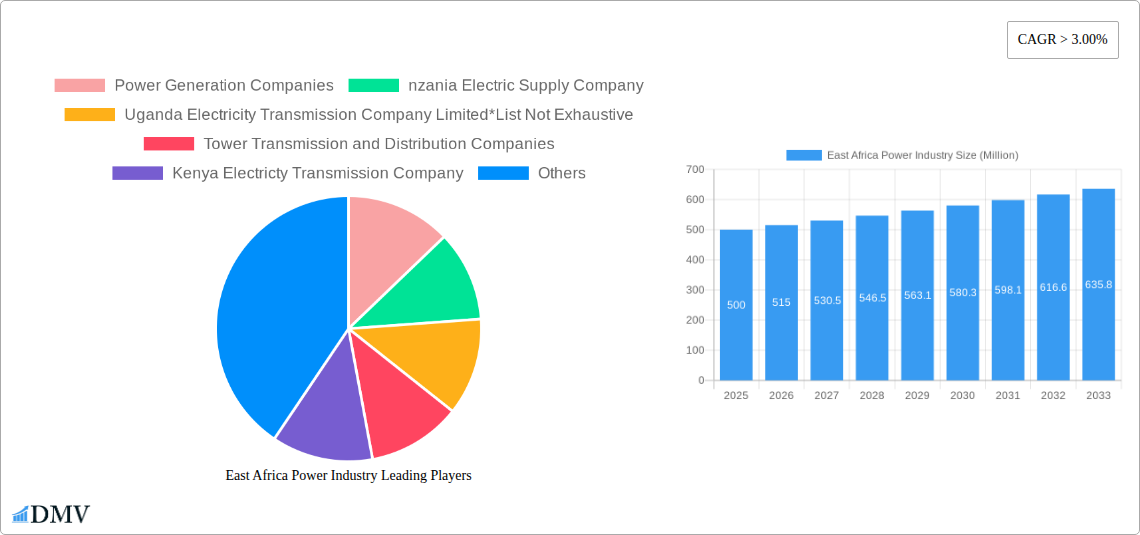
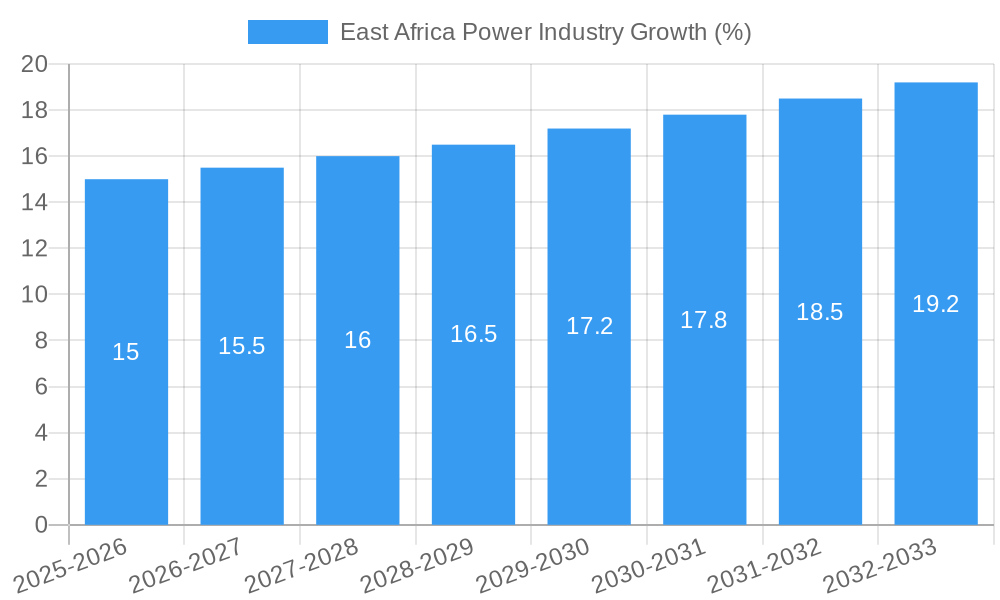
The East African power industry is experiencing robust growth, driven by increasing urbanization, industrialization, and a rising demand for electricity across residential, commercial, and industrial sectors. A compound annual growth rate (CAGR) exceeding 3% indicates a significant expansion, projected to continue through 2033. Key drivers include government initiatives promoting renewable energy sources like hydro and non-hydro renewables (solar, wind, geothermal), coupled with investments in expanding power transmission and distribution infrastructure to address historical shortages and improve reliability. The substantial market size, estimated in the hundreds of millions (a precise figure requires further data), reflects the region's significant energy needs and the potential for further expansion. Challenges remain, including the need for further grid modernization, the integration of intermittent renewable energy sources, and addressing the affordability and accessibility of electricity for underserved populations. Significant players, including Kenya Power and Lighting Company PLC, Tanzania Electric Supply Company, and Uganda Electricity Transmission Company Limited, are actively involved in shaping the industry's future, though competition is expected to increase with further foreign investment.
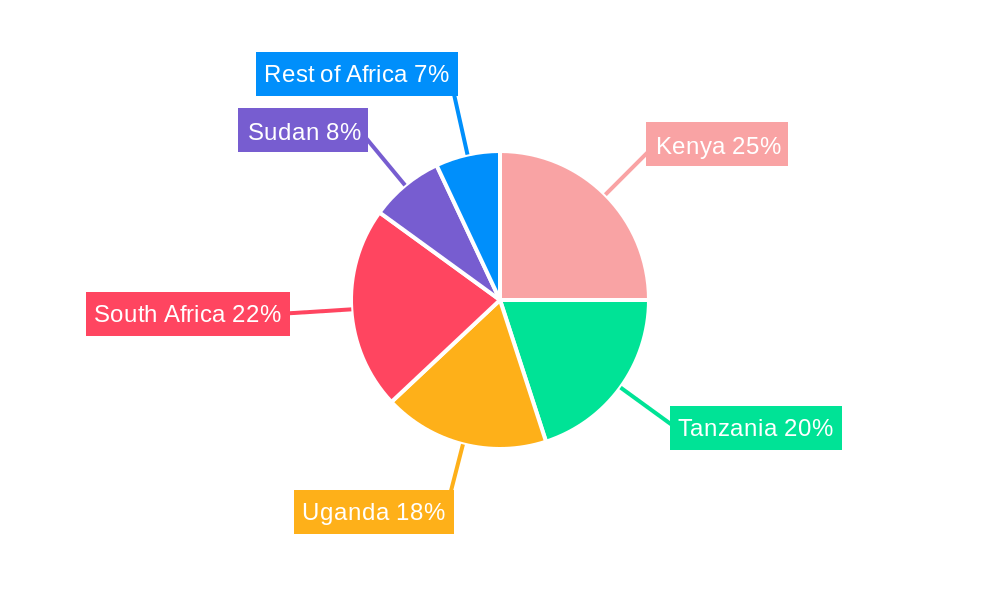
The segmentation of the East African power market into power generation (including hydro and non-hydro renewables), transmission and distribution, and end-user sectors (residential, commercial, industrial) allows for a more nuanced understanding of market dynamics. The substantial investments in renewable energy are shaping the generation landscape, moving away from a reliance on fossil fuels. However, the transmission and distribution infrastructure requires significant upgrades to effectively harness and distribute this growing capacity. Addressing these infrastructure gaps, and ensuring equitable access across different end-user segments, will be crucial for sustained and inclusive growth within the East African power industry over the coming decade. Further analysis of specific country data (South Africa, Sudan, Uganda, Tanzania, Kenya, and Rest of Africa) would reveal localized variations in market trends, regulatory frameworks, and investment opportunities.
East Africa Power Industry: Market Analysis & Forecast (2019-2033)
This comprehensive report provides an in-depth analysis of the East Africa power industry, offering valuable insights for stakeholders seeking to navigate this dynamic market. With a study period spanning 2019-2033, a base and estimated year of 2025, and a forecast period of 2025-2033, this report delivers crucial data and projections for informed decision-making. The historical period covered is 2019-2024. We analyze key segments including Power Generation (Hydro and Non-Hydro Renewables), Power Transmission and Distribution, and end-user sectors (Residential, Commercial, and Industrial). The report features key players like Kenya Power and Lighting Company PLC, Kenya Electricity Generating Company Plc, Tanzania Electric Supply Company, Uganda Electricity Transmission Company Limited, Ethiopian Electric Company, and Uganda Electricity Generation Company Limited. Discover the market size, growth drivers, challenges, and future opportunities within this rapidly evolving landscape.
East Africa Power Industry Market Composition & Trends
This section evaluates the market concentration, innovation, regulatory landscape, substitute products, end-user profiles, and M&A activities within the East African power industry. The report details market share distribution among key players and analyzes M&A deal values, revealing the competitive dynamics at play. The East African power market is characterized by a mix of state-owned and private entities, resulting in a moderately concentrated market. However, increasing private sector participation and investments in renewable energy are driving changes in market share. The regulatory landscape is evolving, with a focus on attracting foreign investment and promoting renewable energy adoption. The significant growth of renewable energy sources like solar and geothermal presents both opportunities and challenges for traditional power generation companies. M&A activities have been moderate, with deal values reaching approximately xx Million USD in recent years.
- Market Share Distribution (2024): Kenya Power (xx%), Tanzania Electric Supply Company (xx%), Others (xx%).
- M&A Deal Values (2019-2024): Approximately xx Million USD.
- Innovation Catalysts: Government incentives for renewable energy, technological advancements in energy storage.
- Substitute Products: Increased adoption of off-grid solar solutions.
East Africa Power Industry Industry Evolution
This section analyzes the market's growth trajectory, technological advancements, and shifting consumer demands, providing specific data points such as growth rates and adoption metrics. The East African power industry has experienced significant growth over the past five years, with an average annual growth rate (AAGR) of xx% during 2019-2024. This growth is driven by increasing energy demand from a growing population and industrialization, alongside government initiatives to expand access to electricity. Technological advancements in renewable energy, smart grid technologies, and energy storage solutions are transforming the sector. Consumer demand is shifting towards cleaner and more reliable energy sources, pushing the adoption of renewable energy technologies. The integration of smart meters is improving efficiency and reducing energy losses.
- AAGR (2019-2024): xx%
- Renewable Energy Capacity Additions (2019-2024): xx Million kW
- Smart Meter Adoption Rate (2024): xx%
Leading Regions, Countries, or Segments in East Africa Power Industry
This section highlights the dominant regions, countries, or segments within the East African power industry. Kenya and Tanzania are currently leading in terms of installed capacity and energy consumption. The Power Generation sector, particularly renewable energy sources, demonstrates significant growth potential, fueled by substantial investment in hydropower and geothermal projects. The residential sector accounts for a significant portion of overall electricity consumption.
- Key Drivers for Kenya's Dominance: Significant investments in geothermal and other renewable energy sources, favorable regulatory environment.
- Key Drivers for Tanzania's Growth: Increased investments in power generation projects and grid expansion.
- Dominant Segment: Power Generation (Hydro and Non-Hydro Renewables).
- Fastest Growing End-User Segment: Industrial.
East Africa Power Industry Product Innovations
This section details product innovations, applications, and performance metrics. Recent innovations include the introduction of advanced energy storage systems, smart grid technologies, and improved renewable energy technologies, such as more efficient solar panels and wind turbines. These innovations aim to improve the reliability, efficiency, and affordability of electricity access. The unique selling propositions of these products include reduced operational costs, enhanced grid stability, and integration with renewable energy sources.
Propelling Factors for East Africa Power Industry Growth
Key growth drivers include increasing energy demand from a growing population and industrialization, supportive government policies and investments in infrastructure development, and the declining cost of renewable energy technologies. The substantial increase in foreign direct investment in the renewable energy sector is another significant factor.
Obstacles in the East Africa Power Industry Market
Barriers include inadequate infrastructure, transmission and distribution losses, and the high cost of capital for infrastructure projects. Regulatory complexities and bureaucratic hurdles also impede project development and implementation. Furthermore, the inconsistent energy supply and high tariffs significantly impact the competitiveness of East African businesses.
Future Opportunities in East Africa Power Industry
Emerging opportunities lie in further expansion of renewable energy capacity, the growth of off-grid solutions to reach underserved communities, and the development of smart grids. Investments in energy storage technologies to mitigate the intermittency of renewable sources offer significant potential.
Major Players in the East Africa Power Industry Ecosystem
- Kenya Power and Lighting Company PLC
- Kenya Electricity Generating Company Plc
- Tanzania Electric Supply Company
- Uganda Electricity Transmission Company Limited
- Ethiopian Electric Company
- Uganda Electricity Generation Company Limited
- Tower Transmission and Distribution Companies (List Not Exhaustive)
Key Developments in East Africa Power Industry Industry
- September 2021: Safaricom proposes a USD 300 Million smart meter system for Kenya Power to reduce power losses.
- November 2020: Kenya Electricity Generating Company PLC unveils a renewable energy project pipeline, targeting 83.3 MW addition to the national grid via Olkaria 1 Unit 6 in 2021.
Strategic East Africa Power Industry Market Forecast
The East Africa power industry is poised for continued strong growth, driven by sustained economic development and increasing electrification rates. Investments in renewable energy and grid infrastructure will remain crucial. The rising adoption of smart technologies will further enhance efficiency and grid stability, unlocking significant market potential for the next decade.
East Africa Power Industry Segmentation
-
1. Sector
-
1.1. Power Generation
- 1.1.1. Thermal
- 1.1.2. Hydro and Non-Hydro Renewables
- 1.2. Power Transmission and Distribution
-
1.1. Power Generation
-
2. Geography
- 2.1. Kenya
- 2.2. Ethiopia
- 2.3. Tanzania
- 2.4. Uganda
- 2.5. Rest of East Africa
East Africa Power Industry Segmentation By Geography
- 1. Kenya
- 2. Ethiopia
- 3. Tanzania
- 4. Uganda
- 5. Rest of East Africa
East Africa Power Industry REPORT HIGHLIGHTS
| Aspects | Details |
|---|---|
| Study Period | 2019-2033 |
| Base Year | 2024 |
| Estimated Year | 2025 |
| Forecast Period | 2025-2033 |
| Historical Period | 2019-2024 |
| Growth Rate | CAGR of > 3.00% from 2019-2033 |
| Segmentation |
|
Table of Contents
- 1. Introduction
- 1.1. Research Scope
- 1.2. Market Segmentation
- 1.3. Research Methodology
- 1.4. Definitions and Assumptions
- 2. Executive Summary
- 2.1. Introduction
- 3. Market Dynamics
- 3.1. Introduction
- 3.2. Market Drivers
- 3.2.1. 4.; Expanding Pipeline Infrastructure4.; Growing Energy Demand
- 3.3. Market Restrains
- 3.3.1. 4.; Political Instability and Militant Attacks on Pipeline Infrastructure
- 3.4. Market Trends
- 3.4.1. Hydro and Non-Hydro Renewables are Expected to Witness Significant Growth
- 4. Market Factor Analysis
- 4.1. Porters Five Forces
- 4.2. Supply/Value Chain
- 4.3. PESTEL analysis
- 4.4. Market Entropy
- 4.5. Patent/Trademark Analysis
- 5. East Africa Power Industry Analysis, Insights and Forecast, 2019-2031
- 5.1. Market Analysis, Insights and Forecast - by Sector
- 5.1.1. Power Generation
- 5.1.1.1. Thermal
- 5.1.1.2. Hydro and Non-Hydro Renewables
- 5.1.2. Power Transmission and Distribution
- 5.1.1. Power Generation
- 5.2. Market Analysis, Insights and Forecast - by Geography
- 5.2.1. Kenya
- 5.2.2. Ethiopia
- 5.2.3. Tanzania
- 5.2.4. Uganda
- 5.2.5. Rest of East Africa
- 5.3. Market Analysis, Insights and Forecast - by Region
- 5.3.1. Kenya
- 5.3.2. Ethiopia
- 5.3.3. Tanzania
- 5.3.4. Uganda
- 5.3.5. Rest of East Africa
- 5.1. Market Analysis, Insights and Forecast - by Sector
- 6. Kenya East Africa Power Industry Analysis, Insights and Forecast, 2019-2031
- 6.1. Market Analysis, Insights and Forecast - by Sector
- 6.1.1. Power Generation
- 6.1.1.1. Thermal
- 6.1.1.2. Hydro and Non-Hydro Renewables
- 6.1.2. Power Transmission and Distribution
- 6.1.1. Power Generation
- 6.2. Market Analysis, Insights and Forecast - by Geography
- 6.2.1. Kenya
- 6.2.2. Ethiopia
- 6.2.3. Tanzania
- 6.2.4. Uganda
- 6.2.5. Rest of East Africa
- 6.1. Market Analysis, Insights and Forecast - by Sector
- 7. Ethiopia East Africa Power Industry Analysis, Insights and Forecast, 2019-2031
- 7.1. Market Analysis, Insights and Forecast - by Sector
- 7.1.1. Power Generation
- 7.1.1.1. Thermal
- 7.1.1.2. Hydro and Non-Hydro Renewables
- 7.1.2. Power Transmission and Distribution
- 7.1.1. Power Generation
- 7.2. Market Analysis, Insights and Forecast - by Geography
- 7.2.1. Kenya
- 7.2.2. Ethiopia
- 7.2.3. Tanzania
- 7.2.4. Uganda
- 7.2.5. Rest of East Africa
- 7.1. Market Analysis, Insights and Forecast - by Sector
- 8. Tanzania East Africa Power Industry Analysis, Insights and Forecast, 2019-2031
- 8.1. Market Analysis, Insights and Forecast - by Sector
- 8.1.1. Power Generation
- 8.1.1.1. Thermal
- 8.1.1.2. Hydro and Non-Hydro Renewables
- 8.1.2. Power Transmission and Distribution
- 8.1.1. Power Generation
- 8.2. Market Analysis, Insights and Forecast - by Geography
- 8.2.1. Kenya
- 8.2.2. Ethiopia
- 8.2.3. Tanzania
- 8.2.4. Uganda
- 8.2.5. Rest of East Africa
- 8.1. Market Analysis, Insights and Forecast - by Sector
- 9. Uganda East Africa Power Industry Analysis, Insights and Forecast, 2019-2031
- 9.1. Market Analysis, Insights and Forecast - by Sector
- 9.1.1. Power Generation
- 9.1.1.1. Thermal
- 9.1.1.2. Hydro and Non-Hydro Renewables
- 9.1.2. Power Transmission and Distribution
- 9.1.1. Power Generation
- 9.2. Market Analysis, Insights and Forecast - by Geography
- 9.2.1. Kenya
- 9.2.2. Ethiopia
- 9.2.3. Tanzania
- 9.2.4. Uganda
- 9.2.5. Rest of East Africa
- 9.1. Market Analysis, Insights and Forecast - by Sector
- 10. Rest of East Africa East Africa Power Industry Analysis, Insights and Forecast, 2019-2031
- 10.1. Market Analysis, Insights and Forecast - by Sector
- 10.1.1. Power Generation
- 10.1.1.1. Thermal
- 10.1.1.2. Hydro and Non-Hydro Renewables
- 10.1.2. Power Transmission and Distribution
- 10.1.1. Power Generation
- 10.2. Market Analysis, Insights and Forecast - by Geography
- 10.2.1. Kenya
- 10.2.2. Ethiopia
- 10.2.3. Tanzania
- 10.2.4. Uganda
- 10.2.5. Rest of East Africa
- 10.1. Market Analysis, Insights and Forecast - by Sector
- 11. South Africa East Africa Power Industry Analysis, Insights and Forecast, 2019-2031
- 12. Sudan East Africa Power Industry Analysis, Insights and Forecast, 2019-2031
- 13. Uganda East Africa Power Industry Analysis, Insights and Forecast, 2019-2031
- 14. Tanzania East Africa Power Industry Analysis, Insights and Forecast, 2019-2031
- 15. Kenya East Africa Power Industry Analysis, Insights and Forecast, 2019-2031
- 16. Rest of Africa East Africa Power Industry Analysis, Insights and Forecast, 2019-2031
- 17. Competitive Analysis
- 17.1. Market Share Analysis 2024
- 17.2. Company Profiles
- 17.2.1 Power Generation Companies
- 17.2.1.1. Overview
- 17.2.1.2. Products
- 17.2.1.3. SWOT Analysis
- 17.2.1.4. Recent Developments
- 17.2.1.5. Financials (Based on Availability)
- 17.2.2 nzania Electric Supply Company
- 17.2.2.1. Overview
- 17.2.2.2. Products
- 17.2.2.3. SWOT Analysis
- 17.2.2.4. Recent Developments
- 17.2.2.5. Financials (Based on Availability)
- 17.2.3 Uganda Electricity Transmission Company Limited*List Not Exhaustive
- 17.2.3.1. Overview
- 17.2.3.2. Products
- 17.2.3.3. SWOT Analysis
- 17.2.3.4. Recent Developments
- 17.2.3.5. Financials (Based on Availability)
- 17.2.4 Tower Transmission and Distribution Companies
- 17.2.4.1. Overview
- 17.2.4.2. Products
- 17.2.4.3. SWOT Analysis
- 17.2.4.4. Recent Developments
- 17.2.4.5. Financials (Based on Availability)
- 17.2.5 Kenya Electricty Transmission Company
- 17.2.5.1. Overview
- 17.2.5.2. Products
- 17.2.5.3. SWOT Analysis
- 17.2.5.4. Recent Developments
- 17.2.5.5. Financials (Based on Availability)
- 17.2.6 hiopian Electric Company
- 17.2.6.1. Overview
- 17.2.6.2. Products
- 17.2.6.3. SWOT Analysis
- 17.2.6.4. Recent Developments
- 17.2.6.5. Financials (Based on Availability)
- 17.2.7 Uganda Electricity Generation Company Limited
- 17.2.7.1. Overview
- 17.2.7.2. Products
- 17.2.7.3. SWOT Analysis
- 17.2.7.4. Recent Developments
- 17.2.7.5. Financials (Based on Availability)
- 17.2.8 Kenya Power and Lightinh Company PLC
- 17.2.8.1. Overview
- 17.2.8.2. Products
- 17.2.8.3. SWOT Analysis
- 17.2.8.4. Recent Developments
- 17.2.8.5. Financials (Based on Availability)
- 17.2.9 Kenya Electricity Generating Company Plc
- 17.2.9.1. Overview
- 17.2.9.2. Products
- 17.2.9.3. SWOT Analysis
- 17.2.9.4. Recent Developments
- 17.2.9.5. Financials (Based on Availability)
- 17.2.1 Power Generation Companies
List of Figures
- Figure 1: East Africa Power Industry Revenue Breakdown (Million, %) by Product 2024 & 2032
- Figure 2: East Africa Power Industry Share (%) by Company 2024
List of Tables
- Table 1: East Africa Power Industry Revenue Million Forecast, by Region 2019 & 2032
- Table 2: East Africa Power Industry Volume Gigawatt Forecast, by Region 2019 & 2032
- Table 3: East Africa Power Industry Revenue Million Forecast, by Sector 2019 & 2032
- Table 4: East Africa Power Industry Volume Gigawatt Forecast, by Sector 2019 & 2032
- Table 5: East Africa Power Industry Revenue Million Forecast, by Geography 2019 & 2032
- Table 6: East Africa Power Industry Volume Gigawatt Forecast, by Geography 2019 & 2032
- Table 7: East Africa Power Industry Revenue Million Forecast, by Region 2019 & 2032
- Table 8: East Africa Power Industry Volume Gigawatt Forecast, by Region 2019 & 2032
- Table 9: East Africa Power Industry Revenue Million Forecast, by Country 2019 & 2032
- Table 10: East Africa Power Industry Volume Gigawatt Forecast, by Country 2019 & 2032
- Table 11: South Africa East Africa Power Industry Revenue (Million) Forecast, by Application 2019 & 2032
- Table 12: South Africa East Africa Power Industry Volume (Gigawatt) Forecast, by Application 2019 & 2032
- Table 13: Sudan East Africa Power Industry Revenue (Million) Forecast, by Application 2019 & 2032
- Table 14: Sudan East Africa Power Industry Volume (Gigawatt) Forecast, by Application 2019 & 2032
- Table 15: Uganda East Africa Power Industry Revenue (Million) Forecast, by Application 2019 & 2032
- Table 16: Uganda East Africa Power Industry Volume (Gigawatt) Forecast, by Application 2019 & 2032
- Table 17: Tanzania East Africa Power Industry Revenue (Million) Forecast, by Application 2019 & 2032
- Table 18: Tanzania East Africa Power Industry Volume (Gigawatt) Forecast, by Application 2019 & 2032
- Table 19: Kenya East Africa Power Industry Revenue (Million) Forecast, by Application 2019 & 2032
- Table 20: Kenya East Africa Power Industry Volume (Gigawatt) Forecast, by Application 2019 & 2032
- Table 21: Rest of Africa East Africa Power Industry Revenue (Million) Forecast, by Application 2019 & 2032
- Table 22: Rest of Africa East Africa Power Industry Volume (Gigawatt) Forecast, by Application 2019 & 2032
- Table 23: East Africa Power Industry Revenue Million Forecast, by Sector 2019 & 2032
- Table 24: East Africa Power Industry Volume Gigawatt Forecast, by Sector 2019 & 2032
- Table 25: East Africa Power Industry Revenue Million Forecast, by Geography 2019 & 2032
- Table 26: East Africa Power Industry Volume Gigawatt Forecast, by Geography 2019 & 2032
- Table 27: East Africa Power Industry Revenue Million Forecast, by Country 2019 & 2032
- Table 28: East Africa Power Industry Volume Gigawatt Forecast, by Country 2019 & 2032
- Table 29: East Africa Power Industry Revenue Million Forecast, by Sector 2019 & 2032
- Table 30: East Africa Power Industry Volume Gigawatt Forecast, by Sector 2019 & 2032
- Table 31: East Africa Power Industry Revenue Million Forecast, by Geography 2019 & 2032
- Table 32: East Africa Power Industry Volume Gigawatt Forecast, by Geography 2019 & 2032
- Table 33: East Africa Power Industry Revenue Million Forecast, by Country 2019 & 2032
- Table 34: East Africa Power Industry Volume Gigawatt Forecast, by Country 2019 & 2032
- Table 35: East Africa Power Industry Revenue Million Forecast, by Sector 2019 & 2032
- Table 36: East Africa Power Industry Volume Gigawatt Forecast, by Sector 2019 & 2032
- Table 37: East Africa Power Industry Revenue Million Forecast, by Geography 2019 & 2032
- Table 38: East Africa Power Industry Volume Gigawatt Forecast, by Geography 2019 & 2032
- Table 39: East Africa Power Industry Revenue Million Forecast, by Country 2019 & 2032
- Table 40: East Africa Power Industry Volume Gigawatt Forecast, by Country 2019 & 2032
- Table 41: East Africa Power Industry Revenue Million Forecast, by Sector 2019 & 2032
- Table 42: East Africa Power Industry Volume Gigawatt Forecast, by Sector 2019 & 2032
- Table 43: East Africa Power Industry Revenue Million Forecast, by Geography 2019 & 2032
- Table 44: East Africa Power Industry Volume Gigawatt Forecast, by Geography 2019 & 2032
- Table 45: East Africa Power Industry Revenue Million Forecast, by Country 2019 & 2032
- Table 46: East Africa Power Industry Volume Gigawatt Forecast, by Country 2019 & 2032
- Table 47: East Africa Power Industry Revenue Million Forecast, by Sector 2019 & 2032
- Table 48: East Africa Power Industry Volume Gigawatt Forecast, by Sector 2019 & 2032
- Table 49: East Africa Power Industry Revenue Million Forecast, by Geography 2019 & 2032
- Table 50: East Africa Power Industry Volume Gigawatt Forecast, by Geography 2019 & 2032
- Table 51: East Africa Power Industry Revenue Million Forecast, by Country 2019 & 2032
- Table 52: East Africa Power Industry Volume Gigawatt Forecast, by Country 2019 & 2032
Frequently Asked Questions
1. What is the projected Compound Annual Growth Rate (CAGR) of the East Africa Power Industry?
The projected CAGR is approximately > 3.00%.
2. Which companies are prominent players in the East Africa Power Industry?
Key companies in the market include Power Generation Companies, nzania Electric Supply Company, Uganda Electricity Transmission Company Limited*List Not Exhaustive, Tower Transmission and Distribution Companies, Kenya Electricty Transmission Company, hiopian Electric Company, Uganda Electricity Generation Company Limited, Kenya Power and Lightinh Company PLC, Kenya Electricity Generating Company Plc.
3. What are the main segments of the East Africa Power Industry?
The market segments include Sector, Geography.
4. Can you provide details about the market size?
The market size is estimated to be USD XX Million as of 2022.
5. What are some drivers contributing to market growth?
4.; Expanding Pipeline Infrastructure4.; Growing Energy Demand.
6. What are the notable trends driving market growth?
Hydro and Non-Hydro Renewables are Expected to Witness Significant Growth.
7. Are there any restraints impacting market growth?
4.; Political Instability and Militant Attacks on Pipeline Infrastructure.
8. Can you provide examples of recent developments in the market?
In September 2021, Kenyan telecoms operator Safaricom, announced that the company has submitted a proposal to Kenya Power for the installation of a USD 300 million smart meter system at the utility, The main objective behind the proposal was to control power losses of the utility company.
9. What pricing options are available for accessing the report?
Pricing options include single-user, multi-user, and enterprise licenses priced at USD 4750, USD 5250, and USD 8750 respectively.
10. Is the market size provided in terms of value or volume?
The market size is provided in terms of value, measured in Million and volume, measured in Gigawatt.
11. Are there any specific market keywords associated with the report?
Yes, the market keyword associated with the report is "East Africa Power Industry," which aids in identifying and referencing the specific market segment covered.
12. How do I determine which pricing option suits my needs best?
The pricing options vary based on user requirements and access needs. Individual users may opt for single-user licenses, while businesses requiring broader access may choose multi-user or enterprise licenses for cost-effective access to the report.
13. Are there any additional resources or data provided in the East Africa Power Industry report?
While the report offers comprehensive insights, it's advisable to review the specific contents or supplementary materials provided to ascertain if additional resources or data are available.
14. How can I stay updated on further developments or reports in the East Africa Power Industry?
To stay informed about further developments, trends, and reports in the East Africa Power Industry, consider subscribing to industry newsletters, following relevant companies and organizations, or regularly checking reputable industry news sources and publications.
Methodology
Step 1 - Identification of Relevant Samples Size from Population Database


Step 2 - Approaches for Defining Global Market Size (Value, Volume* & Price*)

Note*: In applicable scenarios
Step 3 - Data Sources
Primary Research
- Web Analytics
- Survey Reports
- Research Institute
- Latest Research Reports
- Opinion Leaders
Secondary Research
- Annual Reports
- White Paper
- Latest Press Release
- Industry Association
- Paid Database
- Investor Presentations

Step 4 - Data Triangulation
Involves using different sources of information in order to increase the validity of a study
These sources are likely to be stakeholders in a program - participants, other researchers, program staff, other community members, and so on.
Then we put all data in single framework & apply various statistical tools to find out the dynamic on the market.
During the analysis stage, feedback from the stakeholder groups would be compared to determine areas of agreement as well as areas of divergence
