

Key Insights
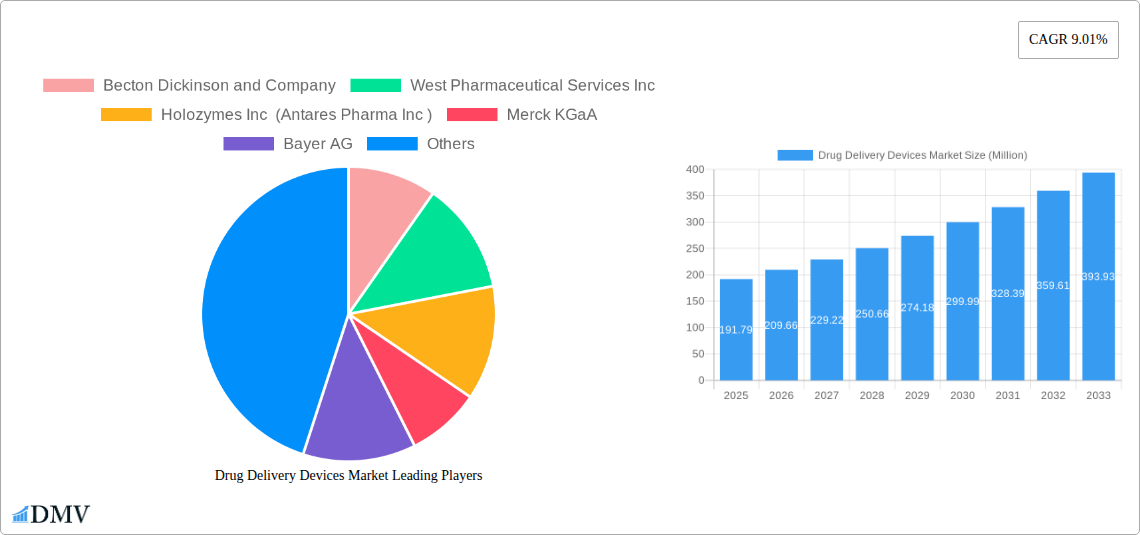
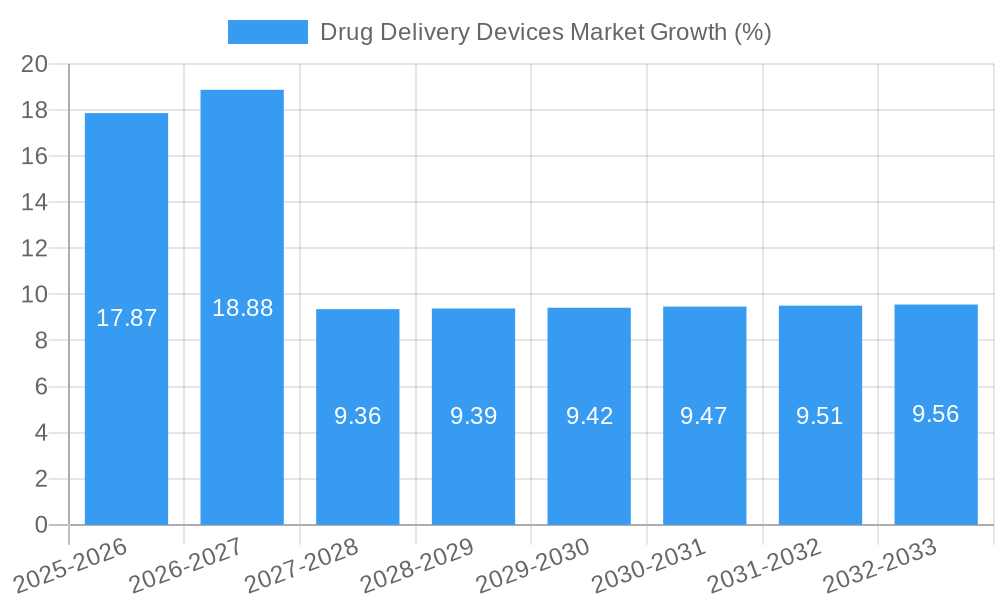
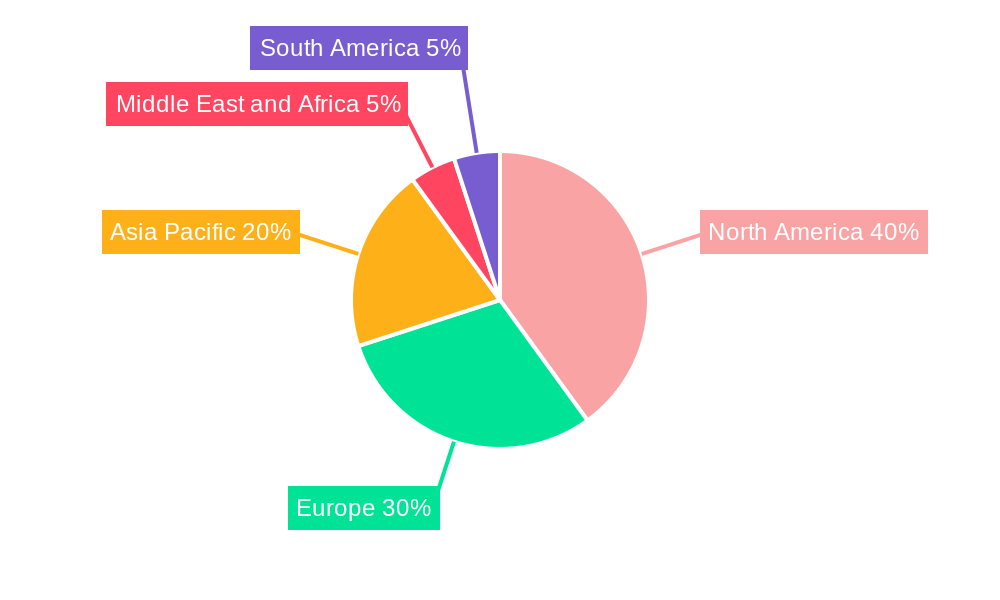
The global Drug Delivery Devices market, valued at $191.79 million in 2025, is projected to experience robust growth, exhibiting a Compound Annual Growth Rate (CAGR) of 9.01% from 2025 to 2033. This expansion is driven by several key factors. The increasing prevalence of chronic diseases like cancer, cardiovascular ailments, and diabetes necessitates advanced drug delivery systems for improved patient outcomes and adherence. Technological advancements in areas such as injectables (including pre-filled syringes and auto-injectors), topical patches with enhanced drug release mechanisms, and ocular drug delivery systems are fueling market growth. Furthermore, the rising demand for personalized medicine and targeted drug delivery is boosting the adoption of sophisticated devices. The market is segmented by route of administration (injectable, topical, ocular, and others), application (cancer, cardiovascular, diabetes, infectious diseases, and others), and end-user (hospitals, ambulatory surgical centers, and others). The injectable segment currently dominates, propelled by the high efficacy and versatility of injectable drugs. However, the topical and ocular segments are poised for significant growth, driven by the increasing preference for non-invasive drug delivery methods. North America and Europe currently hold the largest market share due to established healthcare infrastructure and high adoption of advanced technologies. However, the Asia-Pacific region is expected to witness substantial growth in the coming years due to rising healthcare expenditure and increasing awareness of advanced drug delivery solutions.
The competitive landscape is characterized by a mix of large multinational pharmaceutical companies and specialized drug delivery device manufacturers. Companies like Becton Dickinson, West Pharmaceutical Services, and others are actively investing in research and development to enhance their product portfolio and expand their market reach. Strategic partnerships, mergers, and acquisitions are expected to further shape the market dynamics. Regulatory approvals and stringent quality control standards are crucial considerations for market players. The market faces certain restraints, including high development costs associated with novel drug delivery technologies and potential regulatory hurdles. Nevertheless, the overall market outlook remains positive, driven by the aforementioned drivers and the continuously growing need for innovative and efficient drug delivery solutions to address prevalent and emerging health challenges.
Drug Delivery Devices Market: A Comprehensive Report (2019-2033)
This insightful report provides a detailed analysis of the Drug Delivery Devices Market, projecting a market valuation of XX Million by 2033. It offers a comprehensive overview of market dynamics, competitive landscapes, and future growth prospects, covering the period from 2019 to 2033, with 2025 as the base year and estimated year. This meticulously researched report is an invaluable resource for stakeholders seeking to understand and capitalize on opportunities within this rapidly evolving market.
Drug Delivery Devices Market Composition & Trends
The Drug Delivery Devices market is characterized by a moderately concentrated landscape, with key players such as Becton Dickinson and Company, West Pharmaceutical Services Inc., and others holding significant market share. Market share distribution is expected to remain relatively stable, though M&A activity may influence this. Innovation is a critical driver, fueled by advancements in materials science, nanotechnology, and biotechnology. The regulatory landscape, varying across different geographies, plays a crucial role in product approvals and market access. Substitute products, such as traditional oral medications, continue to compete, although the advantages of targeted and controlled drug delivery are increasingly recognized. The end-user profile is diverse, encompassing hospitals, ambulatory surgical centers, and other healthcare providers.
- Market Concentration: Moderately concentrated, with top 5 players holding approximately xx% of the market share in 2024.
- Innovation Catalysts: Nanotechnology, biomaterials, and digital technologies.
- Regulatory Landscape: Stringent regulations vary across geographies impacting market entry.
- Substitute Products: Traditional oral and intravenous medications.
- M&A Activity: Significant M&A activity in recent years, with deal values exceeding XX Million in 2024. (Specific deal values and details are included in the full report).
- End-User Profile: Hospitals, Ambulatory Surgical Centers, Home Healthcare, and Research Institutes.
Drug Delivery Devices Market Industry Evolution
The Drug Delivery Devices market has witnessed substantial growth from 2019 to 2024, driven by a confluence of factors. Technological advancements, particularly in targeted drug delivery systems, have improved efficacy and patient compliance. This has led to a shift in consumer demand towards more convenient and less invasive drug administration methods. Growth has been particularly strong in segments such as injectable devices due to increased demand for biologics and personalized medicine. The market is projected to maintain a robust Compound Annual Growth Rate (CAGR) of xx% from 2025 to 2033, propelled by increasing prevalence of chronic diseases and aging populations. Adoption rates for advanced drug delivery systems, like those employing smart sensors or controlled-release mechanisms, are expected to significantly increase, with adoption exceeding xx% by 2033.
Leading Regions, Countries, or Segments in Drug Delivery Devices Market
The injectable drug delivery segment dominates the market, driven by the rising prevalence of chronic diseases requiring frequent injections and the growing demand for biologics. North America and Europe currently hold the largest market share.
- By Route of Administration: Injectable devices lead due to high demand for biologics and increasing prevalence of chronic diseases.
- By Application: Cancer therapy drives significant growth, followed by cardiovascular and diabetes applications.
- By End User: Hospitals and ambulatory surgical centers are the primary end users.
Key Drivers:
- High prevalence of chronic diseases: Diabetes, cancer, and cardiovascular diseases are major drivers.
- Technological advancements: Nanotechnology and microfluidics enhance drug delivery efficiency.
- Regulatory support: Increased government funding and approval of innovative drug delivery systems.
The dominance of North America and Europe is attributed to high healthcare expenditure, advanced healthcare infrastructure, and a robust regulatory framework that fosters innovation. However, Asia-Pacific is emerging as a rapidly growing market due to increasing healthcare expenditure and rising prevalence of chronic diseases.
Drug Delivery Devices Market Product Innovations
Recent innovations focus on improving drug efficacy, reducing side effects, and enhancing patient comfort. Microneedle patches for painless drug delivery, smart inhalers with digital connectivity, and implantable pumps with precise dosage control represent significant advancements. These innovations address unmet needs and improve treatment outcomes, driving market expansion. Unique selling propositions include improved patient compliance, reduced injection pain, and more targeted drug delivery, which has resulted in improvements in treatment outcomes.
Propelling Factors for Drug Delivery Devices Market Growth
Technological advancements such as nanotechnology, microfluidics, and biomaterials are driving innovation in drug delivery systems, leading to improved efficacy, reduced side effects, and increased patient compliance. Furthermore, the increasing prevalence of chronic diseases like diabetes and cancer fuels demand for sophisticated drug delivery mechanisms that enable targeted therapies and personalized medicine. Favorable regulatory environments and increased healthcare spending also contribute significantly to market growth.
Obstacles in the Drug Delivery Devices Market
Regulatory hurdles, including stringent approval processes and varying regulations across different geographies, can impede market entry and expansion. Supply chain disruptions, particularly for specialized materials and components, can lead to production delays and increased costs. Intense competition among established players and emerging companies further poses challenges. These factors collectively impact the overall market growth, with an estimated xx% decrease in market expansion during periods of major supply chain disruptions.
Future Opportunities in Drug Delivery Devices Market
Emerging opportunities exist in developing personalized medicine solutions tailored to individual patient needs, as well as exploring new drug delivery routes like transdermal and pulmonary administration. The integration of digital technologies and smart sensors into drug delivery devices offers significant potential for remote patient monitoring and improved treatment outcomes. Expansion into untapped markets in developing countries also represents a major opportunity for growth.
Major Players in the Drug Delivery Devices Market Ecosystem
- Becton Dickinson and Company
- West Pharmaceutical Services Inc
- Holozymes Inc (Antares Pharma Inc)
- Merck KGaA
- Bayer AG
- Novartis AG
- Elcam Medical
- Biocorp
- F Hoffmann-La Roche Ltd
- Johnson and Johnson
- Teva Pharmaceutical Industries Ltd
- Molex (Philips Medisize)
- Altaris
- GlaxoSmithKline PLC
- Pfizer Inc
Key Developments in Drug Delivery Devices Market Industry
- June 2022: Gufic Biosciences Ltd launched Dual Chamber Bags, a new affordable drug delivery system in India. This significantly impacted the market by increasing accessibility to advanced drug delivery in a developing country.
- February 2022: Takeda received US FDA approval for TAKHZYRO (lanadelumab-flyo) injection in a prefilled syringe (PFS) for hereditary angioedema (HAE). This highlights the growing importance of convenient and user-friendly drug delivery solutions.
Strategic Drug Delivery Devices Market Forecast
The Drug Delivery Devices market is poised for continued growth driven by technological innovation, increasing prevalence of chronic diseases, and favorable regulatory environments. The focus on personalized medicine, smart drug delivery systems, and expansion into emerging markets will shape the industry's trajectory in the coming years. This robust growth is expected to continue through 2033, presenting significant opportunities for industry players and investors.
Drug Delivery Devices Market Segmentation
-
1. Route of Administration
- 1.1. Injectable
- 1.2. Topical
- 1.3. Ocular
- 1.4. Other Route of Administration
-
2. Application
- 2.1. Cancer
- 2.2. Cardiovascular
- 2.3. Diabetes
- 2.4. Infectious diseases
- 2.5. Other Applications
-
3. End User
- 3.1. Hospitals
- 3.2. Ambulatory Surgical Centers
- 3.3. Other End Users
Drug Delivery Devices Market Segmentation By Geography
-
1. North America
- 1.1. United States
- 1.2. Canada
- 1.3. Mexico
-
2. Europe
- 2.1. Germany
- 2.2. United Kingdom
- 2.3. France
- 2.4. Italy
- 2.5. Spain
- 2.6. Rest of Europe
-
3. Asia Pacific
- 3.1. China
- 3.2. Japan
- 3.3. India
- 3.4. Australia
- 3.5. South Korea
- 3.6. Rest of Asia Pacific
-
4. Middle East and Africa
- 4.1. GCC
- 4.2. South Africa
- 4.3. Rest of Middle East and Africa
-
5. South America
- 5.1. Brazil
- 5.2. Argentina
- 5.3. Rest of South America
Drug Delivery Devices Market REPORT HIGHLIGHTS
| Aspects | Details |
|---|---|
| Study Period | 2019-2033 |
| Base Year | 2024 |
| Estimated Year | 2025 |
| Forecast Period | 2025-2033 |
| Historical Period | 2019-2024 |
| Growth Rate | CAGR of 9.01% from 2019-2033 |
| Segmentation |
|
Table of Contents
- 1. Introduction
- 1.1. Research Scope
- 1.2. Market Segmentation
- 1.3. Research Methodology
- 1.4. Definitions and Assumptions
- 2. Executive Summary
- 2.1. Introduction
- 3. Market Dynamics
- 3.1. Introduction
- 3.2. Market Drivers
- 3.2.1. Rising Prevalence of Chronic Diseases; Technological Advancements; Growth in the Biologics Market
- 3.3. Market Restrains
- 3.3.1. Risk of Needlestick Injuries
- 3.4. Market Trends
- 3.4.1. Topical Drug Delivery Devices Segment is Estimated to Witness a Healthy Growth Over the Forecast Period
- 4. Market Factor Analysis
- 4.1. Porters Five Forces
- 4.2. Supply/Value Chain
- 4.3. PESTEL analysis
- 4.4. Market Entropy
- 4.5. Patent/Trademark Analysis
- 5. Global Drug Delivery Devices Market Analysis, Insights and Forecast, 2019-2031
- 5.1. Market Analysis, Insights and Forecast - by Route of Administration
- 5.1.1. Injectable
- 5.1.2. Topical
- 5.1.3. Ocular
- 5.1.4. Other Route of Administration
- 5.2. Market Analysis, Insights and Forecast - by Application
- 5.2.1. Cancer
- 5.2.2. Cardiovascular
- 5.2.3. Diabetes
- 5.2.4. Infectious diseases
- 5.2.5. Other Applications
- 5.3. Market Analysis, Insights and Forecast - by End User
- 5.3.1. Hospitals
- 5.3.2. Ambulatory Surgical Centers
- 5.3.3. Other End Users
- 5.4. Market Analysis, Insights and Forecast - by Region
- 5.4.1. North America
- 5.4.2. Europe
- 5.4.3. Asia Pacific
- 5.4.4. Middle East and Africa
- 5.4.5. South America
- 5.1. Market Analysis, Insights and Forecast - by Route of Administration
- 6. North America Drug Delivery Devices Market Analysis, Insights and Forecast, 2019-2031
- 6.1. Market Analysis, Insights and Forecast - by Route of Administration
- 6.1.1. Injectable
- 6.1.2. Topical
- 6.1.3. Ocular
- 6.1.4. Other Route of Administration
- 6.2. Market Analysis, Insights and Forecast - by Application
- 6.2.1. Cancer
- 6.2.2. Cardiovascular
- 6.2.3. Diabetes
- 6.2.4. Infectious diseases
- 6.2.5. Other Applications
- 6.3. Market Analysis, Insights and Forecast - by End User
- 6.3.1. Hospitals
- 6.3.2. Ambulatory Surgical Centers
- 6.3.3. Other End Users
- 6.1. Market Analysis, Insights and Forecast - by Route of Administration
- 7. Europe Drug Delivery Devices Market Analysis, Insights and Forecast, 2019-2031
- 7.1. Market Analysis, Insights and Forecast - by Route of Administration
- 7.1.1. Injectable
- 7.1.2. Topical
- 7.1.3. Ocular
- 7.1.4. Other Route of Administration
- 7.2. Market Analysis, Insights and Forecast - by Application
- 7.2.1. Cancer
- 7.2.2. Cardiovascular
- 7.2.3. Diabetes
- 7.2.4. Infectious diseases
- 7.2.5. Other Applications
- 7.3. Market Analysis, Insights and Forecast - by End User
- 7.3.1. Hospitals
- 7.3.2. Ambulatory Surgical Centers
- 7.3.3. Other End Users
- 7.1. Market Analysis, Insights and Forecast - by Route of Administration
- 8. Asia Pacific Drug Delivery Devices Market Analysis, Insights and Forecast, 2019-2031
- 8.1. Market Analysis, Insights and Forecast - by Route of Administration
- 8.1.1. Injectable
- 8.1.2. Topical
- 8.1.3. Ocular
- 8.1.4. Other Route of Administration
- 8.2. Market Analysis, Insights and Forecast - by Application
- 8.2.1. Cancer
- 8.2.2. Cardiovascular
- 8.2.3. Diabetes
- 8.2.4. Infectious diseases
- 8.2.5. Other Applications
- 8.3. Market Analysis, Insights and Forecast - by End User
- 8.3.1. Hospitals
- 8.3.2. Ambulatory Surgical Centers
- 8.3.3. Other End Users
- 8.1. Market Analysis, Insights and Forecast - by Route of Administration
- 9. Middle East and Africa Drug Delivery Devices Market Analysis, Insights and Forecast, 2019-2031
- 9.1. Market Analysis, Insights and Forecast - by Route of Administration
- 9.1.1. Injectable
- 9.1.2. Topical
- 9.1.3. Ocular
- 9.1.4. Other Route of Administration
- 9.2. Market Analysis, Insights and Forecast - by Application
- 9.2.1. Cancer
- 9.2.2. Cardiovascular
- 9.2.3. Diabetes
- 9.2.4. Infectious diseases
- 9.2.5. Other Applications
- 9.3. Market Analysis, Insights and Forecast - by End User
- 9.3.1. Hospitals
- 9.3.2. Ambulatory Surgical Centers
- 9.3.3. Other End Users
- 9.1. Market Analysis, Insights and Forecast - by Route of Administration
- 10. South America Drug Delivery Devices Market Analysis, Insights and Forecast, 2019-2031
- 10.1. Market Analysis, Insights and Forecast - by Route of Administration
- 10.1.1. Injectable
- 10.1.2. Topical
- 10.1.3. Ocular
- 10.1.4. Other Route of Administration
- 10.2. Market Analysis, Insights and Forecast - by Application
- 10.2.1. Cancer
- 10.2.2. Cardiovascular
- 10.2.3. Diabetes
- 10.2.4. Infectious diseases
- 10.2.5. Other Applications
- 10.3. Market Analysis, Insights and Forecast - by End User
- 10.3.1. Hospitals
- 10.3.2. Ambulatory Surgical Centers
- 10.3.3. Other End Users
- 10.1. Market Analysis, Insights and Forecast - by Route of Administration
- 11. North America Drug Delivery Devices Market Analysis, Insights and Forecast, 2019-2031
- 11.1. Market Analysis, Insights and Forecast - By Country/Sub-region
- 11.1.1 United States
- 11.1.2 Canada
- 11.1.3 Mexico
- 12. Europe Drug Delivery Devices Market Analysis, Insights and Forecast, 2019-2031
- 12.1. Market Analysis, Insights and Forecast - By Country/Sub-region
- 12.1.1 Germany
- 12.1.2 United Kingdom
- 12.1.3 France
- 12.1.4 Italy
- 12.1.5 Spain
- 12.1.6 Rest of Europe
- 13. Asia Pacific Drug Delivery Devices Market Analysis, Insights and Forecast, 2019-2031
- 13.1. Market Analysis, Insights and Forecast - By Country/Sub-region
- 13.1.1 China
- 13.1.2 Japan
- 13.1.3 India
- 13.1.4 Australia
- 13.1.5 South Korea
- 13.1.6 Rest of Asia Pacific
- 14. Middle East and Africa Drug Delivery Devices Market Analysis, Insights and Forecast, 2019-2031
- 14.1. Market Analysis, Insights and Forecast - By Country/Sub-region
- 14.1.1 GCC
- 14.1.2 South Africa
- 14.1.3 Rest of Middle East and Africa
- 15. South America Drug Delivery Devices Market Analysis, Insights and Forecast, 2019-2031
- 15.1. Market Analysis, Insights and Forecast - By Country/Sub-region
- 15.1.1 Brazil
- 15.1.2 Argentina
- 15.1.3 Rest of South America
- 16. Competitive Analysis
- 16.1. Global Market Share Analysis 2024
- 16.2. Company Profiles
- 16.2.1 Becton Dickinson and Company
- 16.2.1.1. Overview
- 16.2.1.2. Products
- 16.2.1.3. SWOT Analysis
- 16.2.1.4. Recent Developments
- 16.2.1.5. Financials (Based on Availability)
- 16.2.2 West Pharmaceutical Services Inc
- 16.2.2.1. Overview
- 16.2.2.2. Products
- 16.2.2.3. SWOT Analysis
- 16.2.2.4. Recent Developments
- 16.2.2.5. Financials (Based on Availability)
- 16.2.3 Holozymes Inc (Antares Pharma Inc )
- 16.2.3.1. Overview
- 16.2.3.2. Products
- 16.2.3.3. SWOT Analysis
- 16.2.3.4. Recent Developments
- 16.2.3.5. Financials (Based on Availability)
- 16.2.4 Merck KGaA
- 16.2.4.1. Overview
- 16.2.4.2. Products
- 16.2.4.3. SWOT Analysis
- 16.2.4.4. Recent Developments
- 16.2.4.5. Financials (Based on Availability)
- 16.2.5 Bayer AG
- 16.2.5.1. Overview
- 16.2.5.2. Products
- 16.2.5.3. SWOT Analysis
- 16.2.5.4. Recent Developments
- 16.2.5.5. Financials (Based on Availability)
- 16.2.6 Novartis AG
- 16.2.6.1. Overview
- 16.2.6.2. Products
- 16.2.6.3. SWOT Analysis
- 16.2.6.4. Recent Developments
- 16.2.6.5. Financials (Based on Availability)
- 16.2.7 Elcam Medical
- 16.2.7.1. Overview
- 16.2.7.2. Products
- 16.2.7.3. SWOT Analysis
- 16.2.7.4. Recent Developments
- 16.2.7.5. Financials (Based on Availability)
- 16.2.8 Biocorp
- 16.2.8.1. Overview
- 16.2.8.2. Products
- 16.2.8.3. SWOT Analysis
- 16.2.8.4. Recent Developments
- 16.2.8.5. Financials (Based on Availability)
- 16.2.9 F Hoffmann-La Roche Ltd
- 16.2.9.1. Overview
- 16.2.9.2. Products
- 16.2.9.3. SWOT Analysis
- 16.2.9.4. Recent Developments
- 16.2.9.5. Financials (Based on Availability)
- 16.2.10 Johnson and Johnson
- 16.2.10.1. Overview
- 16.2.10.2. Products
- 16.2.10.3. SWOT Analysis
- 16.2.10.4. Recent Developments
- 16.2.10.5. Financials (Based on Availability)
- 16.2.11 Teva Pharmaceutical Industries Ltd
- 16.2.11.1. Overview
- 16.2.11.2. Products
- 16.2.11.3. SWOT Analysis
- 16.2.11.4. Recent Developments
- 16.2.11.5. Financials (Based on Availability)
- 16.2.12 Molex (Philips Medisize)
- 16.2.12.1. Overview
- 16.2.12.2. Products
- 16.2.12.3. SWOT Analysis
- 16.2.12.4. Recent Developments
- 16.2.12.5. Financials (Based on Availability)
- 16.2.13 Altaris
- 16.2.13.1. Overview
- 16.2.13.2. Products
- 16.2.13.3. SWOT Analysis
- 16.2.13.4. Recent Developments
- 16.2.13.5. Financials (Based on Availability)
- 16.2.14 GlaxoSmithKline PLC
- 16.2.14.1. Overview
- 16.2.14.2. Products
- 16.2.14.3. SWOT Analysis
- 16.2.14.4. Recent Developments
- 16.2.14.5. Financials (Based on Availability)
- 16.2.15 Pfizer Inc
- 16.2.15.1. Overview
- 16.2.15.2. Products
- 16.2.15.3. SWOT Analysis
- 16.2.15.4. Recent Developments
- 16.2.15.5. Financials (Based on Availability)
- 16.2.1 Becton Dickinson and Company
List of Figures
- Figure 1: Global Drug Delivery Devices Market Revenue Breakdown (Million, %) by Region 2024 & 2032
- Figure 2: Global Drug Delivery Devices Market Volume Breakdown (K Unit, %) by Region 2024 & 2032
- Figure 3: North America Drug Delivery Devices Market Revenue (Million), by Country 2024 & 2032
- Figure 4: North America Drug Delivery Devices Market Volume (K Unit), by Country 2024 & 2032
- Figure 5: North America Drug Delivery Devices Market Revenue Share (%), by Country 2024 & 2032
- Figure 6: North America Drug Delivery Devices Market Volume Share (%), by Country 2024 & 2032
- Figure 7: Europe Drug Delivery Devices Market Revenue (Million), by Country 2024 & 2032
- Figure 8: Europe Drug Delivery Devices Market Volume (K Unit), by Country 2024 & 2032
- Figure 9: Europe Drug Delivery Devices Market Revenue Share (%), by Country 2024 & 2032
- Figure 10: Europe Drug Delivery Devices Market Volume Share (%), by Country 2024 & 2032
- Figure 11: Asia Pacific Drug Delivery Devices Market Revenue (Million), by Country 2024 & 2032
- Figure 12: Asia Pacific Drug Delivery Devices Market Volume (K Unit), by Country 2024 & 2032
- Figure 13: Asia Pacific Drug Delivery Devices Market Revenue Share (%), by Country 2024 & 2032
- Figure 14: Asia Pacific Drug Delivery Devices Market Volume Share (%), by Country 2024 & 2032
- Figure 15: Middle East and Africa Drug Delivery Devices Market Revenue (Million), by Country 2024 & 2032
- Figure 16: Middle East and Africa Drug Delivery Devices Market Volume (K Unit), by Country 2024 & 2032
- Figure 17: Middle East and Africa Drug Delivery Devices Market Revenue Share (%), by Country 2024 & 2032
- Figure 18: Middle East and Africa Drug Delivery Devices Market Volume Share (%), by Country 2024 & 2032
- Figure 19: South America Drug Delivery Devices Market Revenue (Million), by Country 2024 & 2032
- Figure 20: South America Drug Delivery Devices Market Volume (K Unit), by Country 2024 & 2032
- Figure 21: South America Drug Delivery Devices Market Revenue Share (%), by Country 2024 & 2032
- Figure 22: South America Drug Delivery Devices Market Volume Share (%), by Country 2024 & 2032
- Figure 23: North America Drug Delivery Devices Market Revenue (Million), by Route of Administration 2024 & 2032
- Figure 24: North America Drug Delivery Devices Market Volume (K Unit), by Route of Administration 2024 & 2032
- Figure 25: North America Drug Delivery Devices Market Revenue Share (%), by Route of Administration 2024 & 2032
- Figure 26: North America Drug Delivery Devices Market Volume Share (%), by Route of Administration 2024 & 2032
- Figure 27: North America Drug Delivery Devices Market Revenue (Million), by Application 2024 & 2032
- Figure 28: North America Drug Delivery Devices Market Volume (K Unit), by Application 2024 & 2032
- Figure 29: North America Drug Delivery Devices Market Revenue Share (%), by Application 2024 & 2032
- Figure 30: North America Drug Delivery Devices Market Volume Share (%), by Application 2024 & 2032
- Figure 31: North America Drug Delivery Devices Market Revenue (Million), by End User 2024 & 2032
- Figure 32: North America Drug Delivery Devices Market Volume (K Unit), by End User 2024 & 2032
- Figure 33: North America Drug Delivery Devices Market Revenue Share (%), by End User 2024 & 2032
- Figure 34: North America Drug Delivery Devices Market Volume Share (%), by End User 2024 & 2032
- Figure 35: North America Drug Delivery Devices Market Revenue (Million), by Country 2024 & 2032
- Figure 36: North America Drug Delivery Devices Market Volume (K Unit), by Country 2024 & 2032
- Figure 37: North America Drug Delivery Devices Market Revenue Share (%), by Country 2024 & 2032
- Figure 38: North America Drug Delivery Devices Market Volume Share (%), by Country 2024 & 2032
- Figure 39: Europe Drug Delivery Devices Market Revenue (Million), by Route of Administration 2024 & 2032
- Figure 40: Europe Drug Delivery Devices Market Volume (K Unit), by Route of Administration 2024 & 2032
- Figure 41: Europe Drug Delivery Devices Market Revenue Share (%), by Route of Administration 2024 & 2032
- Figure 42: Europe Drug Delivery Devices Market Volume Share (%), by Route of Administration 2024 & 2032
- Figure 43: Europe Drug Delivery Devices Market Revenue (Million), by Application 2024 & 2032
- Figure 44: Europe Drug Delivery Devices Market Volume (K Unit), by Application 2024 & 2032
- Figure 45: Europe Drug Delivery Devices Market Revenue Share (%), by Application 2024 & 2032
- Figure 46: Europe Drug Delivery Devices Market Volume Share (%), by Application 2024 & 2032
- Figure 47: Europe Drug Delivery Devices Market Revenue (Million), by End User 2024 & 2032
- Figure 48: Europe Drug Delivery Devices Market Volume (K Unit), by End User 2024 & 2032
- Figure 49: Europe Drug Delivery Devices Market Revenue Share (%), by End User 2024 & 2032
- Figure 50: Europe Drug Delivery Devices Market Volume Share (%), by End User 2024 & 2032
- Figure 51: Europe Drug Delivery Devices Market Revenue (Million), by Country 2024 & 2032
- Figure 52: Europe Drug Delivery Devices Market Volume (K Unit), by Country 2024 & 2032
- Figure 53: Europe Drug Delivery Devices Market Revenue Share (%), by Country 2024 & 2032
- Figure 54: Europe Drug Delivery Devices Market Volume Share (%), by Country 2024 & 2032
- Figure 55: Asia Pacific Drug Delivery Devices Market Revenue (Million), by Route of Administration 2024 & 2032
- Figure 56: Asia Pacific Drug Delivery Devices Market Volume (K Unit), by Route of Administration 2024 & 2032
- Figure 57: Asia Pacific Drug Delivery Devices Market Revenue Share (%), by Route of Administration 2024 & 2032
- Figure 58: Asia Pacific Drug Delivery Devices Market Volume Share (%), by Route of Administration 2024 & 2032
- Figure 59: Asia Pacific Drug Delivery Devices Market Revenue (Million), by Application 2024 & 2032
- Figure 60: Asia Pacific Drug Delivery Devices Market Volume (K Unit), by Application 2024 & 2032
- Figure 61: Asia Pacific Drug Delivery Devices Market Revenue Share (%), by Application 2024 & 2032
- Figure 62: Asia Pacific Drug Delivery Devices Market Volume Share (%), by Application 2024 & 2032
- Figure 63: Asia Pacific Drug Delivery Devices Market Revenue (Million), by End User 2024 & 2032
- Figure 64: Asia Pacific Drug Delivery Devices Market Volume (K Unit), by End User 2024 & 2032
- Figure 65: Asia Pacific Drug Delivery Devices Market Revenue Share (%), by End User 2024 & 2032
- Figure 66: Asia Pacific Drug Delivery Devices Market Volume Share (%), by End User 2024 & 2032
- Figure 67: Asia Pacific Drug Delivery Devices Market Revenue (Million), by Country 2024 & 2032
- Figure 68: Asia Pacific Drug Delivery Devices Market Volume (K Unit), by Country 2024 & 2032
- Figure 69: Asia Pacific Drug Delivery Devices Market Revenue Share (%), by Country 2024 & 2032
- Figure 70: Asia Pacific Drug Delivery Devices Market Volume Share (%), by Country 2024 & 2032
- Figure 71: Middle East and Africa Drug Delivery Devices Market Revenue (Million), by Route of Administration 2024 & 2032
- Figure 72: Middle East and Africa Drug Delivery Devices Market Volume (K Unit), by Route of Administration 2024 & 2032
- Figure 73: Middle East and Africa Drug Delivery Devices Market Revenue Share (%), by Route of Administration 2024 & 2032
- Figure 74: Middle East and Africa Drug Delivery Devices Market Volume Share (%), by Route of Administration 2024 & 2032
- Figure 75: Middle East and Africa Drug Delivery Devices Market Revenue (Million), by Application 2024 & 2032
- Figure 76: Middle East and Africa Drug Delivery Devices Market Volume (K Unit), by Application 2024 & 2032
- Figure 77: Middle East and Africa Drug Delivery Devices Market Revenue Share (%), by Application 2024 & 2032
- Figure 78: Middle East and Africa Drug Delivery Devices Market Volume Share (%), by Application 2024 & 2032
- Figure 79: Middle East and Africa Drug Delivery Devices Market Revenue (Million), by End User 2024 & 2032
- Figure 80: Middle East and Africa Drug Delivery Devices Market Volume (K Unit), by End User 2024 & 2032
- Figure 81: Middle East and Africa Drug Delivery Devices Market Revenue Share (%), by End User 2024 & 2032
- Figure 82: Middle East and Africa Drug Delivery Devices Market Volume Share (%), by End User 2024 & 2032
- Figure 83: Middle East and Africa Drug Delivery Devices Market Revenue (Million), by Country 2024 & 2032
- Figure 84: Middle East and Africa Drug Delivery Devices Market Volume (K Unit), by Country 2024 & 2032
- Figure 85: Middle East and Africa Drug Delivery Devices Market Revenue Share (%), by Country 2024 & 2032
- Figure 86: Middle East and Africa Drug Delivery Devices Market Volume Share (%), by Country 2024 & 2032
- Figure 87: South America Drug Delivery Devices Market Revenue (Million), by Route of Administration 2024 & 2032
- Figure 88: South America Drug Delivery Devices Market Volume (K Unit), by Route of Administration 2024 & 2032
- Figure 89: South America Drug Delivery Devices Market Revenue Share (%), by Route of Administration 2024 & 2032
- Figure 90: South America Drug Delivery Devices Market Volume Share (%), by Route of Administration 2024 & 2032
- Figure 91: South America Drug Delivery Devices Market Revenue (Million), by Application 2024 & 2032
- Figure 92: South America Drug Delivery Devices Market Volume (K Unit), by Application 2024 & 2032
- Figure 93: South America Drug Delivery Devices Market Revenue Share (%), by Application 2024 & 2032
- Figure 94: South America Drug Delivery Devices Market Volume Share (%), by Application 2024 & 2032
- Figure 95: South America Drug Delivery Devices Market Revenue (Million), by End User 2024 & 2032
- Figure 96: South America Drug Delivery Devices Market Volume (K Unit), by End User 2024 & 2032
- Figure 97: South America Drug Delivery Devices Market Revenue Share (%), by End User 2024 & 2032
- Figure 98: South America Drug Delivery Devices Market Volume Share (%), by End User 2024 & 2032
- Figure 99: South America Drug Delivery Devices Market Revenue (Million), by Country 2024 & 2032
- Figure 100: South America Drug Delivery Devices Market Volume (K Unit), by Country 2024 & 2032
- Figure 101: South America Drug Delivery Devices Market Revenue Share (%), by Country 2024 & 2032
- Figure 102: South America Drug Delivery Devices Market Volume Share (%), by Country 2024 & 2032
List of Tables
- Table 1: Global Drug Delivery Devices Market Revenue Million Forecast, by Region 2019 & 2032
- Table 2: Global Drug Delivery Devices Market Volume K Unit Forecast, by Region 2019 & 2032
- Table 3: Global Drug Delivery Devices Market Revenue Million Forecast, by Route of Administration 2019 & 2032
- Table 4: Global Drug Delivery Devices Market Volume K Unit Forecast, by Route of Administration 2019 & 2032
- Table 5: Global Drug Delivery Devices Market Revenue Million Forecast, by Application 2019 & 2032
- Table 6: Global Drug Delivery Devices Market Volume K Unit Forecast, by Application 2019 & 2032
- Table 7: Global Drug Delivery Devices Market Revenue Million Forecast, by End User 2019 & 2032
- Table 8: Global Drug Delivery Devices Market Volume K Unit Forecast, by End User 2019 & 2032
- Table 9: Global Drug Delivery Devices Market Revenue Million Forecast, by Region 2019 & 2032
- Table 10: Global Drug Delivery Devices Market Volume K Unit Forecast, by Region 2019 & 2032
- Table 11: Global Drug Delivery Devices Market Revenue Million Forecast, by Country 2019 & 2032
- Table 12: Global Drug Delivery Devices Market Volume K Unit Forecast, by Country 2019 & 2032
- Table 13: United States Drug Delivery Devices Market Revenue (Million) Forecast, by Application 2019 & 2032
- Table 14: United States Drug Delivery Devices Market Volume (K Unit) Forecast, by Application 2019 & 2032
- Table 15: Canada Drug Delivery Devices Market Revenue (Million) Forecast, by Application 2019 & 2032
- Table 16: Canada Drug Delivery Devices Market Volume (K Unit) Forecast, by Application 2019 & 2032
- Table 17: Mexico Drug Delivery Devices Market Revenue (Million) Forecast, by Application 2019 & 2032
- Table 18: Mexico Drug Delivery Devices Market Volume (K Unit) Forecast, by Application 2019 & 2032
- Table 19: Global Drug Delivery Devices Market Revenue Million Forecast, by Country 2019 & 2032
- Table 20: Global Drug Delivery Devices Market Volume K Unit Forecast, by Country 2019 & 2032
- Table 21: Germany Drug Delivery Devices Market Revenue (Million) Forecast, by Application 2019 & 2032
- Table 22: Germany Drug Delivery Devices Market Volume (K Unit) Forecast, by Application 2019 & 2032
- Table 23: United Kingdom Drug Delivery Devices Market Revenue (Million) Forecast, by Application 2019 & 2032
- Table 24: United Kingdom Drug Delivery Devices Market Volume (K Unit) Forecast, by Application 2019 & 2032
- Table 25: France Drug Delivery Devices Market Revenue (Million) Forecast, by Application 2019 & 2032
- Table 26: France Drug Delivery Devices Market Volume (K Unit) Forecast, by Application 2019 & 2032
- Table 27: Italy Drug Delivery Devices Market Revenue (Million) Forecast, by Application 2019 & 2032
- Table 28: Italy Drug Delivery Devices Market Volume (K Unit) Forecast, by Application 2019 & 2032
- Table 29: Spain Drug Delivery Devices Market Revenue (Million) Forecast, by Application 2019 & 2032
- Table 30: Spain Drug Delivery Devices Market Volume (K Unit) Forecast, by Application 2019 & 2032
- Table 31: Rest of Europe Drug Delivery Devices Market Revenue (Million) Forecast, by Application 2019 & 2032
- Table 32: Rest of Europe Drug Delivery Devices Market Volume (K Unit) Forecast, by Application 2019 & 2032
- Table 33: Global Drug Delivery Devices Market Revenue Million Forecast, by Country 2019 & 2032
- Table 34: Global Drug Delivery Devices Market Volume K Unit Forecast, by Country 2019 & 2032
- Table 35: China Drug Delivery Devices Market Revenue (Million) Forecast, by Application 2019 & 2032
- Table 36: China Drug Delivery Devices Market Volume (K Unit) Forecast, by Application 2019 & 2032
- Table 37: Japan Drug Delivery Devices Market Revenue (Million) Forecast, by Application 2019 & 2032
- Table 38: Japan Drug Delivery Devices Market Volume (K Unit) Forecast, by Application 2019 & 2032
- Table 39: India Drug Delivery Devices Market Revenue (Million) Forecast, by Application 2019 & 2032
- Table 40: India Drug Delivery Devices Market Volume (K Unit) Forecast, by Application 2019 & 2032
- Table 41: Australia Drug Delivery Devices Market Revenue (Million) Forecast, by Application 2019 & 2032
- Table 42: Australia Drug Delivery Devices Market Volume (K Unit) Forecast, by Application 2019 & 2032
- Table 43: South Korea Drug Delivery Devices Market Revenue (Million) Forecast, by Application 2019 & 2032
- Table 44: South Korea Drug Delivery Devices Market Volume (K Unit) Forecast, by Application 2019 & 2032
- Table 45: Rest of Asia Pacific Drug Delivery Devices Market Revenue (Million) Forecast, by Application 2019 & 2032
- Table 46: Rest of Asia Pacific Drug Delivery Devices Market Volume (K Unit) Forecast, by Application 2019 & 2032
- Table 47: Global Drug Delivery Devices Market Revenue Million Forecast, by Country 2019 & 2032
- Table 48: Global Drug Delivery Devices Market Volume K Unit Forecast, by Country 2019 & 2032
- Table 49: GCC Drug Delivery Devices Market Revenue (Million) Forecast, by Application 2019 & 2032
- Table 50: GCC Drug Delivery Devices Market Volume (K Unit) Forecast, by Application 2019 & 2032
- Table 51: South Africa Drug Delivery Devices Market Revenue (Million) Forecast, by Application 2019 & 2032
- Table 52: South Africa Drug Delivery Devices Market Volume (K Unit) Forecast, by Application 2019 & 2032
- Table 53: Rest of Middle East and Africa Drug Delivery Devices Market Revenue (Million) Forecast, by Application 2019 & 2032
- Table 54: Rest of Middle East and Africa Drug Delivery Devices Market Volume (K Unit) Forecast, by Application 2019 & 2032
- Table 55: Global Drug Delivery Devices Market Revenue Million Forecast, by Country 2019 & 2032
- Table 56: Global Drug Delivery Devices Market Volume K Unit Forecast, by Country 2019 & 2032
- Table 57: Brazil Drug Delivery Devices Market Revenue (Million) Forecast, by Application 2019 & 2032
- Table 58: Brazil Drug Delivery Devices Market Volume (K Unit) Forecast, by Application 2019 & 2032
- Table 59: Argentina Drug Delivery Devices Market Revenue (Million) Forecast, by Application 2019 & 2032
- Table 60: Argentina Drug Delivery Devices Market Volume (K Unit) Forecast, by Application 2019 & 2032
- Table 61: Rest of South America Drug Delivery Devices Market Revenue (Million) Forecast, by Application 2019 & 2032
- Table 62: Rest of South America Drug Delivery Devices Market Volume (K Unit) Forecast, by Application 2019 & 2032
- Table 63: Global Drug Delivery Devices Market Revenue Million Forecast, by Route of Administration 2019 & 2032
- Table 64: Global Drug Delivery Devices Market Volume K Unit Forecast, by Route of Administration 2019 & 2032
- Table 65: Global Drug Delivery Devices Market Revenue Million Forecast, by Application 2019 & 2032
- Table 66: Global Drug Delivery Devices Market Volume K Unit Forecast, by Application 2019 & 2032
- Table 67: Global Drug Delivery Devices Market Revenue Million Forecast, by End User 2019 & 2032
- Table 68: Global Drug Delivery Devices Market Volume K Unit Forecast, by End User 2019 & 2032
- Table 69: Global Drug Delivery Devices Market Revenue Million Forecast, by Country 2019 & 2032
- Table 70: Global Drug Delivery Devices Market Volume K Unit Forecast, by Country 2019 & 2032
- Table 71: United States Drug Delivery Devices Market Revenue (Million) Forecast, by Application 2019 & 2032
- Table 72: United States Drug Delivery Devices Market Volume (K Unit) Forecast, by Application 2019 & 2032
- Table 73: Canada Drug Delivery Devices Market Revenue (Million) Forecast, by Application 2019 & 2032
- Table 74: Canada Drug Delivery Devices Market Volume (K Unit) Forecast, by Application 2019 & 2032
- Table 75: Mexico Drug Delivery Devices Market Revenue (Million) Forecast, by Application 2019 & 2032
- Table 76: Mexico Drug Delivery Devices Market Volume (K Unit) Forecast, by Application 2019 & 2032
- Table 77: Global Drug Delivery Devices Market Revenue Million Forecast, by Route of Administration 2019 & 2032
- Table 78: Global Drug Delivery Devices Market Volume K Unit Forecast, by Route of Administration 2019 & 2032
- Table 79: Global Drug Delivery Devices Market Revenue Million Forecast, by Application 2019 & 2032
- Table 80: Global Drug Delivery Devices Market Volume K Unit Forecast, by Application 2019 & 2032
- Table 81: Global Drug Delivery Devices Market Revenue Million Forecast, by End User 2019 & 2032
- Table 82: Global Drug Delivery Devices Market Volume K Unit Forecast, by End User 2019 & 2032
- Table 83: Global Drug Delivery Devices Market Revenue Million Forecast, by Country 2019 & 2032
- Table 84: Global Drug Delivery Devices Market Volume K Unit Forecast, by Country 2019 & 2032
- Table 85: Germany Drug Delivery Devices Market Revenue (Million) Forecast, by Application 2019 & 2032
- Table 86: Germany Drug Delivery Devices Market Volume (K Unit) Forecast, by Application 2019 & 2032
- Table 87: United Kingdom Drug Delivery Devices Market Revenue (Million) Forecast, by Application 2019 & 2032
- Table 88: United Kingdom Drug Delivery Devices Market Volume (K Unit) Forecast, by Application 2019 & 2032
- Table 89: France Drug Delivery Devices Market Revenue (Million) Forecast, by Application 2019 & 2032
- Table 90: France Drug Delivery Devices Market Volume (K Unit) Forecast, by Application 2019 & 2032
- Table 91: Italy Drug Delivery Devices Market Revenue (Million) Forecast, by Application 2019 & 2032
- Table 92: Italy Drug Delivery Devices Market Volume (K Unit) Forecast, by Application 2019 & 2032
- Table 93: Spain Drug Delivery Devices Market Revenue (Million) Forecast, by Application 2019 & 2032
- Table 94: Spain Drug Delivery Devices Market Volume (K Unit) Forecast, by Application 2019 & 2032
- Table 95: Rest of Europe Drug Delivery Devices Market Revenue (Million) Forecast, by Application 2019 & 2032
- Table 96: Rest of Europe Drug Delivery Devices Market Volume (K Unit) Forecast, by Application 2019 & 2032
- Table 97: Global Drug Delivery Devices Market Revenue Million Forecast, by Route of Administration 2019 & 2032
- Table 98: Global Drug Delivery Devices Market Volume K Unit Forecast, by Route of Administration 2019 & 2032
- Table 99: Global Drug Delivery Devices Market Revenue Million Forecast, by Application 2019 & 2032
- Table 100: Global Drug Delivery Devices Market Volume K Unit Forecast, by Application 2019 & 2032
- Table 101: Global Drug Delivery Devices Market Revenue Million Forecast, by End User 2019 & 2032
- Table 102: Global Drug Delivery Devices Market Volume K Unit Forecast, by End User 2019 & 2032
- Table 103: Global Drug Delivery Devices Market Revenue Million Forecast, by Country 2019 & 2032
- Table 104: Global Drug Delivery Devices Market Volume K Unit Forecast, by Country 2019 & 2032
- Table 105: China Drug Delivery Devices Market Revenue (Million) Forecast, by Application 2019 & 2032
- Table 106: China Drug Delivery Devices Market Volume (K Unit) Forecast, by Application 2019 & 2032
- Table 107: Japan Drug Delivery Devices Market Revenue (Million) Forecast, by Application 2019 & 2032
- Table 108: Japan Drug Delivery Devices Market Volume (K Unit) Forecast, by Application 2019 & 2032
- Table 109: India Drug Delivery Devices Market Revenue (Million) Forecast, by Application 2019 & 2032
- Table 110: India Drug Delivery Devices Market Volume (K Unit) Forecast, by Application 2019 & 2032
- Table 111: Australia Drug Delivery Devices Market Revenue (Million) Forecast, by Application 2019 & 2032
- Table 112: Australia Drug Delivery Devices Market Volume (K Unit) Forecast, by Application 2019 & 2032
- Table 113: South Korea Drug Delivery Devices Market Revenue (Million) Forecast, by Application 2019 & 2032
- Table 114: South Korea Drug Delivery Devices Market Volume (K Unit) Forecast, by Application 2019 & 2032
- Table 115: Rest of Asia Pacific Drug Delivery Devices Market Revenue (Million) Forecast, by Application 2019 & 2032
- Table 116: Rest of Asia Pacific Drug Delivery Devices Market Volume (K Unit) Forecast, by Application 2019 & 2032
- Table 117: Global Drug Delivery Devices Market Revenue Million Forecast, by Route of Administration 2019 & 2032
- Table 118: Global Drug Delivery Devices Market Volume K Unit Forecast, by Route of Administration 2019 & 2032
- Table 119: Global Drug Delivery Devices Market Revenue Million Forecast, by Application 2019 & 2032
- Table 120: Global Drug Delivery Devices Market Volume K Unit Forecast, by Application 2019 & 2032
- Table 121: Global Drug Delivery Devices Market Revenue Million Forecast, by End User 2019 & 2032
- Table 122: Global Drug Delivery Devices Market Volume K Unit Forecast, by End User 2019 & 2032
- Table 123: Global Drug Delivery Devices Market Revenue Million Forecast, by Country 2019 & 2032
- Table 124: Global Drug Delivery Devices Market Volume K Unit Forecast, by Country 2019 & 2032
- Table 125: GCC Drug Delivery Devices Market Revenue (Million) Forecast, by Application 2019 & 2032
- Table 126: GCC Drug Delivery Devices Market Volume (K Unit) Forecast, by Application 2019 & 2032
- Table 127: South Africa Drug Delivery Devices Market Revenue (Million) Forecast, by Application 2019 & 2032
- Table 128: South Africa Drug Delivery Devices Market Volume (K Unit) Forecast, by Application 2019 & 2032
- Table 129: Rest of Middle East and Africa Drug Delivery Devices Market Revenue (Million) Forecast, by Application 2019 & 2032
- Table 130: Rest of Middle East and Africa Drug Delivery Devices Market Volume (K Unit) Forecast, by Application 2019 & 2032
- Table 131: Global Drug Delivery Devices Market Revenue Million Forecast, by Route of Administration 2019 & 2032
- Table 132: Global Drug Delivery Devices Market Volume K Unit Forecast, by Route of Administration 2019 & 2032
- Table 133: Global Drug Delivery Devices Market Revenue Million Forecast, by Application 2019 & 2032
- Table 134: Global Drug Delivery Devices Market Volume K Unit Forecast, by Application 2019 & 2032
- Table 135: Global Drug Delivery Devices Market Revenue Million Forecast, by End User 2019 & 2032
- Table 136: Global Drug Delivery Devices Market Volume K Unit Forecast, by End User 2019 & 2032
- Table 137: Global Drug Delivery Devices Market Revenue Million Forecast, by Country 2019 & 2032
- Table 138: Global Drug Delivery Devices Market Volume K Unit Forecast, by Country 2019 & 2032
- Table 139: Brazil Drug Delivery Devices Market Revenue (Million) Forecast, by Application 2019 & 2032
- Table 140: Brazil Drug Delivery Devices Market Volume (K Unit) Forecast, by Application 2019 & 2032
- Table 141: Argentina Drug Delivery Devices Market Revenue (Million) Forecast, by Application 2019 & 2032
- Table 142: Argentina Drug Delivery Devices Market Volume (K Unit) Forecast, by Application 2019 & 2032
- Table 143: Rest of South America Drug Delivery Devices Market Revenue (Million) Forecast, by Application 2019 & 2032
- Table 144: Rest of South America Drug Delivery Devices Market Volume (K Unit) Forecast, by Application 2019 & 2032
Frequently Asked Questions
1. What is the projected Compound Annual Growth Rate (CAGR) of the Drug Delivery Devices Market?
The projected CAGR is approximately 9.01%.
2. Which companies are prominent players in the Drug Delivery Devices Market?
Key companies in the market include Becton Dickinson and Company, West Pharmaceutical Services Inc, Holozymes Inc (Antares Pharma Inc ), Merck KGaA, Bayer AG, Novartis AG, Elcam Medical, Biocorp, F Hoffmann-La Roche Ltd, Johnson and Johnson, Teva Pharmaceutical Industries Ltd, Molex (Philips Medisize), Altaris, GlaxoSmithKline PLC, Pfizer Inc.
3. What are the main segments of the Drug Delivery Devices Market?
The market segments include Route of Administration, Application, End User.
4. Can you provide details about the market size?
The market size is estimated to be USD 191.79 Million as of 2022.
5. What are some drivers contributing to market growth?
Rising Prevalence of Chronic Diseases; Technological Advancements; Growth in the Biologics Market.
6. What are the notable trends driving market growth?
Topical Drug Delivery Devices Segment is Estimated to Witness a Healthy Growth Over the Forecast Period.
7. Are there any restraints impacting market growth?
Risk of Needlestick Injuries.
8. Can you provide examples of recent developments in the market?
June 2022: Gufic Biosciences Ltd launched a new drug delivery system, Dual Chamber Bags, at affordable prices for the first time in India.
9. What pricing options are available for accessing the report?
Pricing options include single-user, multi-user, and enterprise licenses priced at USD 4750, USD 5250, and USD 8750 respectively.
10. Is the market size provided in terms of value or volume?
The market size is provided in terms of value, measured in Million and volume, measured in K Unit.
11. Are there any specific market keywords associated with the report?
Yes, the market keyword associated with the report is "Drug Delivery Devices Market," which aids in identifying and referencing the specific market segment covered.
12. How do I determine which pricing option suits my needs best?
The pricing options vary based on user requirements and access needs. Individual users may opt for single-user licenses, while businesses requiring broader access may choose multi-user or enterprise licenses for cost-effective access to the report.
13. Are there any additional resources or data provided in the Drug Delivery Devices Market report?
While the report offers comprehensive insights, it's advisable to review the specific contents or supplementary materials provided to ascertain if additional resources or data are available.
14. How can I stay updated on further developments or reports in the Drug Delivery Devices Market?
To stay informed about further developments, trends, and reports in the Drug Delivery Devices Market, consider subscribing to industry newsletters, following relevant companies and organizations, or regularly checking reputable industry news sources and publications.
Methodology
Step 1 - Identification of Relevant Samples Size from Population Database


Step 2 - Approaches for Defining Global Market Size (Value, Volume* & Price*)

Note*: In applicable scenarios
Step 3 - Data Sources
Primary Research
- Web Analytics
- Survey Reports
- Research Institute
- Latest Research Reports
- Opinion Leaders
Secondary Research
- Annual Reports
- White Paper
- Latest Press Release
- Industry Association
- Paid Database
- Investor Presentations

Step 4 - Data Triangulation
Involves using different sources of information in order to increase the validity of a study
These sources are likely to be stakeholders in a program - participants, other researchers, program staff, other community members, and so on.
Then we put all data in single framework & apply various statistical tools to find out the dynamic on the market.
During the analysis stage, feedback from the stakeholder groups would be compared to determine areas of agreement as well as areas of divergence
