

Key Insights
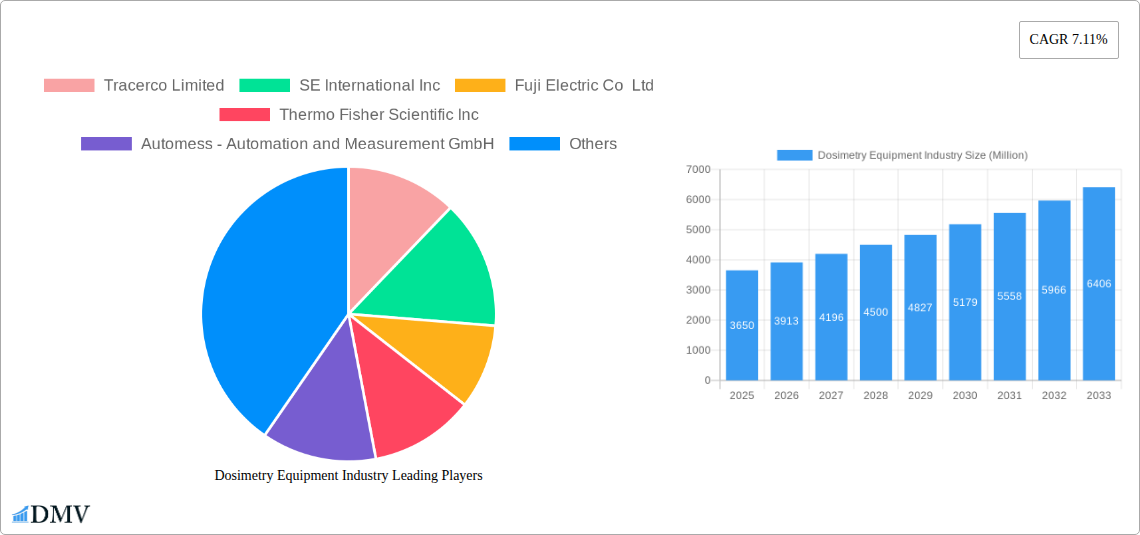
The global dosimetry equipment market, valued at $3.65 billion in 2025, is projected to experience robust growth, exhibiting a Compound Annual Growth Rate (CAGR) of 7.11% from 2025 to 2033. This expansion is driven by several key factors. The increasing prevalence of radiation-related industries, particularly healthcare (with advancements in radiation therapy and nuclear medicine), oil and gas exploration (requiring stringent radiation safety protocols), and manufacturing (utilizing radiation-based processes), fuels the demand for accurate and reliable dosimetry equipment. Furthermore, stringent government regulations regarding radiation safety and worker protection across numerous sectors are mandating the adoption of advanced dosimetry technologies. The market is witnessing a shift towards sophisticated dosimeters like Optically Stimulated Luminescence Dosimeters (OSLs) due to their higher accuracy and ease of use compared to traditional film badge dosimeters. Technological advancements in dosimeter design, miniaturization, and data management capabilities are further enhancing market appeal.
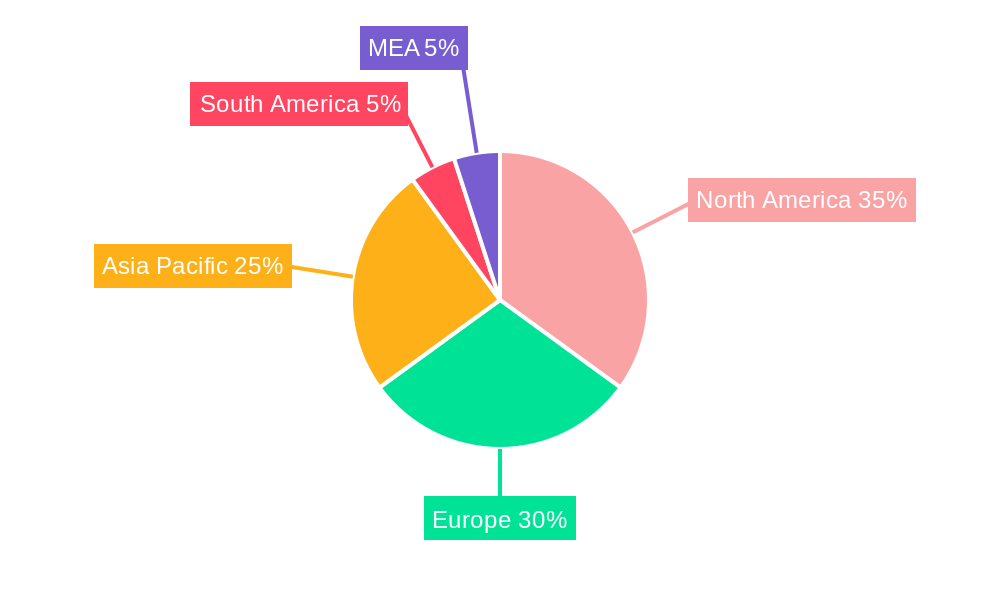
Growth is further segmented by geographic region, with North America and Europe currently holding significant market share due to established regulatory frameworks and a higher concentration of radiation-related industries. However, the Asia-Pacific region is expected to witness substantial growth in the coming years, driven by increasing industrialization and rising healthcare infrastructure investments. The competitive landscape is characterized by a mix of established players and emerging companies offering a wide range of dosimetry equipment, fostering innovation and competition. Challenges remain, however, including the relatively high cost of advanced dosimetry systems and the need for continuous calibration and maintenance, which may slightly constrain overall market growth in certain segments. Nevertheless, the long-term outlook for the dosimetry equipment market remains exceptionally positive, driven by consistent technological progress, regulatory mandates, and expanding application areas.
Dosimetry Equipment Industry Market Report: 2019-2033
This comprehensive report provides a detailed analysis of the Dosimetry Equipment industry, projecting a market value exceeding xx Million by 2033. The report covers the historical period (2019-2024), base year (2025), and forecast period (2025-2033), offering invaluable insights for stakeholders seeking to navigate this dynamic market. Key players like Tracerco Limited, SE International Inc, Fuji Electric Co Ltd, Thermo Fisher Scientific Inc, Automess - Automation and Measurement GmbH, Fortive Corporation, ATOMTEX, Mirion Technologies Inc, Radiation Detection Company Inc, and Arrow-Tech Inc are analyzed in detail. This report is crucial for strategic decision-making, investment planning, and understanding the future trajectory of the dosimetry equipment market.
Dosimetry Equipment Industry Market Composition & Trends
The Dosimetry Equipment market, valued at xx Million in 2025, exhibits a moderately consolidated structure. Market share distribution varies across key players, with Thermo Fisher Scientific and Mirion Technologies holding significant positions, while others compete intensely in niche segments. Innovation is driven by the need for enhanced accuracy, portability, and ease of use, particularly in demanding environments like space exploration (as evidenced by recent developments at the ELKH Center for Energy Research and ESA). Stringent regulatory frameworks, particularly concerning radiation safety, significantly impact market dynamics. Substitute products, while limited, include passive dosimetry methods with lower accuracy, limiting their widespread adoption. The market witnesses continuous M&A activity, with deal values ranging from xx Million to xx Million in recent years, driven by the pursuit of technological advancements and market expansion.
- Market Concentration: Moderately consolidated, with a few dominant players.
- Innovation Catalysts: Demand for higher accuracy, improved portability, and user-friendly interfaces.
- Regulatory Landscape: Stringent safety regulations drive product development and adoption.
- Substitute Products: Limited, with passive methods offering lower accuracy.
- M&A Activity: Significant, with deal values ranging from xx Million to xx Million, driven by expansion strategies.
- End-User Profiles: Diverse, including healthcare, oil and gas, nuclear power plants, and manufacturing.
Dosimetry Equipment Industry Evolution
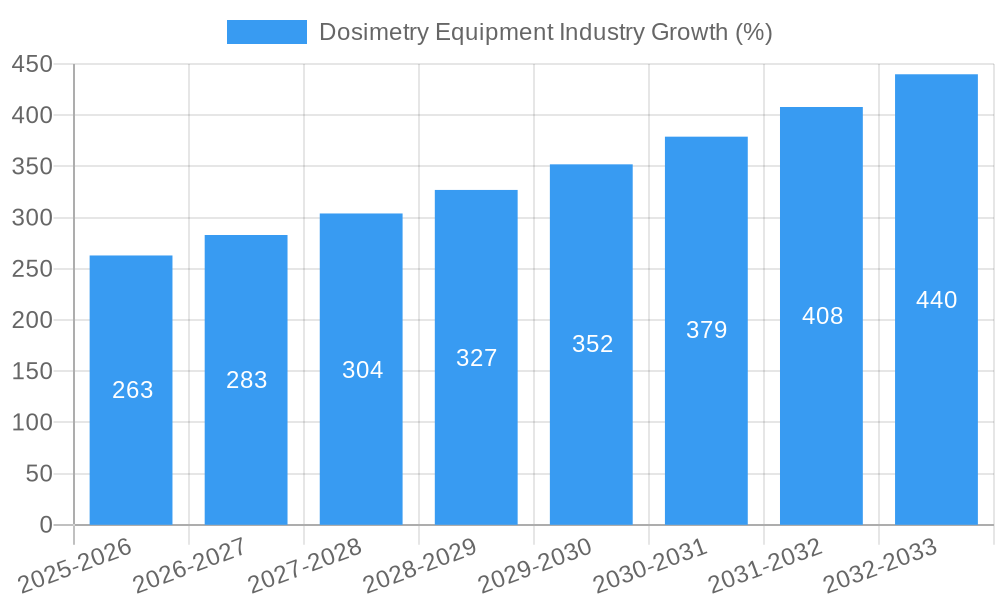
The Dosimetry Equipment market has witnessed steady growth throughout the historical period (2019-2024), experiencing a Compound Annual Growth Rate (CAGR) of xx% fueled by increasing awareness of radiation safety, stringent regulations, and the expansion of industries utilizing dosimetry equipment. Technological advancements, including the development of more sensitive detectors and advanced data processing capabilities, have significantly enhanced the accuracy and reliability of dosimeters. The market's evolution has also been influenced by shifting consumer demands for improved ergonomics, reduced cost, and wireless connectivity. The forecast period (2025-2033) projects continued growth, reaching an estimated xx Million by 2033, driven by factors like rising demand from emerging economies and advancements in space exploration technology. Adoption of newer technologies like OSL dosimeters is increasing steadily, while traditional methods like film badge dosimeters are gradually declining in market share.
Leading Regions, Countries, or Segments in Dosimetry Equipment Industry
The North American region currently dominates the Dosimetry Equipment market, driven by robust healthcare infrastructure, a strong regulatory environment focusing on radiation safety, and significant investments in nuclear energy and related industries. Within this region, the United States exhibits the highest market share due to its advanced healthcare system and large-scale industrial activities. The European market is also substantial, with countries like Germany and France leading due to their well-established nuclear power sectors and stringent safety regulations.
Key Drivers:
- High Investment in Healthcare: Significant investments in healthcare infrastructure and expansion in developed countries.
- Stringent Regulatory Support: Stricter regulations related to radiation safety and worker protection.
- Nuclear Power Plant Developments: Continued operation and expansion of existing nuclear plants.
- Oil and Gas Exploration: Increased exploration and production activities globally.
Dominance Factors: Developed nations with advanced healthcare, robust industrial sectors, and established nuclear energy programs significantly influence the market landscape. High regulatory compliance coupled with substantial investments in research and development contributes significantly to this dominance.
Dosimetry Equipment Industry Product Innovations
Recent innovations include the development of smaller, lighter, and more user-friendly electronic personal dosimeters (EPDs) with enhanced accuracy and real-time radiation monitoring capabilities. Optically Stimulated Luminescence Dosimeters (OSLs) have gained popularity due to their superior sensitivity and reusability. Advanced data analytics integrated into dosimetry systems offer improved dose assessment and reporting, enhancing occupational safety and regulatory compliance. Unique selling propositions include improved accuracy, portability, and data management capabilities.
Propelling Factors for Dosimetry Equipment Growth
Several factors propel the growth of the dosimetry equipment market. Technological advancements leading to miniaturization, increased sensitivity, and better data processing are crucial. The expanding nuclear power industry and increasing oil & gas exploration activities fuel demand for robust radiation detection solutions. Furthermore, stringent government regulations mandating radiation safety measures across various industries create a compelling market for reliable dosimetry equipment.
Obstacles in the Dosimetry Equipment Industry Market
The Dosimetry Equipment market faces challenges including stringent regulatory approvals, leading to prolonged product launch cycles. Supply chain disruptions, especially in procuring specialized components, can impact production and delivery timelines. Furthermore, intense competition from established players and new entrants necessitates continuous innovation and cost optimization strategies to maintain market share.
Future Opportunities in Dosimetry Equipment Industry
The market presents significant opportunities. Expanding into emerging economies with growing industrial sectors will increase demand. Advancements in wireless technology and cloud-based data management will enhance dosimetry systems. Furthermore, the growing space exploration industry will drive demand for specialized dosimeters capable of withstanding extreme environmental conditions.
Major Players in the Dosimetry Equipment Industry Ecosystem
- Tracerco Limited
- SE International Inc
- Fuji Electric Co Ltd
- Thermo Fisher Scientific Inc
- Automess - Automation and Measurement GmbH
- Fortive Corporation
- ATOMTEX
- Mirion Technologies Inc
- Radiation Detection Company Inc
- Arrow-Tech Inc
Key Developments in Dosimetry Equipment Industry
- September 2022: Hungary's ELKH Center for Energy Research (CER) Space Research Division developed a new dosimeter for lunar missions and the Artemis program, significantly advancing radiation measurement capabilities in space exploration.
- April 2022: The European Space Agency (ESA) utilized DOSIS 3D experiment radiation detectors for ten years, providing valuable data on radiation levels in the International Space Station and the Artemis I mission. This highlights the crucial role of active dosimeters in space exploration and their increasing importance in safeguarding astronauts and equipment.
Strategic Dosimetry Equipment Industry Market Forecast
The Dosimetry Equipment market is poised for substantial growth, driven by technological advancements, increasing regulatory scrutiny, and the expanding global industrial landscape. Continued demand from healthcare, nuclear energy, and space exploration sectors will fuel market expansion. Innovations in miniaturization, real-time monitoring, and enhanced data analytics will further drive market growth, creating significant opportunities for established and emerging players alike. The predicted market size exceeding xx Million by 2033 underscores the significant potential of this sector.
Dosimetry Equipment Industry Segmentation
-
1. Type
- 1.1. Electronic Personal Dosimeter (EPD)
- 1.2. Thermo Luminescent Dosimeter (TLD)
- 1.3. Optically Stimulated Luminescence Dosimeters (OSL)
- 1.4. Film Badge Dosimeter
- 1.5. Other Types
-
2. Application
- 2.1. Active
- 2.2. Passive
-
3. End-user Industry
- 3.1. Healthcare
- 3.2. Oil and Gas
- 3.3. Mining
- 3.4. Nuclear Plants
- 3.5. Industrial
- 3.6. Manufacturing
- 3.7. Other End-user Industries
Dosimetry Equipment Industry Segmentation By Geography
- 1. North America
- 2. Europe
- 3. Asia
- 4. Australia and New Zealand
- 5. Latin America
- 6. Middle East and Africa
Dosimetry Equipment Industry REPORT HIGHLIGHTS
| Aspects | Details |
|---|---|
| Study Period | 2019-2033 |
| Base Year | 2024 |
| Estimated Year | 2025 |
| Forecast Period | 2025-2033 |
| Historical Period | 2019-2024 |
| Growth Rate | CAGR of 7.11% from 2019-2033 |
| Segmentation |
|
Table of Contents
- 1. Introduction
- 1.1. Research Scope
- 1.2. Market Segmentation
- 1.3. Research Methodology
- 1.4. Definitions and Assumptions
- 2. Executive Summary
- 2.1. Introduction
- 3. Market Dynamics
- 3.1. Introduction
- 3.2. Market Drivers
- 3.2.1. Growing Demand for Radiation and Monitoring Devices Across the Medical Sector; Rising Application of Radioactive Substances Across the Industrial Sector
- 3.3. Market Restrains
- 3.3.1 Product Accuracy
- 3.3.2 Stringent Government Regulations
- 3.3.3 and High Costs
- 3.4. Market Trends
- 3.4.1. Rising Application of Radioactive Substances Across the Industrial Sector Drives the Market
- 4. Market Factor Analysis
- 4.1. Porters Five Forces
- 4.2. Supply/Value Chain
- 4.3. PESTEL analysis
- 4.4. Market Entropy
- 4.5. Patent/Trademark Analysis
- 5. Global Dosimetry Equipment Industry Analysis, Insights and Forecast, 2019-2031
- 5.1. Market Analysis, Insights and Forecast - by Type
- 5.1.1. Electronic Personal Dosimeter (EPD)
- 5.1.2. Thermo Luminescent Dosimeter (TLD)
- 5.1.3. Optically Stimulated Luminescence Dosimeters (OSL)
- 5.1.4. Film Badge Dosimeter
- 5.1.5. Other Types
- 5.2. Market Analysis, Insights and Forecast - by Application
- 5.2.1. Active
- 5.2.2. Passive
- 5.3. Market Analysis, Insights and Forecast - by End-user Industry
- 5.3.1. Healthcare
- 5.3.2. Oil and Gas
- 5.3.3. Mining
- 5.3.4. Nuclear Plants
- 5.3.5. Industrial
- 5.3.6. Manufacturing
- 5.3.7. Other End-user Industries
- 5.4. Market Analysis, Insights and Forecast - by Region
- 5.4.1. North America
- 5.4.2. Europe
- 5.4.3. Asia
- 5.4.4. Australia and New Zealand
- 5.4.5. Latin America
- 5.4.6. Middle East and Africa
- 5.1. Market Analysis, Insights and Forecast - by Type
- 6. North America Dosimetry Equipment Industry Analysis, Insights and Forecast, 2019-2031
- 6.1. Market Analysis, Insights and Forecast - by Type
- 6.1.1. Electronic Personal Dosimeter (EPD)
- 6.1.2. Thermo Luminescent Dosimeter (TLD)
- 6.1.3. Optically Stimulated Luminescence Dosimeters (OSL)
- 6.1.4. Film Badge Dosimeter
- 6.1.5. Other Types
- 6.2. Market Analysis, Insights and Forecast - by Application
- 6.2.1. Active
- 6.2.2. Passive
- 6.3. Market Analysis, Insights and Forecast - by End-user Industry
- 6.3.1. Healthcare
- 6.3.2. Oil and Gas
- 6.3.3. Mining
- 6.3.4. Nuclear Plants
- 6.3.5. Industrial
- 6.3.6. Manufacturing
- 6.3.7. Other End-user Industries
- 6.1. Market Analysis, Insights and Forecast - by Type
- 7. Europe Dosimetry Equipment Industry Analysis, Insights and Forecast, 2019-2031
- 7.1. Market Analysis, Insights and Forecast - by Type
- 7.1.1. Electronic Personal Dosimeter (EPD)
- 7.1.2. Thermo Luminescent Dosimeter (TLD)
- 7.1.3. Optically Stimulated Luminescence Dosimeters (OSL)
- 7.1.4. Film Badge Dosimeter
- 7.1.5. Other Types
- 7.2. Market Analysis, Insights and Forecast - by Application
- 7.2.1. Active
- 7.2.2. Passive
- 7.3. Market Analysis, Insights and Forecast - by End-user Industry
- 7.3.1. Healthcare
- 7.3.2. Oil and Gas
- 7.3.3. Mining
- 7.3.4. Nuclear Plants
- 7.3.5. Industrial
- 7.3.6. Manufacturing
- 7.3.7. Other End-user Industries
- 7.1. Market Analysis, Insights and Forecast - by Type
- 8. Asia Dosimetry Equipment Industry Analysis, Insights and Forecast, 2019-2031
- 8.1. Market Analysis, Insights and Forecast - by Type
- 8.1.1. Electronic Personal Dosimeter (EPD)
- 8.1.2. Thermo Luminescent Dosimeter (TLD)
- 8.1.3. Optically Stimulated Luminescence Dosimeters (OSL)
- 8.1.4. Film Badge Dosimeter
- 8.1.5. Other Types
- 8.2. Market Analysis, Insights and Forecast - by Application
- 8.2.1. Active
- 8.2.2. Passive
- 8.3. Market Analysis, Insights and Forecast - by End-user Industry
- 8.3.1. Healthcare
- 8.3.2. Oil and Gas
- 8.3.3. Mining
- 8.3.4. Nuclear Plants
- 8.3.5. Industrial
- 8.3.6. Manufacturing
- 8.3.7. Other End-user Industries
- 8.1. Market Analysis, Insights and Forecast - by Type
- 9. Australia and New Zealand Dosimetry Equipment Industry Analysis, Insights and Forecast, 2019-2031
- 9.1. Market Analysis, Insights and Forecast - by Type
- 9.1.1. Electronic Personal Dosimeter (EPD)
- 9.1.2. Thermo Luminescent Dosimeter (TLD)
- 9.1.3. Optically Stimulated Luminescence Dosimeters (OSL)
- 9.1.4. Film Badge Dosimeter
- 9.1.5. Other Types
- 9.2. Market Analysis, Insights and Forecast - by Application
- 9.2.1. Active
- 9.2.2. Passive
- 9.3. Market Analysis, Insights and Forecast - by End-user Industry
- 9.3.1. Healthcare
- 9.3.2. Oil and Gas
- 9.3.3. Mining
- 9.3.4. Nuclear Plants
- 9.3.5. Industrial
- 9.3.6. Manufacturing
- 9.3.7. Other End-user Industries
- 9.1. Market Analysis, Insights and Forecast - by Type
- 10. Latin America Dosimetry Equipment Industry Analysis, Insights and Forecast, 2019-2031
- 10.1. Market Analysis, Insights and Forecast - by Type
- 10.1.1. Electronic Personal Dosimeter (EPD)
- 10.1.2. Thermo Luminescent Dosimeter (TLD)
- 10.1.3. Optically Stimulated Luminescence Dosimeters (OSL)
- 10.1.4. Film Badge Dosimeter
- 10.1.5. Other Types
- 10.2. Market Analysis, Insights and Forecast - by Application
- 10.2.1. Active
- 10.2.2. Passive
- 10.3. Market Analysis, Insights and Forecast - by End-user Industry
- 10.3.1. Healthcare
- 10.3.2. Oil and Gas
- 10.3.3. Mining
- 10.3.4. Nuclear Plants
- 10.3.5. Industrial
- 10.3.6. Manufacturing
- 10.3.7. Other End-user Industries
- 10.1. Market Analysis, Insights and Forecast - by Type
- 11. Middle East and Africa Dosimetry Equipment Industry Analysis, Insights and Forecast, 2019-2031
- 11.1. Market Analysis, Insights and Forecast - by Type
- 11.1.1. Electronic Personal Dosimeter (EPD)
- 11.1.2. Thermo Luminescent Dosimeter (TLD)
- 11.1.3. Optically Stimulated Luminescence Dosimeters (OSL)
- 11.1.4. Film Badge Dosimeter
- 11.1.5. Other Types
- 11.2. Market Analysis, Insights and Forecast - by Application
- 11.2.1. Active
- 11.2.2. Passive
- 11.3. Market Analysis, Insights and Forecast - by End-user Industry
- 11.3.1. Healthcare
- 11.3.2. Oil and Gas
- 11.3.3. Mining
- 11.3.4. Nuclear Plants
- 11.3.5. Industrial
- 11.3.6. Manufacturing
- 11.3.7. Other End-user Industries
- 11.1. Market Analysis, Insights and Forecast - by Type
- 12. North America Dosimetry Equipment Industry Analysis, Insights and Forecast, 2019-2031
- 12.1. Market Analysis, Insights and Forecast - By Country/Sub-region
- 12.1.1 United States
- 12.1.2 Canada
- 12.1.3 Mexico
- 13. Europe Dosimetry Equipment Industry Analysis, Insights and Forecast, 2019-2031
- 13.1. Market Analysis, Insights and Forecast - By Country/Sub-region
- 13.1.1 Germany
- 13.1.2 United Kingdom
- 13.1.3 France
- 13.1.4 Spain
- 13.1.5 Italy
- 13.1.6 Spain
- 13.1.7 Belgium
- 13.1.8 Netherland
- 13.1.9 Nordics
- 13.1.10 Rest of Europe
- 14. Asia Pacific Dosimetry Equipment Industry Analysis, Insights and Forecast, 2019-2031
- 14.1. Market Analysis, Insights and Forecast - By Country/Sub-region
- 14.1.1 China
- 14.1.2 Japan
- 14.1.3 India
- 14.1.4 South Korea
- 14.1.5 Southeast Asia
- 14.1.6 Australia
- 14.1.7 Indonesia
- 14.1.8 Phillipes
- 14.1.9 Singapore
- 14.1.10 Thailandc
- 14.1.11 Rest of Asia Pacific
- 15. South America Dosimetry Equipment Industry Analysis, Insights and Forecast, 2019-2031
- 15.1. Market Analysis, Insights and Forecast - By Country/Sub-region
- 15.1.1 Brazil
- 15.1.2 Argentina
- 15.1.3 Peru
- 15.1.4 Chile
- 15.1.5 Colombia
- 15.1.6 Ecuador
- 15.1.7 Venezuela
- 15.1.8 Rest of South America
- 16. North America Dosimetry Equipment Industry Analysis, Insights and Forecast, 2019-2031
- 16.1. Market Analysis, Insights and Forecast - By Country/Sub-region
- 16.1.1 United States
- 16.1.2 Canada
- 16.1.3 Mexico
- 17. MEA Dosimetry Equipment Industry Analysis, Insights and Forecast, 2019-2031
- 17.1. Market Analysis, Insights and Forecast - By Country/Sub-region
- 17.1.1 United Arab Emirates
- 17.1.2 Saudi Arabia
- 17.1.3 South Africa
- 17.1.4 Rest of Middle East and Africa
- 18. Competitive Analysis
- 18.1. Global Market Share Analysis 2024
- 18.2. Company Profiles
- 18.2.1 Tracerco Limited
- 18.2.1.1. Overview
- 18.2.1.2. Products
- 18.2.1.3. SWOT Analysis
- 18.2.1.4. Recent Developments
- 18.2.1.5. Financials (Based on Availability)
- 18.2.2 SE International Inc
- 18.2.2.1. Overview
- 18.2.2.2. Products
- 18.2.2.3. SWOT Analysis
- 18.2.2.4. Recent Developments
- 18.2.2.5. Financials (Based on Availability)
- 18.2.3 Fuji Electric Co Ltd
- 18.2.3.1. Overview
- 18.2.3.2. Products
- 18.2.3.3. SWOT Analysis
- 18.2.3.4. Recent Developments
- 18.2.3.5. Financials (Based on Availability)
- 18.2.4 Thermo Fisher Scientific Inc
- 18.2.4.1. Overview
- 18.2.4.2. Products
- 18.2.4.3. SWOT Analysis
- 18.2.4.4. Recent Developments
- 18.2.4.5. Financials (Based on Availability)
- 18.2.5 Automess - Automation and Measurement GmbH
- 18.2.5.1. Overview
- 18.2.5.2. Products
- 18.2.5.3. SWOT Analysis
- 18.2.5.4. Recent Developments
- 18.2.5.5. Financials (Based on Availability)
- 18.2.6 Fortive Corporation
- 18.2.6.1. Overview
- 18.2.6.2. Products
- 18.2.6.3. SWOT Analysis
- 18.2.6.4. Recent Developments
- 18.2.6.5. Financials (Based on Availability)
- 18.2.7 ATOMTEX
- 18.2.7.1. Overview
- 18.2.7.2. Products
- 18.2.7.3. SWOT Analysis
- 18.2.7.4. Recent Developments
- 18.2.7.5. Financials (Based on Availability)
- 18.2.8 Mirion Technologies Inc
- 18.2.8.1. Overview
- 18.2.8.2. Products
- 18.2.8.3. SWOT Analysis
- 18.2.8.4. Recent Developments
- 18.2.8.5. Financials (Based on Availability)
- 18.2.9 Radiation Detection Company Inc
- 18.2.9.1. Overview
- 18.2.9.2. Products
- 18.2.9.3. SWOT Analysis
- 18.2.9.4. Recent Developments
- 18.2.9.5. Financials (Based on Availability)
- 18.2.10 Arrow-Tech Inc
- 18.2.10.1. Overview
- 18.2.10.2. Products
- 18.2.10.3. SWOT Analysis
- 18.2.10.4. Recent Developments
- 18.2.10.5. Financials (Based on Availability)
- 18.2.1 Tracerco Limited
List of Figures
- Figure 1: Global Dosimetry Equipment Industry Revenue Breakdown (Million, %) by Region 2024 & 2032
- Figure 2: Global Dosimetry Equipment Industry Volume Breakdown (K Unit, %) by Region 2024 & 2032
- Figure 3: North America Dosimetry Equipment Industry Revenue (Million), by Country 2024 & 2032
- Figure 4: North America Dosimetry Equipment Industry Volume (K Unit), by Country 2024 & 2032
- Figure 5: North America Dosimetry Equipment Industry Revenue Share (%), by Country 2024 & 2032
- Figure 6: North America Dosimetry Equipment Industry Volume Share (%), by Country 2024 & 2032
- Figure 7: Europe Dosimetry Equipment Industry Revenue (Million), by Country 2024 & 2032
- Figure 8: Europe Dosimetry Equipment Industry Volume (K Unit), by Country 2024 & 2032
- Figure 9: Europe Dosimetry Equipment Industry Revenue Share (%), by Country 2024 & 2032
- Figure 10: Europe Dosimetry Equipment Industry Volume Share (%), by Country 2024 & 2032
- Figure 11: Asia Pacific Dosimetry Equipment Industry Revenue (Million), by Country 2024 & 2032
- Figure 12: Asia Pacific Dosimetry Equipment Industry Volume (K Unit), by Country 2024 & 2032
- Figure 13: Asia Pacific Dosimetry Equipment Industry Revenue Share (%), by Country 2024 & 2032
- Figure 14: Asia Pacific Dosimetry Equipment Industry Volume Share (%), by Country 2024 & 2032
- Figure 15: South America Dosimetry Equipment Industry Revenue (Million), by Country 2024 & 2032
- Figure 16: South America Dosimetry Equipment Industry Volume (K Unit), by Country 2024 & 2032
- Figure 17: South America Dosimetry Equipment Industry Revenue Share (%), by Country 2024 & 2032
- Figure 18: South America Dosimetry Equipment Industry Volume Share (%), by Country 2024 & 2032
- Figure 19: North America Dosimetry Equipment Industry Revenue (Million), by Country 2024 & 2032
- Figure 20: North America Dosimetry Equipment Industry Volume (K Unit), by Country 2024 & 2032
- Figure 21: North America Dosimetry Equipment Industry Revenue Share (%), by Country 2024 & 2032
- Figure 22: North America Dosimetry Equipment Industry Volume Share (%), by Country 2024 & 2032
- Figure 23: MEA Dosimetry Equipment Industry Revenue (Million), by Country 2024 & 2032
- Figure 24: MEA Dosimetry Equipment Industry Volume (K Unit), by Country 2024 & 2032
- Figure 25: MEA Dosimetry Equipment Industry Revenue Share (%), by Country 2024 & 2032
- Figure 26: MEA Dosimetry Equipment Industry Volume Share (%), by Country 2024 & 2032
- Figure 27: North America Dosimetry Equipment Industry Revenue (Million), by Type 2024 & 2032
- Figure 28: North America Dosimetry Equipment Industry Volume (K Unit), by Type 2024 & 2032
- Figure 29: North America Dosimetry Equipment Industry Revenue Share (%), by Type 2024 & 2032
- Figure 30: North America Dosimetry Equipment Industry Volume Share (%), by Type 2024 & 2032
- Figure 31: North America Dosimetry Equipment Industry Revenue (Million), by Application 2024 & 2032
- Figure 32: North America Dosimetry Equipment Industry Volume (K Unit), by Application 2024 & 2032
- Figure 33: North America Dosimetry Equipment Industry Revenue Share (%), by Application 2024 & 2032
- Figure 34: North America Dosimetry Equipment Industry Volume Share (%), by Application 2024 & 2032
- Figure 35: North America Dosimetry Equipment Industry Revenue (Million), by End-user Industry 2024 & 2032
- Figure 36: North America Dosimetry Equipment Industry Volume (K Unit), by End-user Industry 2024 & 2032
- Figure 37: North America Dosimetry Equipment Industry Revenue Share (%), by End-user Industry 2024 & 2032
- Figure 38: North America Dosimetry Equipment Industry Volume Share (%), by End-user Industry 2024 & 2032
- Figure 39: North America Dosimetry Equipment Industry Revenue (Million), by Country 2024 & 2032
- Figure 40: North America Dosimetry Equipment Industry Volume (K Unit), by Country 2024 & 2032
- Figure 41: North America Dosimetry Equipment Industry Revenue Share (%), by Country 2024 & 2032
- Figure 42: North America Dosimetry Equipment Industry Volume Share (%), by Country 2024 & 2032
- Figure 43: Europe Dosimetry Equipment Industry Revenue (Million), by Type 2024 & 2032
- Figure 44: Europe Dosimetry Equipment Industry Volume (K Unit), by Type 2024 & 2032
- Figure 45: Europe Dosimetry Equipment Industry Revenue Share (%), by Type 2024 & 2032
- Figure 46: Europe Dosimetry Equipment Industry Volume Share (%), by Type 2024 & 2032
- Figure 47: Europe Dosimetry Equipment Industry Revenue (Million), by Application 2024 & 2032
- Figure 48: Europe Dosimetry Equipment Industry Volume (K Unit), by Application 2024 & 2032
- Figure 49: Europe Dosimetry Equipment Industry Revenue Share (%), by Application 2024 & 2032
- Figure 50: Europe Dosimetry Equipment Industry Volume Share (%), by Application 2024 & 2032
- Figure 51: Europe Dosimetry Equipment Industry Revenue (Million), by End-user Industry 2024 & 2032
- Figure 52: Europe Dosimetry Equipment Industry Volume (K Unit), by End-user Industry 2024 & 2032
- Figure 53: Europe Dosimetry Equipment Industry Revenue Share (%), by End-user Industry 2024 & 2032
- Figure 54: Europe Dosimetry Equipment Industry Volume Share (%), by End-user Industry 2024 & 2032
- Figure 55: Europe Dosimetry Equipment Industry Revenue (Million), by Country 2024 & 2032
- Figure 56: Europe Dosimetry Equipment Industry Volume (K Unit), by Country 2024 & 2032
- Figure 57: Europe Dosimetry Equipment Industry Revenue Share (%), by Country 2024 & 2032
- Figure 58: Europe Dosimetry Equipment Industry Volume Share (%), by Country 2024 & 2032
- Figure 59: Asia Dosimetry Equipment Industry Revenue (Million), by Type 2024 & 2032
- Figure 60: Asia Dosimetry Equipment Industry Volume (K Unit), by Type 2024 & 2032
- Figure 61: Asia Dosimetry Equipment Industry Revenue Share (%), by Type 2024 & 2032
- Figure 62: Asia Dosimetry Equipment Industry Volume Share (%), by Type 2024 & 2032
- Figure 63: Asia Dosimetry Equipment Industry Revenue (Million), by Application 2024 & 2032
- Figure 64: Asia Dosimetry Equipment Industry Volume (K Unit), by Application 2024 & 2032
- Figure 65: Asia Dosimetry Equipment Industry Revenue Share (%), by Application 2024 & 2032
- Figure 66: Asia Dosimetry Equipment Industry Volume Share (%), by Application 2024 & 2032
- Figure 67: Asia Dosimetry Equipment Industry Revenue (Million), by End-user Industry 2024 & 2032
- Figure 68: Asia Dosimetry Equipment Industry Volume (K Unit), by End-user Industry 2024 & 2032
- Figure 69: Asia Dosimetry Equipment Industry Revenue Share (%), by End-user Industry 2024 & 2032
- Figure 70: Asia Dosimetry Equipment Industry Volume Share (%), by End-user Industry 2024 & 2032
- Figure 71: Asia Dosimetry Equipment Industry Revenue (Million), by Country 2024 & 2032
- Figure 72: Asia Dosimetry Equipment Industry Volume (K Unit), by Country 2024 & 2032
- Figure 73: Asia Dosimetry Equipment Industry Revenue Share (%), by Country 2024 & 2032
- Figure 74: Asia Dosimetry Equipment Industry Volume Share (%), by Country 2024 & 2032
- Figure 75: Australia and New Zealand Dosimetry Equipment Industry Revenue (Million), by Type 2024 & 2032
- Figure 76: Australia and New Zealand Dosimetry Equipment Industry Volume (K Unit), by Type 2024 & 2032
- Figure 77: Australia and New Zealand Dosimetry Equipment Industry Revenue Share (%), by Type 2024 & 2032
- Figure 78: Australia and New Zealand Dosimetry Equipment Industry Volume Share (%), by Type 2024 & 2032
- Figure 79: Australia and New Zealand Dosimetry Equipment Industry Revenue (Million), by Application 2024 & 2032
- Figure 80: Australia and New Zealand Dosimetry Equipment Industry Volume (K Unit), by Application 2024 & 2032
- Figure 81: Australia and New Zealand Dosimetry Equipment Industry Revenue Share (%), by Application 2024 & 2032
- Figure 82: Australia and New Zealand Dosimetry Equipment Industry Volume Share (%), by Application 2024 & 2032
- Figure 83: Australia and New Zealand Dosimetry Equipment Industry Revenue (Million), by End-user Industry 2024 & 2032
- Figure 84: Australia and New Zealand Dosimetry Equipment Industry Volume (K Unit), by End-user Industry 2024 & 2032
- Figure 85: Australia and New Zealand Dosimetry Equipment Industry Revenue Share (%), by End-user Industry 2024 & 2032
- Figure 86: Australia and New Zealand Dosimetry Equipment Industry Volume Share (%), by End-user Industry 2024 & 2032
- Figure 87: Australia and New Zealand Dosimetry Equipment Industry Revenue (Million), by Country 2024 & 2032
- Figure 88: Australia and New Zealand Dosimetry Equipment Industry Volume (K Unit), by Country 2024 & 2032
- Figure 89: Australia and New Zealand Dosimetry Equipment Industry Revenue Share (%), by Country 2024 & 2032
- Figure 90: Australia and New Zealand Dosimetry Equipment Industry Volume Share (%), by Country 2024 & 2032
- Figure 91: Latin America Dosimetry Equipment Industry Revenue (Million), by Type 2024 & 2032
- Figure 92: Latin America Dosimetry Equipment Industry Volume (K Unit), by Type 2024 & 2032
- Figure 93: Latin America Dosimetry Equipment Industry Revenue Share (%), by Type 2024 & 2032
- Figure 94: Latin America Dosimetry Equipment Industry Volume Share (%), by Type 2024 & 2032
- Figure 95: Latin America Dosimetry Equipment Industry Revenue (Million), by Application 2024 & 2032
- Figure 96: Latin America Dosimetry Equipment Industry Volume (K Unit), by Application 2024 & 2032
- Figure 97: Latin America Dosimetry Equipment Industry Revenue Share (%), by Application 2024 & 2032
- Figure 98: Latin America Dosimetry Equipment Industry Volume Share (%), by Application 2024 & 2032
- Figure 99: Latin America Dosimetry Equipment Industry Revenue (Million), by End-user Industry 2024 & 2032
- Figure 100: Latin America Dosimetry Equipment Industry Volume (K Unit), by End-user Industry 2024 & 2032
- Figure 101: Latin America Dosimetry Equipment Industry Revenue Share (%), by End-user Industry 2024 & 2032
- Figure 102: Latin America Dosimetry Equipment Industry Volume Share (%), by End-user Industry 2024 & 2032
- Figure 103: Latin America Dosimetry Equipment Industry Revenue (Million), by Country 2024 & 2032
- Figure 104: Latin America Dosimetry Equipment Industry Volume (K Unit), by Country 2024 & 2032
- Figure 105: Latin America Dosimetry Equipment Industry Revenue Share (%), by Country 2024 & 2032
- Figure 106: Latin America Dosimetry Equipment Industry Volume Share (%), by Country 2024 & 2032
- Figure 107: Middle East and Africa Dosimetry Equipment Industry Revenue (Million), by Type 2024 & 2032
- Figure 108: Middle East and Africa Dosimetry Equipment Industry Volume (K Unit), by Type 2024 & 2032
- Figure 109: Middle East and Africa Dosimetry Equipment Industry Revenue Share (%), by Type 2024 & 2032
- Figure 110: Middle East and Africa Dosimetry Equipment Industry Volume Share (%), by Type 2024 & 2032
- Figure 111: Middle East and Africa Dosimetry Equipment Industry Revenue (Million), by Application 2024 & 2032
- Figure 112: Middle East and Africa Dosimetry Equipment Industry Volume (K Unit), by Application 2024 & 2032
- Figure 113: Middle East and Africa Dosimetry Equipment Industry Revenue Share (%), by Application 2024 & 2032
- Figure 114: Middle East and Africa Dosimetry Equipment Industry Volume Share (%), by Application 2024 & 2032
- Figure 115: Middle East and Africa Dosimetry Equipment Industry Revenue (Million), by End-user Industry 2024 & 2032
- Figure 116: Middle East and Africa Dosimetry Equipment Industry Volume (K Unit), by End-user Industry 2024 & 2032
- Figure 117: Middle East and Africa Dosimetry Equipment Industry Revenue Share (%), by End-user Industry 2024 & 2032
- Figure 118: Middle East and Africa Dosimetry Equipment Industry Volume Share (%), by End-user Industry 2024 & 2032
- Figure 119: Middle East and Africa Dosimetry Equipment Industry Revenue (Million), by Country 2024 & 2032
- Figure 120: Middle East and Africa Dosimetry Equipment Industry Volume (K Unit), by Country 2024 & 2032
- Figure 121: Middle East and Africa Dosimetry Equipment Industry Revenue Share (%), by Country 2024 & 2032
- Figure 122: Middle East and Africa Dosimetry Equipment Industry Volume Share (%), by Country 2024 & 2032
List of Tables
- Table 1: Global Dosimetry Equipment Industry Revenue Million Forecast, by Region 2019 & 2032
- Table 2: Global Dosimetry Equipment Industry Volume K Unit Forecast, by Region 2019 & 2032
- Table 3: Global Dosimetry Equipment Industry Revenue Million Forecast, by Type 2019 & 2032
- Table 4: Global Dosimetry Equipment Industry Volume K Unit Forecast, by Type 2019 & 2032
- Table 5: Global Dosimetry Equipment Industry Revenue Million Forecast, by Application 2019 & 2032
- Table 6: Global Dosimetry Equipment Industry Volume K Unit Forecast, by Application 2019 & 2032
- Table 7: Global Dosimetry Equipment Industry Revenue Million Forecast, by End-user Industry 2019 & 2032
- Table 8: Global Dosimetry Equipment Industry Volume K Unit Forecast, by End-user Industry 2019 & 2032
- Table 9: Global Dosimetry Equipment Industry Revenue Million Forecast, by Region 2019 & 2032
- Table 10: Global Dosimetry Equipment Industry Volume K Unit Forecast, by Region 2019 & 2032
- Table 11: Global Dosimetry Equipment Industry Revenue Million Forecast, by Country 2019 & 2032
- Table 12: Global Dosimetry Equipment Industry Volume K Unit Forecast, by Country 2019 & 2032
- Table 13: United States Dosimetry Equipment Industry Revenue (Million) Forecast, by Application 2019 & 2032
- Table 14: United States Dosimetry Equipment Industry Volume (K Unit) Forecast, by Application 2019 & 2032
- Table 15: Canada Dosimetry Equipment Industry Revenue (Million) Forecast, by Application 2019 & 2032
- Table 16: Canada Dosimetry Equipment Industry Volume (K Unit) Forecast, by Application 2019 & 2032
- Table 17: Mexico Dosimetry Equipment Industry Revenue (Million) Forecast, by Application 2019 & 2032
- Table 18: Mexico Dosimetry Equipment Industry Volume (K Unit) Forecast, by Application 2019 & 2032
- Table 19: Global Dosimetry Equipment Industry Revenue Million Forecast, by Country 2019 & 2032
- Table 20: Global Dosimetry Equipment Industry Volume K Unit Forecast, by Country 2019 & 2032
- Table 21: Germany Dosimetry Equipment Industry Revenue (Million) Forecast, by Application 2019 & 2032
- Table 22: Germany Dosimetry Equipment Industry Volume (K Unit) Forecast, by Application 2019 & 2032
- Table 23: United Kingdom Dosimetry Equipment Industry Revenue (Million) Forecast, by Application 2019 & 2032
- Table 24: United Kingdom Dosimetry Equipment Industry Volume (K Unit) Forecast, by Application 2019 & 2032
- Table 25: France Dosimetry Equipment Industry Revenue (Million) Forecast, by Application 2019 & 2032
- Table 26: France Dosimetry Equipment Industry Volume (K Unit) Forecast, by Application 2019 & 2032
- Table 27: Spain Dosimetry Equipment Industry Revenue (Million) Forecast, by Application 2019 & 2032
- Table 28: Spain Dosimetry Equipment Industry Volume (K Unit) Forecast, by Application 2019 & 2032
- Table 29: Italy Dosimetry Equipment Industry Revenue (Million) Forecast, by Application 2019 & 2032
- Table 30: Italy Dosimetry Equipment Industry Volume (K Unit) Forecast, by Application 2019 & 2032
- Table 31: Spain Dosimetry Equipment Industry Revenue (Million) Forecast, by Application 2019 & 2032
- Table 32: Spain Dosimetry Equipment Industry Volume (K Unit) Forecast, by Application 2019 & 2032
- Table 33: Belgium Dosimetry Equipment Industry Revenue (Million) Forecast, by Application 2019 & 2032
- Table 34: Belgium Dosimetry Equipment Industry Volume (K Unit) Forecast, by Application 2019 & 2032
- Table 35: Netherland Dosimetry Equipment Industry Revenue (Million) Forecast, by Application 2019 & 2032
- Table 36: Netherland Dosimetry Equipment Industry Volume (K Unit) Forecast, by Application 2019 & 2032
- Table 37: Nordics Dosimetry Equipment Industry Revenue (Million) Forecast, by Application 2019 & 2032
- Table 38: Nordics Dosimetry Equipment Industry Volume (K Unit) Forecast, by Application 2019 & 2032
- Table 39: Rest of Europe Dosimetry Equipment Industry Revenue (Million) Forecast, by Application 2019 & 2032
- Table 40: Rest of Europe Dosimetry Equipment Industry Volume (K Unit) Forecast, by Application 2019 & 2032
- Table 41: Global Dosimetry Equipment Industry Revenue Million Forecast, by Country 2019 & 2032
- Table 42: Global Dosimetry Equipment Industry Volume K Unit Forecast, by Country 2019 & 2032
- Table 43: China Dosimetry Equipment Industry Revenue (Million) Forecast, by Application 2019 & 2032
- Table 44: China Dosimetry Equipment Industry Volume (K Unit) Forecast, by Application 2019 & 2032
- Table 45: Japan Dosimetry Equipment Industry Revenue (Million) Forecast, by Application 2019 & 2032
- Table 46: Japan Dosimetry Equipment Industry Volume (K Unit) Forecast, by Application 2019 & 2032
- Table 47: India Dosimetry Equipment Industry Revenue (Million) Forecast, by Application 2019 & 2032
- Table 48: India Dosimetry Equipment Industry Volume (K Unit) Forecast, by Application 2019 & 2032
- Table 49: South Korea Dosimetry Equipment Industry Revenue (Million) Forecast, by Application 2019 & 2032
- Table 50: South Korea Dosimetry Equipment Industry Volume (K Unit) Forecast, by Application 2019 & 2032
- Table 51: Southeast Asia Dosimetry Equipment Industry Revenue (Million) Forecast, by Application 2019 & 2032
- Table 52: Southeast Asia Dosimetry Equipment Industry Volume (K Unit) Forecast, by Application 2019 & 2032
- Table 53: Australia Dosimetry Equipment Industry Revenue (Million) Forecast, by Application 2019 & 2032
- Table 54: Australia Dosimetry Equipment Industry Volume (K Unit) Forecast, by Application 2019 & 2032
- Table 55: Indonesia Dosimetry Equipment Industry Revenue (Million) Forecast, by Application 2019 & 2032
- Table 56: Indonesia Dosimetry Equipment Industry Volume (K Unit) Forecast, by Application 2019 & 2032
- Table 57: Phillipes Dosimetry Equipment Industry Revenue (Million) Forecast, by Application 2019 & 2032
- Table 58: Phillipes Dosimetry Equipment Industry Volume (K Unit) Forecast, by Application 2019 & 2032
- Table 59: Singapore Dosimetry Equipment Industry Revenue (Million) Forecast, by Application 2019 & 2032
- Table 60: Singapore Dosimetry Equipment Industry Volume (K Unit) Forecast, by Application 2019 & 2032
- Table 61: Thailandc Dosimetry Equipment Industry Revenue (Million) Forecast, by Application 2019 & 2032
- Table 62: Thailandc Dosimetry Equipment Industry Volume (K Unit) Forecast, by Application 2019 & 2032
- Table 63: Rest of Asia Pacific Dosimetry Equipment Industry Revenue (Million) Forecast, by Application 2019 & 2032
- Table 64: Rest of Asia Pacific Dosimetry Equipment Industry Volume (K Unit) Forecast, by Application 2019 & 2032
- Table 65: Global Dosimetry Equipment Industry Revenue Million Forecast, by Country 2019 & 2032
- Table 66: Global Dosimetry Equipment Industry Volume K Unit Forecast, by Country 2019 & 2032
- Table 67: Brazil Dosimetry Equipment Industry Revenue (Million) Forecast, by Application 2019 & 2032
- Table 68: Brazil Dosimetry Equipment Industry Volume (K Unit) Forecast, by Application 2019 & 2032
- Table 69: Argentina Dosimetry Equipment Industry Revenue (Million) Forecast, by Application 2019 & 2032
- Table 70: Argentina Dosimetry Equipment Industry Volume (K Unit) Forecast, by Application 2019 & 2032
- Table 71: Peru Dosimetry Equipment Industry Revenue (Million) Forecast, by Application 2019 & 2032
- Table 72: Peru Dosimetry Equipment Industry Volume (K Unit) Forecast, by Application 2019 & 2032
- Table 73: Chile Dosimetry Equipment Industry Revenue (Million) Forecast, by Application 2019 & 2032
- Table 74: Chile Dosimetry Equipment Industry Volume (K Unit) Forecast, by Application 2019 & 2032
- Table 75: Colombia Dosimetry Equipment Industry Revenue (Million) Forecast, by Application 2019 & 2032
- Table 76: Colombia Dosimetry Equipment Industry Volume (K Unit) Forecast, by Application 2019 & 2032
- Table 77: Ecuador Dosimetry Equipment Industry Revenue (Million) Forecast, by Application 2019 & 2032
- Table 78: Ecuador Dosimetry Equipment Industry Volume (K Unit) Forecast, by Application 2019 & 2032
- Table 79: Venezuela Dosimetry Equipment Industry Revenue (Million) Forecast, by Application 2019 & 2032
- Table 80: Venezuela Dosimetry Equipment Industry Volume (K Unit) Forecast, by Application 2019 & 2032
- Table 81: Rest of South America Dosimetry Equipment Industry Revenue (Million) Forecast, by Application 2019 & 2032
- Table 82: Rest of South America Dosimetry Equipment Industry Volume (K Unit) Forecast, by Application 2019 & 2032
- Table 83: Global Dosimetry Equipment Industry Revenue Million Forecast, by Country 2019 & 2032
- Table 84: Global Dosimetry Equipment Industry Volume K Unit Forecast, by Country 2019 & 2032
- Table 85: United States Dosimetry Equipment Industry Revenue (Million) Forecast, by Application 2019 & 2032
- Table 86: United States Dosimetry Equipment Industry Volume (K Unit) Forecast, by Application 2019 & 2032
- Table 87: Canada Dosimetry Equipment Industry Revenue (Million) Forecast, by Application 2019 & 2032
- Table 88: Canada Dosimetry Equipment Industry Volume (K Unit) Forecast, by Application 2019 & 2032
- Table 89: Mexico Dosimetry Equipment Industry Revenue (Million) Forecast, by Application 2019 & 2032
- Table 90: Mexico Dosimetry Equipment Industry Volume (K Unit) Forecast, by Application 2019 & 2032
- Table 91: Global Dosimetry Equipment Industry Revenue Million Forecast, by Country 2019 & 2032
- Table 92: Global Dosimetry Equipment Industry Volume K Unit Forecast, by Country 2019 & 2032
- Table 93: United Arab Emirates Dosimetry Equipment Industry Revenue (Million) Forecast, by Application 2019 & 2032
- Table 94: United Arab Emirates Dosimetry Equipment Industry Volume (K Unit) Forecast, by Application 2019 & 2032
- Table 95: Saudi Arabia Dosimetry Equipment Industry Revenue (Million) Forecast, by Application 2019 & 2032
- Table 96: Saudi Arabia Dosimetry Equipment Industry Volume (K Unit) Forecast, by Application 2019 & 2032
- Table 97: South Africa Dosimetry Equipment Industry Revenue (Million) Forecast, by Application 2019 & 2032
- Table 98: South Africa Dosimetry Equipment Industry Volume (K Unit) Forecast, by Application 2019 & 2032
- Table 99: Rest of Middle East and Africa Dosimetry Equipment Industry Revenue (Million) Forecast, by Application 2019 & 2032
- Table 100: Rest of Middle East and Africa Dosimetry Equipment Industry Volume (K Unit) Forecast, by Application 2019 & 2032
- Table 101: Global Dosimetry Equipment Industry Revenue Million Forecast, by Type 2019 & 2032
- Table 102: Global Dosimetry Equipment Industry Volume K Unit Forecast, by Type 2019 & 2032
- Table 103: Global Dosimetry Equipment Industry Revenue Million Forecast, by Application 2019 & 2032
- Table 104: Global Dosimetry Equipment Industry Volume K Unit Forecast, by Application 2019 & 2032
- Table 105: Global Dosimetry Equipment Industry Revenue Million Forecast, by End-user Industry 2019 & 2032
- Table 106: Global Dosimetry Equipment Industry Volume K Unit Forecast, by End-user Industry 2019 & 2032
- Table 107: Global Dosimetry Equipment Industry Revenue Million Forecast, by Country 2019 & 2032
- Table 108: Global Dosimetry Equipment Industry Volume K Unit Forecast, by Country 2019 & 2032
- Table 109: Global Dosimetry Equipment Industry Revenue Million Forecast, by Type 2019 & 2032
- Table 110: Global Dosimetry Equipment Industry Volume K Unit Forecast, by Type 2019 & 2032
- Table 111: Global Dosimetry Equipment Industry Revenue Million Forecast, by Application 2019 & 2032
- Table 112: Global Dosimetry Equipment Industry Volume K Unit Forecast, by Application 2019 & 2032
- Table 113: Global Dosimetry Equipment Industry Revenue Million Forecast, by End-user Industry 2019 & 2032
- Table 114: Global Dosimetry Equipment Industry Volume K Unit Forecast, by End-user Industry 2019 & 2032
- Table 115: Global Dosimetry Equipment Industry Revenue Million Forecast, by Country 2019 & 2032
- Table 116: Global Dosimetry Equipment Industry Volume K Unit Forecast, by Country 2019 & 2032
- Table 117: Global Dosimetry Equipment Industry Revenue Million Forecast, by Type 2019 & 2032
- Table 118: Global Dosimetry Equipment Industry Volume K Unit Forecast, by Type 2019 & 2032
- Table 119: Global Dosimetry Equipment Industry Revenue Million Forecast, by Application 2019 & 2032
- Table 120: Global Dosimetry Equipment Industry Volume K Unit Forecast, by Application 2019 & 2032
- Table 121: Global Dosimetry Equipment Industry Revenue Million Forecast, by End-user Industry 2019 & 2032
- Table 122: Global Dosimetry Equipment Industry Volume K Unit Forecast, by End-user Industry 2019 & 2032
- Table 123: Global Dosimetry Equipment Industry Revenue Million Forecast, by Country 2019 & 2032
- Table 124: Global Dosimetry Equipment Industry Volume K Unit Forecast, by Country 2019 & 2032
- Table 125: Global Dosimetry Equipment Industry Revenue Million Forecast, by Type 2019 & 2032
- Table 126: Global Dosimetry Equipment Industry Volume K Unit Forecast, by Type 2019 & 2032
- Table 127: Global Dosimetry Equipment Industry Revenue Million Forecast, by Application 2019 & 2032
- Table 128: Global Dosimetry Equipment Industry Volume K Unit Forecast, by Application 2019 & 2032
- Table 129: Global Dosimetry Equipment Industry Revenue Million Forecast, by End-user Industry 2019 & 2032
- Table 130: Global Dosimetry Equipment Industry Volume K Unit Forecast, by End-user Industry 2019 & 2032
- Table 131: Global Dosimetry Equipment Industry Revenue Million Forecast, by Country 2019 & 2032
- Table 132: Global Dosimetry Equipment Industry Volume K Unit Forecast, by Country 2019 & 2032
- Table 133: Global Dosimetry Equipment Industry Revenue Million Forecast, by Type 2019 & 2032
- Table 134: Global Dosimetry Equipment Industry Volume K Unit Forecast, by Type 2019 & 2032
- Table 135: Global Dosimetry Equipment Industry Revenue Million Forecast, by Application 2019 & 2032
- Table 136: Global Dosimetry Equipment Industry Volume K Unit Forecast, by Application 2019 & 2032
- Table 137: Global Dosimetry Equipment Industry Revenue Million Forecast, by End-user Industry 2019 & 2032
- Table 138: Global Dosimetry Equipment Industry Volume K Unit Forecast, by End-user Industry 2019 & 2032
- Table 139: Global Dosimetry Equipment Industry Revenue Million Forecast, by Country 2019 & 2032
- Table 140: Global Dosimetry Equipment Industry Volume K Unit Forecast, by Country 2019 & 2032
- Table 141: Global Dosimetry Equipment Industry Revenue Million Forecast, by Type 2019 & 2032
- Table 142: Global Dosimetry Equipment Industry Volume K Unit Forecast, by Type 2019 & 2032
- Table 143: Global Dosimetry Equipment Industry Revenue Million Forecast, by Application 2019 & 2032
- Table 144: Global Dosimetry Equipment Industry Volume K Unit Forecast, by Application 2019 & 2032
- Table 145: Global Dosimetry Equipment Industry Revenue Million Forecast, by End-user Industry 2019 & 2032
- Table 146: Global Dosimetry Equipment Industry Volume K Unit Forecast, by End-user Industry 2019 & 2032
- Table 147: Global Dosimetry Equipment Industry Revenue Million Forecast, by Country 2019 & 2032
- Table 148: Global Dosimetry Equipment Industry Volume K Unit Forecast, by Country 2019 & 2032
Frequently Asked Questions
1. What is the projected Compound Annual Growth Rate (CAGR) of the Dosimetry Equipment Industry?
The projected CAGR is approximately 7.11%.
2. Which companies are prominent players in the Dosimetry Equipment Industry?
Key companies in the market include Tracerco Limited, SE International Inc, Fuji Electric Co Ltd, Thermo Fisher Scientific Inc, Automess - Automation and Measurement GmbH, Fortive Corporation, ATOMTEX, Mirion Technologies Inc, Radiation Detection Company Inc , Arrow-Tech Inc.
3. What are the main segments of the Dosimetry Equipment Industry?
The market segments include Type, Application, End-user Industry.
4. Can you provide details about the market size?
The market size is estimated to be USD 3.65 Million as of 2022.
5. What are some drivers contributing to market growth?
Growing Demand for Radiation and Monitoring Devices Across the Medical Sector; Rising Application of Radioactive Substances Across the Industrial Sector.
6. What are the notable trends driving market growth?
Rising Application of Radioactive Substances Across the Industrial Sector Drives the Market.
7. Are there any restraints impacting market growth?
Product Accuracy. Stringent Government Regulations. and High Costs.
8. Can you provide examples of recent developments in the market?
September 2022: Hungary's ELKH Center for Energy Research (CER) Space Research Division developed a dosimeter to assist in the construction of the initial US lunar colony. This dosimeter can also be utilized to investigate the initial flight of NASA's Artemis program. The project aims to provide crucial information on the cosmic radiation field for the development of human spacecraft, lunar orbiting satellite stations, and lunar outposts in the future.
9. What pricing options are available for accessing the report?
Pricing options include single-user, multi-user, and enterprise licenses priced at USD 4750, USD 5250, and USD 8750 respectively.
10. Is the market size provided in terms of value or volume?
The market size is provided in terms of value, measured in Million and volume, measured in K Unit.
11. Are there any specific market keywords associated with the report?
Yes, the market keyword associated with the report is "Dosimetry Equipment Industry," which aids in identifying and referencing the specific market segment covered.
12. How do I determine which pricing option suits my needs best?
The pricing options vary based on user requirements and access needs. Individual users may opt for single-user licenses, while businesses requiring broader access may choose multi-user or enterprise licenses for cost-effective access to the report.
13. Are there any additional resources or data provided in the Dosimetry Equipment Industry report?
While the report offers comprehensive insights, it's advisable to review the specific contents or supplementary materials provided to ascertain if additional resources or data are available.
14. How can I stay updated on further developments or reports in the Dosimetry Equipment Industry?
To stay informed about further developments, trends, and reports in the Dosimetry Equipment Industry, consider subscribing to industry newsletters, following relevant companies and organizations, or regularly checking reputable industry news sources and publications.
Methodology
Step 1 - Identification of Relevant Samples Size from Population Database


Step 2 - Approaches for Defining Global Market Size (Value, Volume* & Price*)

Note*: In applicable scenarios
Step 3 - Data Sources
Primary Research
- Web Analytics
- Survey Reports
- Research Institute
- Latest Research Reports
- Opinion Leaders
Secondary Research
- Annual Reports
- White Paper
- Latest Press Release
- Industry Association
- Paid Database
- Investor Presentations

Step 4 - Data Triangulation
Involves using different sources of information in order to increase the validity of a study
These sources are likely to be stakeholders in a program - participants, other researchers, program staff, other community members, and so on.
Then we put all data in single framework & apply various statistical tools to find out the dynamic on the market.
During the analysis stage, feedback from the stakeholder groups would be compared to determine areas of agreement as well as areas of divergence
