

Key Insights
The global disposable automated pipette tip market is experiencing robust growth, driven by the increasing adoption of automation in various laboratory settings, including pharmaceutical research, clinical diagnostics, and academic research. The market's expansion is fueled by the rising demand for high-throughput screening, the need for improved accuracy and precision in liquid handling, and the growing focus on reducing human error in laboratory procedures. Key factors contributing to market growth include advancements in tip design, the development of innovative materials offering enhanced compatibility and performance, and the increasing availability of automated liquid handling systems integrated with disposable tips. The market is segmented based on tip type (filter, non-filter), material (polypropylene, polystyrene), volume, and application. Major players such as Corning, Tecan, Sartorius, and Eppendorf are actively investing in research and development to introduce advanced products, further driving market competitiveness and innovation. This competitive landscape fosters continuous improvement in product quality, features, and pricing, making automated pipette tips increasingly accessible to a broader range of laboratories.
Significant growth is projected for the forecast period (2025-2033), driven by the continued expansion of the biotechnology and pharmaceutical industries, alongside an increasing emphasis on high-throughput applications in genomics and proteomics. Furthermore, the growing awareness of the benefits of automation in terms of efficiency, cost-effectiveness, and reduced contamination risks is expected to contribute significantly to market expansion. Restraints to growth may include the high initial investment cost associated with automated liquid handling systems and the potential for increased waste generation from disposable tip usage. However, ongoing advancements in sustainable materials and recycling initiatives are expected to mitigate these concerns in the coming years. The market exhibits regional variations in growth rates, primarily influenced by factors such as the level of technological adoption, the size of the life sciences sector, and government funding for research and development.
Disposable Automated Pipette Tip Market Report: A Comprehensive Analysis (2019-2033)
This insightful report provides a comprehensive analysis of the global Disposable Automated Pipette Tip market, projecting a market valuation exceeding $XX million by 2033. The study meticulously examines market trends, competitive landscapes, and future growth prospects, offering invaluable insights for stakeholders across the life sciences and research sectors. Covering the period from 2019 to 2033, with a base year of 2025, this report is an indispensable resource for strategic decision-making.
Disposable Automated Pipette Tip Market Composition & Trends
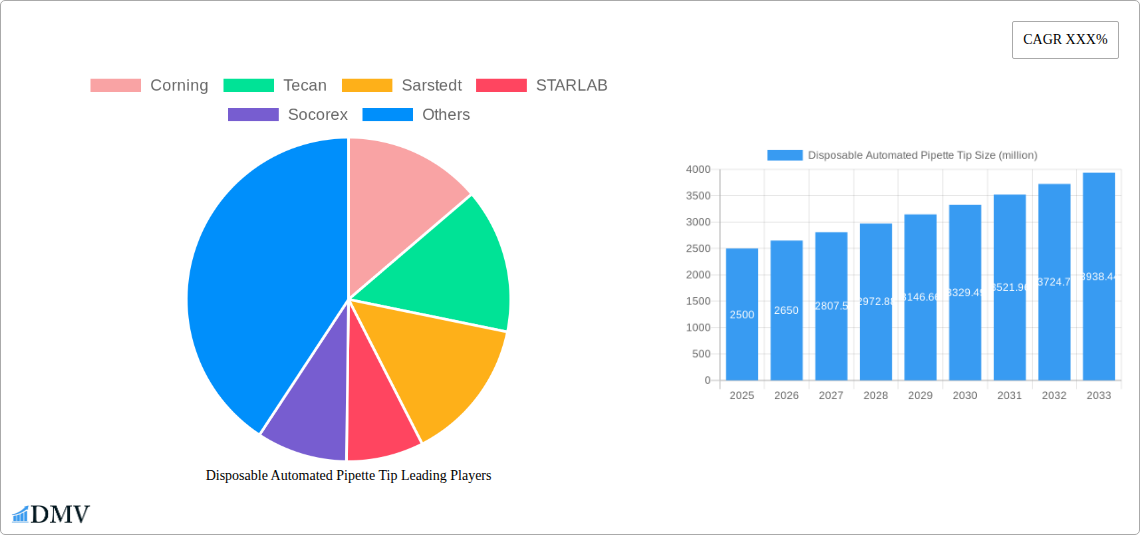
The Disposable Automated Pipette Tip market is characterized by a moderately concentrated landscape, with key players such as Corning, Tecan, Sarstedt, and Thermo Fisher Scientific holding significant market share. The market share distribution in 2025 is estimated as follows: Corning (15%), Tecan (12%), Sarstedt (10%), Thermo Fisher Scientific (8%), and others (55%). Innovation is a key driver, with continuous advancements in tip design, materials, and automation compatibility. Stringent regulatory frameworks, particularly concerning sterility and accuracy, significantly impact market dynamics. Substitute products are limited, primarily focusing on manual pipetting, although the efficiency and accuracy advantages of automated systems consistently drive market growth. End-users predominantly comprise pharmaceutical and biotechnology companies, research institutions, and clinical diagnostic laboratories. Significant M&A activity has been observed in recent years, with deal values exceeding $XX million annually.
- Market Concentration: Moderately concentrated, with top players holding approximately 40% market share in 2025.
- Innovation: Continuous improvements in material science, automation integration, and sterility assurance.
- Regulatory Landscape: Stringent guidelines on accuracy, sterility, and biocompatibility.
- Substitute Products: Limited, primarily manual pipetting.
- End-User Profile: Pharmaceutical, biotech, research institutions, and clinical diagnostics.
- M&A Activity: Significant activity, with total deal values exceeding $XX million annually (2019-2024).
Disposable Automated Pipette Tip Industry Evolution
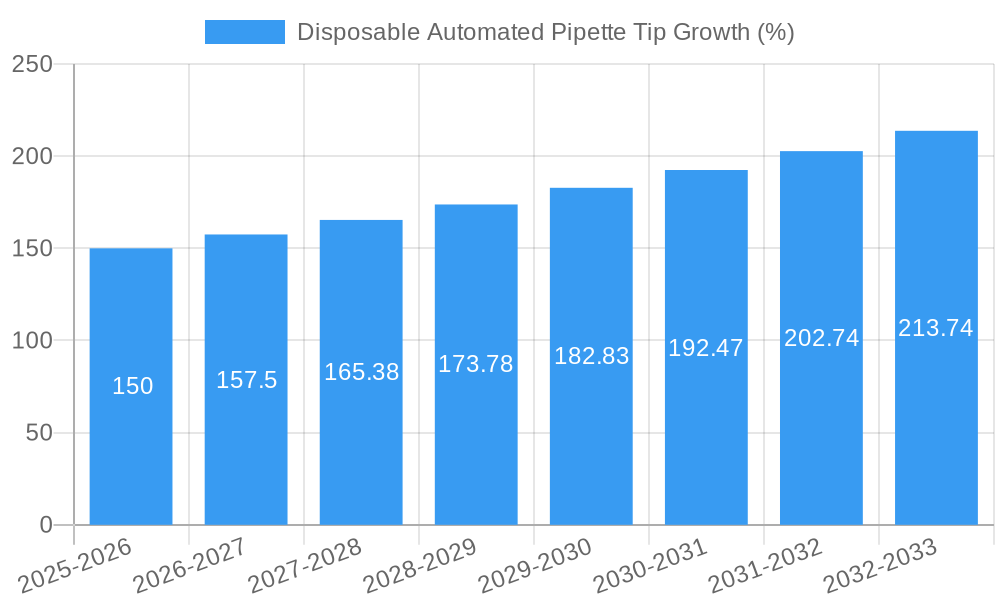
The Disposable Automated Pipette Tip market has witnessed robust growth, driven by the increasing adoption of automated liquid handling systems in high-throughput screening, genomics, and drug discovery. The market experienced a CAGR of xx% during the historical period (2019-2024) and is projected to maintain a CAGR of xx% during the forecast period (2025-2033). This growth is further fueled by technological advancements in tip design, such as filter tips for preventing aerosol contamination, and improved material compatibility for diverse applications. The rising demand for high-throughput screening and personalized medicine is significantly impacting consumer demand, leading to increased adoption of automated pipette tips across various research and clinical settings. The increasing focus on automation and efficiency across laboratories globally continues to propel market expansion.
Leading Regions, Countries, or Segments in Disposable Automated Pipette Tip
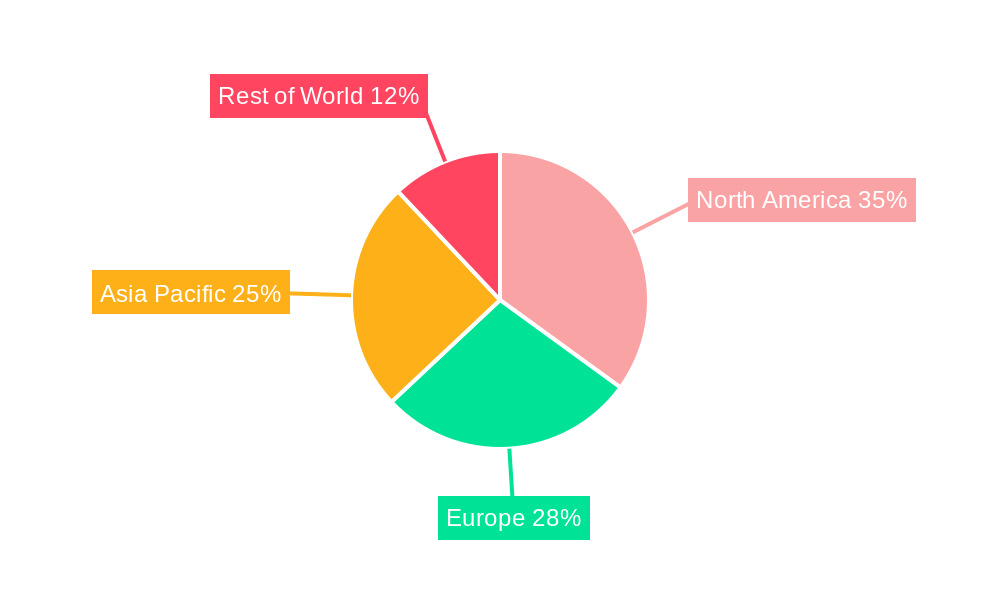
North America holds the dominant position in the global Disposable Automated Pipette Tip market, driven by substantial investments in life science research, robust regulatory frameworks supporting technological advancements, and the presence of major market players.
- Key Drivers in North America:
- High R&D spending in the pharmaceutical and biotechnology industries.
- Stringent regulatory approvals accelerating market entry of advanced products.
- Presence of key industry players and well-established supply chains.
- Europe's Growth: Europe's market is also significant due to the strong presence of research institutions and a growing focus on personalized medicine.
- Asia-Pacific's Potential: The Asia-Pacific region shows immense growth potential fueled by increasing investments in healthcare infrastructure and growing pharmaceutical and biotechnology sectors.
North America’s dominance stems from its established life science infrastructure, high R&D spending by pharmaceutical and biotech companies, and the early adoption of automation technologies. This strong foundation ensures continued leadership in the forecast period.
Disposable Automated Pipette Tip Product Innovations
Recent innovations include filter tips minimizing cross-contamination risks, low-retention tips reducing sample loss, and specialized tips for specific applications like PCR or cell culture. These improvements enhance accuracy, precision, and efficiency, contributing to the overall cost-effectiveness of high-throughput processes. Innovative materials are being explored, focusing on improved compatibility with various liquids and enhancing sterility. Unique selling propositions center around reduced sample loss, enhanced accuracy, and improved contamination control.
Propelling Factors for Disposable Automated Pipette Tip Growth
The growth of the Disposable Automated Pipette Tip market is propelled by several factors. Technological advancements, like the development of filter tips and low-retention tips, enhance accuracy and reduce sample loss. The increasing adoption of automation in laboratories globally drives demand. Furthermore, stringent regulatory requirements in several key markets necessitate the use of high-quality, sterile pipette tips, further boosting market growth. Economic growth and rising disposable incomes in several countries also positively impact the market.
Obstacles in the Disposable Automated Pipette Tip Market
Challenges include the impact of supply chain disruptions on raw material availability and manufacturing costs, leading to price volatility. Competitive pressures from numerous manufacturers result in price wars, impacting profitability. Regulatory hurdles for new product approvals and stringent quality control requirements can delay market entry and increase development costs. These factors can collectively affect the overall market growth rate.
Future Opportunities in Disposable Automated Pipette Tip
Emerging opportunities lie in the development of novel materials with enhanced biocompatibility and compatibility with a wider range of liquids. Expanding into emerging markets with growing healthcare infrastructures and R&D activities offers substantial potential. The integration of advanced technologies, such as AI-powered liquid handling systems, promises improved efficiency and precision, leading to increased demand for compatible pipette tips. Focusing on sustainable and eco-friendly materials provides a path for differentiation.
Major Players in the Disposable Automated Pipette Tip Ecosystem
- Corning
- Tecan
- Sarstedt
- STARLAB
- Socorex
- Thermo Fisher Scientific
- Sartorius
- Nichiryo
- Hamilton
- Brand
- Labcon
- Eppendorf
- Mettler Toledo
- DLAB
- Integra Biosciences
- Gilson
Key Developments in Disposable Automated Pipette Tip Industry
- 2022 Q4: Thermo Fisher Scientific launches a new line of filter tips with enhanced barrier technology.
- 2023 Q1: Sarstedt announces a strategic partnership with a major automated liquid handling system manufacturer.
- 2023 Q3: Corning introduces a new material for pipette tips improving compatibility with aggressive chemicals. (Further developments to be added as they occur)
Strategic Disposable Automated Pipette Tip Market Forecast
The Disposable Automated Pipette Tip market is poised for sustained growth, driven by continued advancements in automation technologies, the increasing adoption of high-throughput screening methods, and the expansion into new applications. The market's expansion will be further fueled by growing investments in life science research and a rising demand for high-quality, sterile, and precise pipette tips across various sectors. The forecast anticipates strong growth, with significant market penetration in emerging economies and a continued dominance of key players through strategic innovation and acquisitions.
Disposable Automated Pipette Tip Segmentation
-
1. Application
- 1.1. Industrial
- 1.2. Scientific Research
- 1.3. Hospital
- 1.4. Other
-
2. Type
- 2.1. Non-Filtered Pipette Tips
- 2.2. Filtered Pipette Tips
Disposable Automated Pipette Tip Segmentation By Geography
-
1. North America
- 1.1. United States
- 1.2. Canada
- 1.3. Mexico
-
2. South America
- 2.1. Brazil
- 2.2. Argentina
- 2.3. Rest of South America
-
3. Europe
- 3.1. United Kingdom
- 3.2. Germany
- 3.3. France
- 3.4. Italy
- 3.5. Spain
- 3.6. Russia
- 3.7. Benelux
- 3.8. Nordics
- 3.9. Rest of Europe
-
4. Middle East & Africa
- 4.1. Turkey
- 4.2. Israel
- 4.3. GCC
- 4.4. North Africa
- 4.5. South Africa
- 4.6. Rest of Middle East & Africa
-
5. Asia Pacific
- 5.1. China
- 5.2. India
- 5.3. Japan
- 5.4. South Korea
- 5.5. ASEAN
- 5.6. Oceania
- 5.7. Rest of Asia Pacific
Disposable Automated Pipette Tip REPORT HIGHLIGHTS
| Aspects | Details |
|---|---|
| Study Period | 2019-2033 |
| Base Year | 2024 |
| Estimated Year | 2025 |
| Forecast Period | 2025-2033 |
| Historical Period | 2019-2024 |
| Growth Rate | CAGR of XXX% from 2019-2033 |
| Segmentation |
|
Table of Contents
- 1. Introduction
- 1.1. Research Scope
- 1.2. Market Segmentation
- 1.3. Research Methodology
- 1.4. Definitions and Assumptions
- 2. Executive Summary
- 2.1. Introduction
- 3. Market Dynamics
- 3.1. Introduction
- 3.2. Market Drivers
- 3.3. Market Restrains
- 3.4. Market Trends
- 4. Market Factor Analysis
- 4.1. Porters Five Forces
- 4.2. Supply/Value Chain
- 4.3. PESTEL analysis
- 4.4. Market Entropy
- 4.5. Patent/Trademark Analysis
- 5. Global Disposable Automated Pipette Tip Analysis, Insights and Forecast, 2019-2031
- 5.1. Market Analysis, Insights and Forecast - by Application
- 5.1.1. Industrial
- 5.1.2. Scientific Research
- 5.1.3. Hospital
- 5.1.4. Other
- 5.2. Market Analysis, Insights and Forecast - by Type
- 5.2.1. Non-Filtered Pipette Tips
- 5.2.2. Filtered Pipette Tips
- 5.3. Market Analysis, Insights and Forecast - by Region
- 5.3.1. North America
- 5.3.2. South America
- 5.3.3. Europe
- 5.3.4. Middle East & Africa
- 5.3.5. Asia Pacific
- 5.1. Market Analysis, Insights and Forecast - by Application
- 6. North America Disposable Automated Pipette Tip Analysis, Insights and Forecast, 2019-2031
- 6.1. Market Analysis, Insights and Forecast - by Application
- 6.1.1. Industrial
- 6.1.2. Scientific Research
- 6.1.3. Hospital
- 6.1.4. Other
- 6.2. Market Analysis, Insights and Forecast - by Type
- 6.2.1. Non-Filtered Pipette Tips
- 6.2.2. Filtered Pipette Tips
- 6.1. Market Analysis, Insights and Forecast - by Application
- 7. South America Disposable Automated Pipette Tip Analysis, Insights and Forecast, 2019-2031
- 7.1. Market Analysis, Insights and Forecast - by Application
- 7.1.1. Industrial
- 7.1.2. Scientific Research
- 7.1.3. Hospital
- 7.1.4. Other
- 7.2. Market Analysis, Insights and Forecast - by Type
- 7.2.1. Non-Filtered Pipette Tips
- 7.2.2. Filtered Pipette Tips
- 7.1. Market Analysis, Insights and Forecast - by Application
- 8. Europe Disposable Automated Pipette Tip Analysis, Insights and Forecast, 2019-2031
- 8.1. Market Analysis, Insights and Forecast - by Application
- 8.1.1. Industrial
- 8.1.2. Scientific Research
- 8.1.3. Hospital
- 8.1.4. Other
- 8.2. Market Analysis, Insights and Forecast - by Type
- 8.2.1. Non-Filtered Pipette Tips
- 8.2.2. Filtered Pipette Tips
- 8.1. Market Analysis, Insights and Forecast - by Application
- 9. Middle East & Africa Disposable Automated Pipette Tip Analysis, Insights and Forecast, 2019-2031
- 9.1. Market Analysis, Insights and Forecast - by Application
- 9.1.1. Industrial
- 9.1.2. Scientific Research
- 9.1.3. Hospital
- 9.1.4. Other
- 9.2. Market Analysis, Insights and Forecast - by Type
- 9.2.1. Non-Filtered Pipette Tips
- 9.2.2. Filtered Pipette Tips
- 9.1. Market Analysis, Insights and Forecast - by Application
- 10. Asia Pacific Disposable Automated Pipette Tip Analysis, Insights and Forecast, 2019-2031
- 10.1. Market Analysis, Insights and Forecast - by Application
- 10.1.1. Industrial
- 10.1.2. Scientific Research
- 10.1.3. Hospital
- 10.1.4. Other
- 10.2. Market Analysis, Insights and Forecast - by Type
- 10.2.1. Non-Filtered Pipette Tips
- 10.2.2. Filtered Pipette Tips
- 10.1. Market Analysis, Insights and Forecast - by Application
- 11. Competitive Analysis
- 11.1. Global Market Share Analysis 2024
- 11.2. Company Profiles
- 11.2.1 Corning
- 11.2.1.1. Overview
- 11.2.1.2. Products
- 11.2.1.3. SWOT Analysis
- 11.2.1.4. Recent Developments
- 11.2.1.5. Financials (Based on Availability)
- 11.2.2 Tecan
- 11.2.2.1. Overview
- 11.2.2.2. Products
- 11.2.2.3. SWOT Analysis
- 11.2.2.4. Recent Developments
- 11.2.2.5. Financials (Based on Availability)
- 11.2.3 Sarstedt
- 11.2.3.1. Overview
- 11.2.3.2. Products
- 11.2.3.3. SWOT Analysis
- 11.2.3.4. Recent Developments
- 11.2.3.5. Financials (Based on Availability)
- 11.2.4 STARLAB
- 11.2.4.1. Overview
- 11.2.4.2. Products
- 11.2.4.3. SWOT Analysis
- 11.2.4.4. Recent Developments
- 11.2.4.5. Financials (Based on Availability)
- 11.2.5 Socorex
- 11.2.5.1. Overview
- 11.2.5.2. Products
- 11.2.5.3. SWOT Analysis
- 11.2.5.4. Recent Developments
- 11.2.5.5. Financials (Based on Availability)
- 11.2.6 Thermo Fisher Scientific
- 11.2.6.1. Overview
- 11.2.6.2. Products
- 11.2.6.3. SWOT Analysis
- 11.2.6.4. Recent Developments
- 11.2.6.5. Financials (Based on Availability)
- 11.2.7 Sartorius
- 11.2.7.1. Overview
- 11.2.7.2. Products
- 11.2.7.3. SWOT Analysis
- 11.2.7.4. Recent Developments
- 11.2.7.5. Financials (Based on Availability)
- 11.2.8 Nichiryo
- 11.2.8.1. Overview
- 11.2.8.2. Products
- 11.2.8.3. SWOT Analysis
- 11.2.8.4. Recent Developments
- 11.2.8.5. Financials (Based on Availability)
- 11.2.9 Hamilton
- 11.2.9.1. Overview
- 11.2.9.2. Products
- 11.2.9.3. SWOT Analysis
- 11.2.9.4. Recent Developments
- 11.2.9.5. Financials (Based on Availability)
- 11.2.10 Brand
- 11.2.10.1. Overview
- 11.2.10.2. Products
- 11.2.10.3. SWOT Analysis
- 11.2.10.4. Recent Developments
- 11.2.10.5. Financials (Based on Availability)
- 11.2.11 Labcon
- 11.2.11.1. Overview
- 11.2.11.2. Products
- 11.2.11.3. SWOT Analysis
- 11.2.11.4. Recent Developments
- 11.2.11.5. Financials (Based on Availability)
- 11.2.12 Eppendorf
- 11.2.12.1. Overview
- 11.2.12.2. Products
- 11.2.12.3. SWOT Analysis
- 11.2.12.4. Recent Developments
- 11.2.12.5. Financials (Based on Availability)
- 11.2.13 Mettler Toledo
- 11.2.13.1. Overview
- 11.2.13.2. Products
- 11.2.13.3. SWOT Analysis
- 11.2.13.4. Recent Developments
- 11.2.13.5. Financials (Based on Availability)
- 11.2.14 DLAB
- 11.2.14.1. Overview
- 11.2.14.2. Products
- 11.2.14.3. SWOT Analysis
- 11.2.14.4. Recent Developments
- 11.2.14.5. Financials (Based on Availability)
- 11.2.15 Integra Biosciences
- 11.2.15.1. Overview
- 11.2.15.2. Products
- 11.2.15.3. SWOT Analysis
- 11.2.15.4. Recent Developments
- 11.2.15.5. Financials (Based on Availability)
- 11.2.16 Gilson
- 11.2.16.1. Overview
- 11.2.16.2. Products
- 11.2.16.3. SWOT Analysis
- 11.2.16.4. Recent Developments
- 11.2.16.5. Financials (Based on Availability)
- 11.2.1 Corning
List of Figures
- Figure 1: Global Disposable Automated Pipette Tip Revenue Breakdown (million, %) by Region 2024 & 2032
- Figure 2: Global Disposable Automated Pipette Tip Volume Breakdown (K, %) by Region 2024 & 2032
- Figure 3: North America Disposable Automated Pipette Tip Revenue (million), by Application 2024 & 2032
- Figure 4: North America Disposable Automated Pipette Tip Volume (K), by Application 2024 & 2032
- Figure 5: North America Disposable Automated Pipette Tip Revenue Share (%), by Application 2024 & 2032
- Figure 6: North America Disposable Automated Pipette Tip Volume Share (%), by Application 2024 & 2032
- Figure 7: North America Disposable Automated Pipette Tip Revenue (million), by Type 2024 & 2032
- Figure 8: North America Disposable Automated Pipette Tip Volume (K), by Type 2024 & 2032
- Figure 9: North America Disposable Automated Pipette Tip Revenue Share (%), by Type 2024 & 2032
- Figure 10: North America Disposable Automated Pipette Tip Volume Share (%), by Type 2024 & 2032
- Figure 11: North America Disposable Automated Pipette Tip Revenue (million), by Country 2024 & 2032
- Figure 12: North America Disposable Automated Pipette Tip Volume (K), by Country 2024 & 2032
- Figure 13: North America Disposable Automated Pipette Tip Revenue Share (%), by Country 2024 & 2032
- Figure 14: North America Disposable Automated Pipette Tip Volume Share (%), by Country 2024 & 2032
- Figure 15: South America Disposable Automated Pipette Tip Revenue (million), by Application 2024 & 2032
- Figure 16: South America Disposable Automated Pipette Tip Volume (K), by Application 2024 & 2032
- Figure 17: South America Disposable Automated Pipette Tip Revenue Share (%), by Application 2024 & 2032
- Figure 18: South America Disposable Automated Pipette Tip Volume Share (%), by Application 2024 & 2032
- Figure 19: South America Disposable Automated Pipette Tip Revenue (million), by Type 2024 & 2032
- Figure 20: South America Disposable Automated Pipette Tip Volume (K), by Type 2024 & 2032
- Figure 21: South America Disposable Automated Pipette Tip Revenue Share (%), by Type 2024 & 2032
- Figure 22: South America Disposable Automated Pipette Tip Volume Share (%), by Type 2024 & 2032
- Figure 23: South America Disposable Automated Pipette Tip Revenue (million), by Country 2024 & 2032
- Figure 24: South America Disposable Automated Pipette Tip Volume (K), by Country 2024 & 2032
- Figure 25: South America Disposable Automated Pipette Tip Revenue Share (%), by Country 2024 & 2032
- Figure 26: South America Disposable Automated Pipette Tip Volume Share (%), by Country 2024 & 2032
- Figure 27: Europe Disposable Automated Pipette Tip Revenue (million), by Application 2024 & 2032
- Figure 28: Europe Disposable Automated Pipette Tip Volume (K), by Application 2024 & 2032
- Figure 29: Europe Disposable Automated Pipette Tip Revenue Share (%), by Application 2024 & 2032
- Figure 30: Europe Disposable Automated Pipette Tip Volume Share (%), by Application 2024 & 2032
- Figure 31: Europe Disposable Automated Pipette Tip Revenue (million), by Type 2024 & 2032
- Figure 32: Europe Disposable Automated Pipette Tip Volume (K), by Type 2024 & 2032
- Figure 33: Europe Disposable Automated Pipette Tip Revenue Share (%), by Type 2024 & 2032
- Figure 34: Europe Disposable Automated Pipette Tip Volume Share (%), by Type 2024 & 2032
- Figure 35: Europe Disposable Automated Pipette Tip Revenue (million), by Country 2024 & 2032
- Figure 36: Europe Disposable Automated Pipette Tip Volume (K), by Country 2024 & 2032
- Figure 37: Europe Disposable Automated Pipette Tip Revenue Share (%), by Country 2024 & 2032
- Figure 38: Europe Disposable Automated Pipette Tip Volume Share (%), by Country 2024 & 2032
- Figure 39: Middle East & Africa Disposable Automated Pipette Tip Revenue (million), by Application 2024 & 2032
- Figure 40: Middle East & Africa Disposable Automated Pipette Tip Volume (K), by Application 2024 & 2032
- Figure 41: Middle East & Africa Disposable Automated Pipette Tip Revenue Share (%), by Application 2024 & 2032
- Figure 42: Middle East & Africa Disposable Automated Pipette Tip Volume Share (%), by Application 2024 & 2032
- Figure 43: Middle East & Africa Disposable Automated Pipette Tip Revenue (million), by Type 2024 & 2032
- Figure 44: Middle East & Africa Disposable Automated Pipette Tip Volume (K), by Type 2024 & 2032
- Figure 45: Middle East & Africa Disposable Automated Pipette Tip Revenue Share (%), by Type 2024 & 2032
- Figure 46: Middle East & Africa Disposable Automated Pipette Tip Volume Share (%), by Type 2024 & 2032
- Figure 47: Middle East & Africa Disposable Automated Pipette Tip Revenue (million), by Country 2024 & 2032
- Figure 48: Middle East & Africa Disposable Automated Pipette Tip Volume (K), by Country 2024 & 2032
- Figure 49: Middle East & Africa Disposable Automated Pipette Tip Revenue Share (%), by Country 2024 & 2032
- Figure 50: Middle East & Africa Disposable Automated Pipette Tip Volume Share (%), by Country 2024 & 2032
- Figure 51: Asia Pacific Disposable Automated Pipette Tip Revenue (million), by Application 2024 & 2032
- Figure 52: Asia Pacific Disposable Automated Pipette Tip Volume (K), by Application 2024 & 2032
- Figure 53: Asia Pacific Disposable Automated Pipette Tip Revenue Share (%), by Application 2024 & 2032
- Figure 54: Asia Pacific Disposable Automated Pipette Tip Volume Share (%), by Application 2024 & 2032
- Figure 55: Asia Pacific Disposable Automated Pipette Tip Revenue (million), by Type 2024 & 2032
- Figure 56: Asia Pacific Disposable Automated Pipette Tip Volume (K), by Type 2024 & 2032
- Figure 57: Asia Pacific Disposable Automated Pipette Tip Revenue Share (%), by Type 2024 & 2032
- Figure 58: Asia Pacific Disposable Automated Pipette Tip Volume Share (%), by Type 2024 & 2032
- Figure 59: Asia Pacific Disposable Automated Pipette Tip Revenue (million), by Country 2024 & 2032
- Figure 60: Asia Pacific Disposable Automated Pipette Tip Volume (K), by Country 2024 & 2032
- Figure 61: Asia Pacific Disposable Automated Pipette Tip Revenue Share (%), by Country 2024 & 2032
- Figure 62: Asia Pacific Disposable Automated Pipette Tip Volume Share (%), by Country 2024 & 2032
List of Tables
- Table 1: Global Disposable Automated Pipette Tip Revenue million Forecast, by Region 2019 & 2032
- Table 2: Global Disposable Automated Pipette Tip Volume K Forecast, by Region 2019 & 2032
- Table 3: Global Disposable Automated Pipette Tip Revenue million Forecast, by Application 2019 & 2032
- Table 4: Global Disposable Automated Pipette Tip Volume K Forecast, by Application 2019 & 2032
- Table 5: Global Disposable Automated Pipette Tip Revenue million Forecast, by Type 2019 & 2032
- Table 6: Global Disposable Automated Pipette Tip Volume K Forecast, by Type 2019 & 2032
- Table 7: Global Disposable Automated Pipette Tip Revenue million Forecast, by Region 2019 & 2032
- Table 8: Global Disposable Automated Pipette Tip Volume K Forecast, by Region 2019 & 2032
- Table 9: Global Disposable Automated Pipette Tip Revenue million Forecast, by Application 2019 & 2032
- Table 10: Global Disposable Automated Pipette Tip Volume K Forecast, by Application 2019 & 2032
- Table 11: Global Disposable Automated Pipette Tip Revenue million Forecast, by Type 2019 & 2032
- Table 12: Global Disposable Automated Pipette Tip Volume K Forecast, by Type 2019 & 2032
- Table 13: Global Disposable Automated Pipette Tip Revenue million Forecast, by Country 2019 & 2032
- Table 14: Global Disposable Automated Pipette Tip Volume K Forecast, by Country 2019 & 2032
- Table 15: United States Disposable Automated Pipette Tip Revenue (million) Forecast, by Application 2019 & 2032
- Table 16: United States Disposable Automated Pipette Tip Volume (K) Forecast, by Application 2019 & 2032
- Table 17: Canada Disposable Automated Pipette Tip Revenue (million) Forecast, by Application 2019 & 2032
- Table 18: Canada Disposable Automated Pipette Tip Volume (K) Forecast, by Application 2019 & 2032
- Table 19: Mexico Disposable Automated Pipette Tip Revenue (million) Forecast, by Application 2019 & 2032
- Table 20: Mexico Disposable Automated Pipette Tip Volume (K) Forecast, by Application 2019 & 2032
- Table 21: Global Disposable Automated Pipette Tip Revenue million Forecast, by Application 2019 & 2032
- Table 22: Global Disposable Automated Pipette Tip Volume K Forecast, by Application 2019 & 2032
- Table 23: Global Disposable Automated Pipette Tip Revenue million Forecast, by Type 2019 & 2032
- Table 24: Global Disposable Automated Pipette Tip Volume K Forecast, by Type 2019 & 2032
- Table 25: Global Disposable Automated Pipette Tip Revenue million Forecast, by Country 2019 & 2032
- Table 26: Global Disposable Automated Pipette Tip Volume K Forecast, by Country 2019 & 2032
- Table 27: Brazil Disposable Automated Pipette Tip Revenue (million) Forecast, by Application 2019 & 2032
- Table 28: Brazil Disposable Automated Pipette Tip Volume (K) Forecast, by Application 2019 & 2032
- Table 29: Argentina Disposable Automated Pipette Tip Revenue (million) Forecast, by Application 2019 & 2032
- Table 30: Argentina Disposable Automated Pipette Tip Volume (K) Forecast, by Application 2019 & 2032
- Table 31: Rest of South America Disposable Automated Pipette Tip Revenue (million) Forecast, by Application 2019 & 2032
- Table 32: Rest of South America Disposable Automated Pipette Tip Volume (K) Forecast, by Application 2019 & 2032
- Table 33: Global Disposable Automated Pipette Tip Revenue million Forecast, by Application 2019 & 2032
- Table 34: Global Disposable Automated Pipette Tip Volume K Forecast, by Application 2019 & 2032
- Table 35: Global Disposable Automated Pipette Tip Revenue million Forecast, by Type 2019 & 2032
- Table 36: Global Disposable Automated Pipette Tip Volume K Forecast, by Type 2019 & 2032
- Table 37: Global Disposable Automated Pipette Tip Revenue million Forecast, by Country 2019 & 2032
- Table 38: Global Disposable Automated Pipette Tip Volume K Forecast, by Country 2019 & 2032
- Table 39: United Kingdom Disposable Automated Pipette Tip Revenue (million) Forecast, by Application 2019 & 2032
- Table 40: United Kingdom Disposable Automated Pipette Tip Volume (K) Forecast, by Application 2019 & 2032
- Table 41: Germany Disposable Automated Pipette Tip Revenue (million) Forecast, by Application 2019 & 2032
- Table 42: Germany Disposable Automated Pipette Tip Volume (K) Forecast, by Application 2019 & 2032
- Table 43: France Disposable Automated Pipette Tip Revenue (million) Forecast, by Application 2019 & 2032
- Table 44: France Disposable Automated Pipette Tip Volume (K) Forecast, by Application 2019 & 2032
- Table 45: Italy Disposable Automated Pipette Tip Revenue (million) Forecast, by Application 2019 & 2032
- Table 46: Italy Disposable Automated Pipette Tip Volume (K) Forecast, by Application 2019 & 2032
- Table 47: Spain Disposable Automated Pipette Tip Revenue (million) Forecast, by Application 2019 & 2032
- Table 48: Spain Disposable Automated Pipette Tip Volume (K) Forecast, by Application 2019 & 2032
- Table 49: Russia Disposable Automated Pipette Tip Revenue (million) Forecast, by Application 2019 & 2032
- Table 50: Russia Disposable Automated Pipette Tip Volume (K) Forecast, by Application 2019 & 2032
- Table 51: Benelux Disposable Automated Pipette Tip Revenue (million) Forecast, by Application 2019 & 2032
- Table 52: Benelux Disposable Automated Pipette Tip Volume (K) Forecast, by Application 2019 & 2032
- Table 53: Nordics Disposable Automated Pipette Tip Revenue (million) Forecast, by Application 2019 & 2032
- Table 54: Nordics Disposable Automated Pipette Tip Volume (K) Forecast, by Application 2019 & 2032
- Table 55: Rest of Europe Disposable Automated Pipette Tip Revenue (million) Forecast, by Application 2019 & 2032
- Table 56: Rest of Europe Disposable Automated Pipette Tip Volume (K) Forecast, by Application 2019 & 2032
- Table 57: Global Disposable Automated Pipette Tip Revenue million Forecast, by Application 2019 & 2032
- Table 58: Global Disposable Automated Pipette Tip Volume K Forecast, by Application 2019 & 2032
- Table 59: Global Disposable Automated Pipette Tip Revenue million Forecast, by Type 2019 & 2032
- Table 60: Global Disposable Automated Pipette Tip Volume K Forecast, by Type 2019 & 2032
- Table 61: Global Disposable Automated Pipette Tip Revenue million Forecast, by Country 2019 & 2032
- Table 62: Global Disposable Automated Pipette Tip Volume K Forecast, by Country 2019 & 2032
- Table 63: Turkey Disposable Automated Pipette Tip Revenue (million) Forecast, by Application 2019 & 2032
- Table 64: Turkey Disposable Automated Pipette Tip Volume (K) Forecast, by Application 2019 & 2032
- Table 65: Israel Disposable Automated Pipette Tip Revenue (million) Forecast, by Application 2019 & 2032
- Table 66: Israel Disposable Automated Pipette Tip Volume (K) Forecast, by Application 2019 & 2032
- Table 67: GCC Disposable Automated Pipette Tip Revenue (million) Forecast, by Application 2019 & 2032
- Table 68: GCC Disposable Automated Pipette Tip Volume (K) Forecast, by Application 2019 & 2032
- Table 69: North Africa Disposable Automated Pipette Tip Revenue (million) Forecast, by Application 2019 & 2032
- Table 70: North Africa Disposable Automated Pipette Tip Volume (K) Forecast, by Application 2019 & 2032
- Table 71: South Africa Disposable Automated Pipette Tip Revenue (million) Forecast, by Application 2019 & 2032
- Table 72: South Africa Disposable Automated Pipette Tip Volume (K) Forecast, by Application 2019 & 2032
- Table 73: Rest of Middle East & Africa Disposable Automated Pipette Tip Revenue (million) Forecast, by Application 2019 & 2032
- Table 74: Rest of Middle East & Africa Disposable Automated Pipette Tip Volume (K) Forecast, by Application 2019 & 2032
- Table 75: Global Disposable Automated Pipette Tip Revenue million Forecast, by Application 2019 & 2032
- Table 76: Global Disposable Automated Pipette Tip Volume K Forecast, by Application 2019 & 2032
- Table 77: Global Disposable Automated Pipette Tip Revenue million Forecast, by Type 2019 & 2032
- Table 78: Global Disposable Automated Pipette Tip Volume K Forecast, by Type 2019 & 2032
- Table 79: Global Disposable Automated Pipette Tip Revenue million Forecast, by Country 2019 & 2032
- Table 80: Global Disposable Automated Pipette Tip Volume K Forecast, by Country 2019 & 2032
- Table 81: China Disposable Automated Pipette Tip Revenue (million) Forecast, by Application 2019 & 2032
- Table 82: China Disposable Automated Pipette Tip Volume (K) Forecast, by Application 2019 & 2032
- Table 83: India Disposable Automated Pipette Tip Revenue (million) Forecast, by Application 2019 & 2032
- Table 84: India Disposable Automated Pipette Tip Volume (K) Forecast, by Application 2019 & 2032
- Table 85: Japan Disposable Automated Pipette Tip Revenue (million) Forecast, by Application 2019 & 2032
- Table 86: Japan Disposable Automated Pipette Tip Volume (K) Forecast, by Application 2019 & 2032
- Table 87: South Korea Disposable Automated Pipette Tip Revenue (million) Forecast, by Application 2019 & 2032
- Table 88: South Korea Disposable Automated Pipette Tip Volume (K) Forecast, by Application 2019 & 2032
- Table 89: ASEAN Disposable Automated Pipette Tip Revenue (million) Forecast, by Application 2019 & 2032
- Table 90: ASEAN Disposable Automated Pipette Tip Volume (K) Forecast, by Application 2019 & 2032
- Table 91: Oceania Disposable Automated Pipette Tip Revenue (million) Forecast, by Application 2019 & 2032
- Table 92: Oceania Disposable Automated Pipette Tip Volume (K) Forecast, by Application 2019 & 2032
- Table 93: Rest of Asia Pacific Disposable Automated Pipette Tip Revenue (million) Forecast, by Application 2019 & 2032
- Table 94: Rest of Asia Pacific Disposable Automated Pipette Tip Volume (K) Forecast, by Application 2019 & 2032
Frequently Asked Questions
1. What is the projected Compound Annual Growth Rate (CAGR) of the Disposable Automated Pipette Tip?
The projected CAGR is approximately XXX%.
2. Which companies are prominent players in the Disposable Automated Pipette Tip?
Key companies in the market include Corning, Tecan, Sarstedt, STARLAB, Socorex, Thermo Fisher Scientific, Sartorius, Nichiryo, Hamilton, Brand, Labcon, Eppendorf, Mettler Toledo, DLAB, Integra Biosciences, Gilson.
3. What are the main segments of the Disposable Automated Pipette Tip?
The market segments include Application, Type.
4. Can you provide details about the market size?
The market size is estimated to be USD XXX million as of 2022.
5. What are some drivers contributing to market growth?
N/A
6. What are the notable trends driving market growth?
N/A
7. Are there any restraints impacting market growth?
N/A
8. Can you provide examples of recent developments in the market?
N/A
9. What pricing options are available for accessing the report?
Pricing options include single-user, multi-user, and enterprise licenses priced at USD 3950.00, USD 5925.00, and USD 7900.00 respectively.
10. Is the market size provided in terms of value or volume?
The market size is provided in terms of value, measured in million and volume, measured in K.
11. Are there any specific market keywords associated with the report?
Yes, the market keyword associated with the report is "Disposable Automated Pipette Tip," which aids in identifying and referencing the specific market segment covered.
12. How do I determine which pricing option suits my needs best?
The pricing options vary based on user requirements and access needs. Individual users may opt for single-user licenses, while businesses requiring broader access may choose multi-user or enterprise licenses for cost-effective access to the report.
13. Are there any additional resources or data provided in the Disposable Automated Pipette Tip report?
While the report offers comprehensive insights, it's advisable to review the specific contents or supplementary materials provided to ascertain if additional resources or data are available.
14. How can I stay updated on further developments or reports in the Disposable Automated Pipette Tip?
To stay informed about further developments, trends, and reports in the Disposable Automated Pipette Tip, consider subscribing to industry newsletters, following relevant companies and organizations, or regularly checking reputable industry news sources and publications.
Methodology
Step 1 - Identification of Relevant Samples Size from Population Database


Step 2 - Approaches for Defining Global Market Size (Value, Volume* & Price*)

Note*: In applicable scenarios
Step 3 - Data Sources
Primary Research
- Web Analytics
- Survey Reports
- Research Institute
- Latest Research Reports
- Opinion Leaders
Secondary Research
- Annual Reports
- White Paper
- Latest Press Release
- Industry Association
- Paid Database
- Investor Presentations

Step 4 - Data Triangulation
Involves using different sources of information in order to increase the validity of a study
These sources are likely to be stakeholders in a program - participants, other researchers, program staff, other community members, and so on.
Then we put all data in single framework & apply various statistical tools to find out the dynamic on the market.
During the analysis stage, feedback from the stakeholder groups would be compared to determine areas of agreement as well as areas of divergence
