

Key Insights
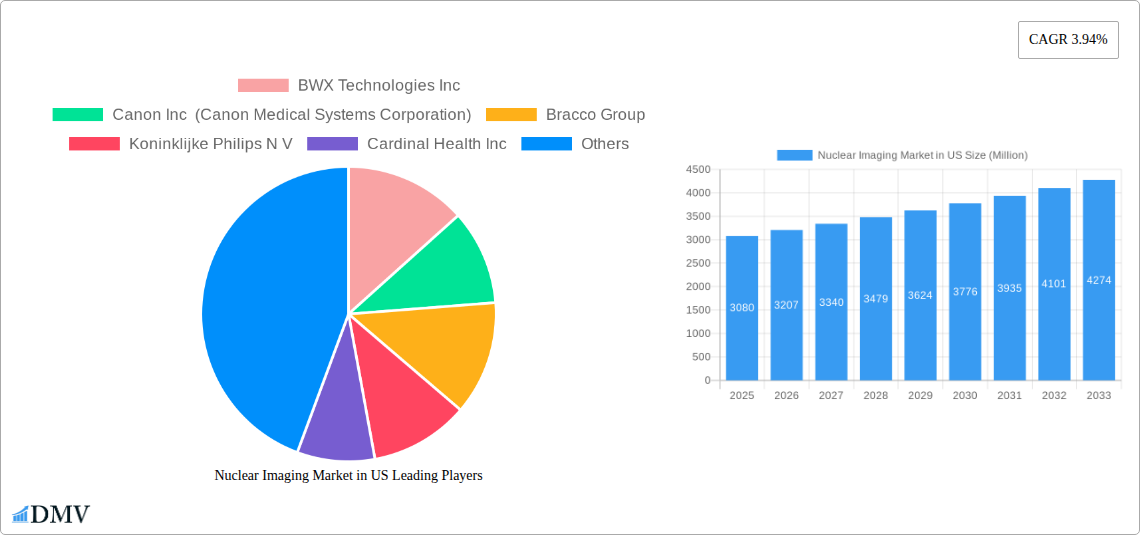
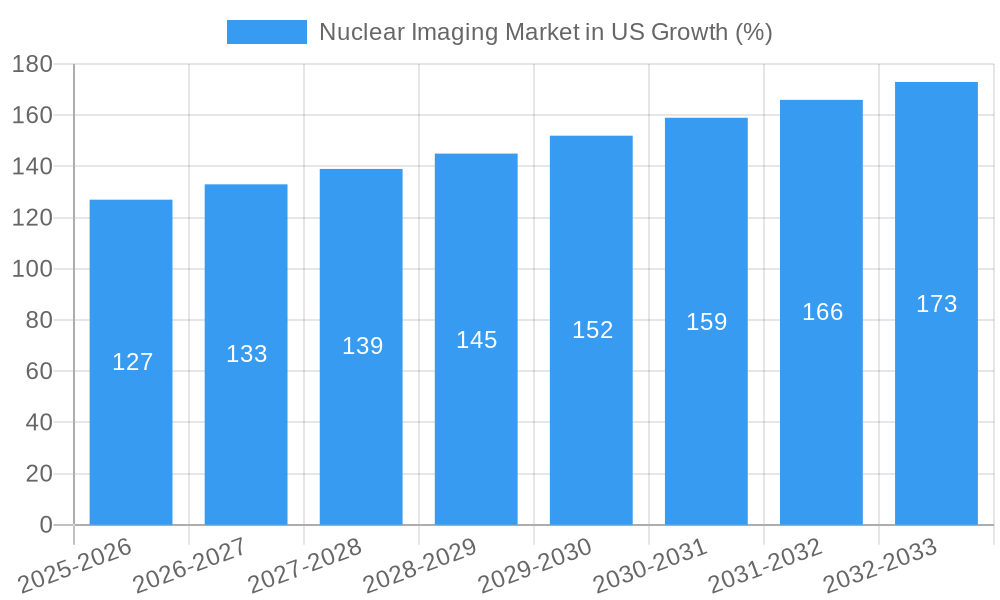
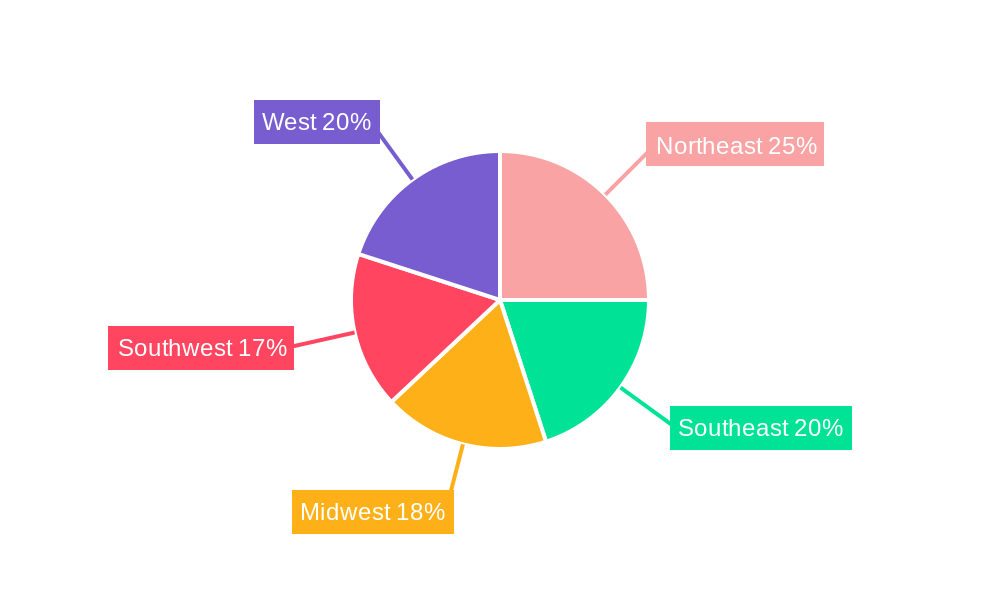
The US nuclear imaging market, valued at approximately $3.08 billion in 2025, is projected to experience robust growth, driven by a rising geriatric population, increasing prevalence of chronic diseases like cancer and cardiovascular ailments, and technological advancements leading to more sophisticated and precise imaging techniques. The market's Compound Annual Growth Rate (CAGR) of 3.94% from 2025 to 2033 indicates a steady expansion, with significant contributions from both equipment sales (SPECT and PET scanners) and radioisotope supply. The increasing adoption of hybrid imaging modalities, combining PET and CT or SPECT and CT, further fuels market expansion by providing comprehensive diagnostic information. While regulatory hurdles and high equipment costs present challenges, the rising demand for improved diagnostic capabilities in oncology, cardiology, and neurology will likely outweigh these constraints. Competition among major players like GE Healthcare, Siemens Healthineers, and Philips, characterized by continuous innovation in scanner technology and radiopharmaceutical development, is intensifying, leading to improved image quality, reduced examination time, and enhanced patient comfort. The segmentation by application (SPECT and PET) reflects the diverse clinical applications of nuclear imaging, showcasing the significant market potential within different disease areas. Regional analysis focusing on the US (Northeast, Southeast, Midwest, Southwest, and West) would reveal variations in market growth based on healthcare infrastructure, population density, and the prevalence of target diseases.
The substantial growth in the US nuclear imaging market is anticipated to continue due to factors such as government initiatives promoting early disease detection and improved healthcare infrastructure. The increasing availability of advanced imaging techniques and the growing number of specialized imaging centers across various regions of the US contribute significantly to the market expansion. Furthermore, the continuous investment in research and development by key market players is leading to the introduction of novel radiopharmaceuticals and improved imaging technologies, driving market growth. However, factors such as the high cost of equipment and the need for skilled professionals to operate these machines are likely to present challenges to market growth. The strategic collaborations between pharmaceutical companies and medical device manufacturers in developing integrated solutions for nuclear medicine also contributes significantly to the market’s growth trajectory.
Nuclear Imaging Market in US: A Comprehensive Market Report (2019-2033)
This insightful report provides a detailed analysis of the Nuclear Imaging Market in the US, offering a comprehensive overview of market trends, competitive landscape, and future growth prospects. The study period spans from 2019 to 2033, with 2025 serving as the base and estimated year. The report leverages extensive data analysis and expert insights to provide stakeholders with actionable intelligence for strategic decision-making. The US Nuclear Imaging market is projected to reach xx Million by 2033.
Nuclear Imaging Market in US Market Composition & Trends
The US nuclear imaging market is characterized by a moderately concentrated landscape, with key players holding significant market share. Market share distribution varies across segments, with Equipment and PET Application commanding larger proportions. Innovation is driven by advancements in radioisotope technology, detector sensitivity, and image processing algorithms. The regulatory landscape, primarily governed by the FDA, plays a crucial role in product approvals and market access. Substitute products, such as MRI and CT scans, exert competitive pressure, while the market experiences continuous M&A activity, aiming for portfolio expansion and technological synergy. Significant M&A deals in the past five years have involved transactions valued at approximately xx Million, shaping the competitive landscape.
- Market Concentration: Moderately concentrated, with top 5 players holding approximately xx% market share.
- Innovation Catalysts: Advancements in radioisotope technology, AI-driven image analysis, and miniaturization of equipment.
- Regulatory Landscape: Primarily governed by FDA approvals and safety regulations.
- Substitute Products: MRI, CT scans, and ultrasound present competitive alternatives.
- End-User Profiles: Hospitals, diagnostic imaging centers, research institutions, and outpatient clinics.
- M&A Activity: Significant consolidation through mergers and acquisitions valued at approximately xx Million in the last 5 years.
Nuclear Imaging Market in US Industry Evolution
The US nuclear imaging market has witnessed consistent growth throughout the historical period (2019-2024), driven primarily by the increasing prevalence of chronic diseases, technological advancements enhancing image quality and diagnostic accuracy, and growing demand for minimally invasive procedures. The market experienced a Compound Annual Growth Rate (CAGR) of xx% during this period. Technological advancements, such as the introduction of novel radiotracers and improved image reconstruction techniques, significantly influenced this growth. The rising adoption of PET/CT scanners and SPECT/CT systems has further fueled market expansion. Furthermore, shifting consumer demands towards improved diagnostics and personalized medicine have driven growth. The forecast period (2025-2033) anticipates a CAGR of xx%, driven by factors such as an aging population, increasing prevalence of cancer, and continued technological advancements within the field.
Leading Regions, Countries, or Segments in Nuclear Imaging Market in US
The Northeast and West Coast regions of the US dominate the nuclear imaging market due to the high concentration of advanced medical facilities, research institutions, and a higher prevalence of chronic diseases requiring advanced diagnostics. Within product segments, Equipment (primarily PET/CT and SPECT/CT systems) and PET Application hold significant shares due to their wide adoption in oncology and cardiology. Diagnostic Radioisotopes are crucial for the functioning of the entire imaging process.
- Key Drivers for Dominant Regions: High concentration of healthcare facilities, robust research infrastructure, and higher prevalence of target diseases.
- Key Drivers for Dominant Segments (Equipment): Technological advancements, increasing demand for advanced diagnostic procedures, and reimbursement policies.
- Key Drivers for Dominant Segments (PET Application): Increasing prevalence of cancer and other diseases suitable for PET imaging, high diagnostic accuracy, and improved patient outcomes.
Nuclear Imaging Market in US Product Innovations
Recent product innovations focus on improving image resolution, reducing radiation exposure, and enhancing diagnostic accuracy. Advancements include the development of novel radiotracers with improved specificity and sensitivity, along with the integration of artificial intelligence (AI) algorithms for automated image analysis. These innovations allow for faster diagnosis, better treatment planning, and improved patient outcomes. The integration of AI and machine learning into imaging systems is a significant trend, enhancing image quality and automating workflow processes.
Propelling Factors for Nuclear Imaging Market in US Growth
Several factors fuel the growth of the US nuclear imaging market. Technological advancements in imaging technology, including improved detector sensitivity and faster image acquisition, are key drivers. The increasing prevalence of chronic diseases, particularly cancer, necessitates advanced diagnostic capabilities, fostering market expansion. Government initiatives and favorable reimbursement policies further stimulate market growth. The rising awareness among healthcare professionals and patients about the benefits of nuclear imaging enhances its adoption.
Obstacles in the Nuclear Imaging Market in US Market
Challenges in the market include stringent regulatory pathways for new product approvals which can create delays and increase costs, supply chain disruptions affecting the availability of radioisotopes and imaging equipment, and competitive pressure from alternative imaging modalities (MRI, CT). These factors can impact the market's growth trajectory and profitability. The high cost of imaging procedures may limit accessibility for certain patient populations.
Future Opportunities in Nuclear Imaging Market in US
Future opportunities lie in the development of novel radiotracers for improved disease detection and targeted therapy, the integration of advanced analytics and AI for image analysis, the expansion of theranostics—combining diagnostics and therapeutics—and the growth of molecular imaging for early disease detection. Exploring new applications beyond oncology, such as in cardiology and neurology, presents substantial market potential.
Major Players in the Nuclear Imaging Market in US Ecosystem
- BWX Technologies Inc
- Canon Inc (Canon Medical Systems Corporation)
- Bracco Group
- Koninklijke Philips N V
- Cardinal Health Inc
- Siemens Healthineers AG
- Novartis AG (Advanced Accelerator Applications)
- GE Healthcare
- Curium
- Fujifilm Holdings Corporation
Key Developments in Nuclear Imaging Market in US Industry
- June 2022: The Mars Shot Fund, launched by SNMMI, aims to raise USD 100 Million for nuclear medicine research, receiving initial pledges of USD 600,000. This reflects a growing commitment to advancing the field.
- March 2022: Canon Medical Systems USA, Inc. launched the "Canon Across America" mobile tour, showcasing cutting-edge AI medical technology across the US. This initiative promotes accessibility and adoption of new technologies.
Strategic Nuclear Imaging Market in US Market Forecast
The US nuclear imaging market is poised for sustained growth driven by technological advancements, an aging population, increasing prevalence of chronic diseases, and expanding applications. The market's future trajectory will be shaped by continuous innovation, particularly in radiotracer development and AI-driven image analysis. Opportunities abound in expanding theranostics and molecular imaging applications, leading to improved patient outcomes and market expansion.
Nuclear Imaging Market in US Segmentation
-
1. Product
- 1.1. Equipment
-
1.2. Diagnostic Radioisotope
- 1.2.1. SPECT Radioisotopes
- 1.2.2. PET Radioisotopes
-
2. Application
-
2.1. SPECT Application
- 2.1.1. Cardiology
- 2.1.2. Neurology
- 2.1.3. Thyroid
- 2.1.4. Other SPECT Applications
-
2.2. PET Application
- 2.2.1. Oncology
- 2.2.2. Other PET Applications
-
2.1. SPECT Application
Nuclear Imaging Market in US Segmentation By Geography
-
1. North America
- 1.1. United States
- 1.2. Canada
- 1.3. Mexico
-
2. South America
- 2.1. Brazil
- 2.2. Argentina
- 2.3. Rest of South America
-
3. Europe
- 3.1. United Kingdom
- 3.2. Germany
- 3.3. France
- 3.4. Italy
- 3.5. Spain
- 3.6. Russia
- 3.7. Benelux
- 3.8. Nordics
- 3.9. Rest of Europe
-
4. Middle East & Africa
- 4.1. Turkey
- 4.2. Israel
- 4.3. GCC
- 4.4. North Africa
- 4.5. South Africa
- 4.6. Rest of Middle East & Africa
-
5. Asia Pacific
- 5.1. China
- 5.2. India
- 5.3. Japan
- 5.4. South Korea
- 5.5. ASEAN
- 5.6. Oceania
- 5.7. Rest of Asia Pacific
Nuclear Imaging Market in US REPORT HIGHLIGHTS
| Aspects | Details |
|---|---|
| Study Period | 2019-2033 |
| Base Year | 2024 |
| Estimated Year | 2025 |
| Forecast Period | 2025-2033 |
| Historical Period | 2019-2024 |
| Growth Rate | CAGR of 3.94% from 2019-2033 |
| Segmentation |
|
Table of Contents
- 1. Introduction
- 1.1. Research Scope
- 1.2. Market Segmentation
- 1.3. Research Methodology
- 1.4. Definitions and Assumptions
- 2. Executive Summary
- 2.1. Introduction
- 3. Market Dynamics
- 3.1. Introduction
- 3.2. Market Drivers
- 3.2.1. Increasing Prevalence of Chronic Diseases; Rising Geriatric Population; Increasing Technological Advancements
- 3.3. Market Restrains
- 3.3.1. Lack Of Proper Reimbursement And Stringent Regulatory Approval Procedures; High Cost of Equipment
- 3.4. Market Trends
- 3.4.1. Equipment Segment is Expected to Hold a Significant Market Share Over the Forecast Period
- 4. Market Factor Analysis
- 4.1. Porters Five Forces
- 4.2. Supply/Value Chain
- 4.3. PESTEL analysis
- 4.4. Market Entropy
- 4.5. Patent/Trademark Analysis
- 5. Global Nuclear Imaging Market in US Analysis, Insights and Forecast, 2019-2031
- 5.1. Market Analysis, Insights and Forecast - by Product
- 5.1.1. Equipment
- 5.1.2. Diagnostic Radioisotope
- 5.1.2.1. SPECT Radioisotopes
- 5.1.2.2. PET Radioisotopes
- 5.2. Market Analysis, Insights and Forecast - by Application
- 5.2.1. SPECT Application
- 5.2.1.1. Cardiology
- 5.2.1.2. Neurology
- 5.2.1.3. Thyroid
- 5.2.1.4. Other SPECT Applications
- 5.2.2. PET Application
- 5.2.2.1. Oncology
- 5.2.2.2. Other PET Applications
- 5.2.1. SPECT Application
- 5.3. Market Analysis, Insights and Forecast - by Region
- 5.3.1. North America
- 5.3.2. South America
- 5.3.3. Europe
- 5.3.4. Middle East & Africa
- 5.3.5. Asia Pacific
- 5.1. Market Analysis, Insights and Forecast - by Product
- 6. North America Nuclear Imaging Market in US Analysis, Insights and Forecast, 2019-2031
- 6.1. Market Analysis, Insights and Forecast - by Product
- 6.1.1. Equipment
- 6.1.2. Diagnostic Radioisotope
- 6.1.2.1. SPECT Radioisotopes
- 6.1.2.2. PET Radioisotopes
- 6.2. Market Analysis, Insights and Forecast - by Application
- 6.2.1. SPECT Application
- 6.2.1.1. Cardiology
- 6.2.1.2. Neurology
- 6.2.1.3. Thyroid
- 6.2.1.4. Other SPECT Applications
- 6.2.2. PET Application
- 6.2.2.1. Oncology
- 6.2.2.2. Other PET Applications
- 6.2.1. SPECT Application
- 6.1. Market Analysis, Insights and Forecast - by Product
- 7. South America Nuclear Imaging Market in US Analysis, Insights and Forecast, 2019-2031
- 7.1. Market Analysis, Insights and Forecast - by Product
- 7.1.1. Equipment
- 7.1.2. Diagnostic Radioisotope
- 7.1.2.1. SPECT Radioisotopes
- 7.1.2.2. PET Radioisotopes
- 7.2. Market Analysis, Insights and Forecast - by Application
- 7.2.1. SPECT Application
- 7.2.1.1. Cardiology
- 7.2.1.2. Neurology
- 7.2.1.3. Thyroid
- 7.2.1.4. Other SPECT Applications
- 7.2.2. PET Application
- 7.2.2.1. Oncology
- 7.2.2.2. Other PET Applications
- 7.2.1. SPECT Application
- 7.1. Market Analysis, Insights and Forecast - by Product
- 8. Europe Nuclear Imaging Market in US Analysis, Insights and Forecast, 2019-2031
- 8.1. Market Analysis, Insights and Forecast - by Product
- 8.1.1. Equipment
- 8.1.2. Diagnostic Radioisotope
- 8.1.2.1. SPECT Radioisotopes
- 8.1.2.2. PET Radioisotopes
- 8.2. Market Analysis, Insights and Forecast - by Application
- 8.2.1. SPECT Application
- 8.2.1.1. Cardiology
- 8.2.1.2. Neurology
- 8.2.1.3. Thyroid
- 8.2.1.4. Other SPECT Applications
- 8.2.2. PET Application
- 8.2.2.1. Oncology
- 8.2.2.2. Other PET Applications
- 8.2.1. SPECT Application
- 8.1. Market Analysis, Insights and Forecast - by Product
- 9. Middle East & Africa Nuclear Imaging Market in US Analysis, Insights and Forecast, 2019-2031
- 9.1. Market Analysis, Insights and Forecast - by Product
- 9.1.1. Equipment
- 9.1.2. Diagnostic Radioisotope
- 9.1.2.1. SPECT Radioisotopes
- 9.1.2.2. PET Radioisotopes
- 9.2. Market Analysis, Insights and Forecast - by Application
- 9.2.1. SPECT Application
- 9.2.1.1. Cardiology
- 9.2.1.2. Neurology
- 9.2.1.3. Thyroid
- 9.2.1.4. Other SPECT Applications
- 9.2.2. PET Application
- 9.2.2.1. Oncology
- 9.2.2.2. Other PET Applications
- 9.2.1. SPECT Application
- 9.1. Market Analysis, Insights and Forecast - by Product
- 10. Asia Pacific Nuclear Imaging Market in US Analysis, Insights and Forecast, 2019-2031
- 10.1. Market Analysis, Insights and Forecast - by Product
- 10.1.1. Equipment
- 10.1.2. Diagnostic Radioisotope
- 10.1.2.1. SPECT Radioisotopes
- 10.1.2.2. PET Radioisotopes
- 10.2. Market Analysis, Insights and Forecast - by Application
- 10.2.1. SPECT Application
- 10.2.1.1. Cardiology
- 10.2.1.2. Neurology
- 10.2.1.3. Thyroid
- 10.2.1.4. Other SPECT Applications
- 10.2.2. PET Application
- 10.2.2.1. Oncology
- 10.2.2.2. Other PET Applications
- 10.2.1. SPECT Application
- 10.1. Market Analysis, Insights and Forecast - by Product
- 11. Northeast Nuclear Imaging Market in US Analysis, Insights and Forecast, 2019-2031
- 12. Southeast Nuclear Imaging Market in US Analysis, Insights and Forecast, 2019-2031
- 13. Midwest Nuclear Imaging Market in US Analysis, Insights and Forecast, 2019-2031
- 14. Southwest Nuclear Imaging Market in US Analysis, Insights and Forecast, 2019-2031
- 15. West Nuclear Imaging Market in US Analysis, Insights and Forecast, 2019-2031
- 16. Competitive Analysis
- 16.1. Global Market Share Analysis 2024
- 16.2. Company Profiles
- 16.2.1 BWX Technologies Inc
- 16.2.1.1. Overview
- 16.2.1.2. Products
- 16.2.1.3. SWOT Analysis
- 16.2.1.4. Recent Developments
- 16.2.1.5. Financials (Based on Availability)
- 16.2.2 Canon Inc (Canon Medical Systems Corporation)
- 16.2.2.1. Overview
- 16.2.2.2. Products
- 16.2.2.3. SWOT Analysis
- 16.2.2.4. Recent Developments
- 16.2.2.5. Financials (Based on Availability)
- 16.2.3 Bracco Group
- 16.2.3.1. Overview
- 16.2.3.2. Products
- 16.2.3.3. SWOT Analysis
- 16.2.3.4. Recent Developments
- 16.2.3.5. Financials (Based on Availability)
- 16.2.4 Koninklijke Philips N V
- 16.2.4.1. Overview
- 16.2.4.2. Products
- 16.2.4.3. SWOT Analysis
- 16.2.4.4. Recent Developments
- 16.2.4.5. Financials (Based on Availability)
- 16.2.5 Cardinal Health Inc
- 16.2.5.1. Overview
- 16.2.5.2. Products
- 16.2.5.3. SWOT Analysis
- 16.2.5.4. Recent Developments
- 16.2.5.5. Financials (Based on Availability)
- 16.2.6 Siemens Healthineers AG
- 16.2.6.1. Overview
- 16.2.6.2. Products
- 16.2.6.3. SWOT Analysis
- 16.2.6.4. Recent Developments
- 16.2.6.5. Financials (Based on Availability)
- 16.2.7 Novartis AG (Advanced Accelerator Applications)
- 16.2.7.1. Overview
- 16.2.7.2. Products
- 16.2.7.3. SWOT Analysis
- 16.2.7.4. Recent Developments
- 16.2.7.5. Financials (Based on Availability)
- 16.2.8 GE Healthcare
- 16.2.8.1. Overview
- 16.2.8.2. Products
- 16.2.8.3. SWOT Analysis
- 16.2.8.4. Recent Developments
- 16.2.8.5. Financials (Based on Availability)
- 16.2.9 Curium
- 16.2.9.1. Overview
- 16.2.9.2. Products
- 16.2.9.3. SWOT Analysis
- 16.2.9.4. Recent Developments
- 16.2.9.5. Financials (Based on Availability)
- 16.2.10 Fujifilm Holdings Corporation
- 16.2.10.1. Overview
- 16.2.10.2. Products
- 16.2.10.3. SWOT Analysis
- 16.2.10.4. Recent Developments
- 16.2.10.5. Financials (Based on Availability)
- 16.2.1 BWX Technologies Inc
List of Figures
- Figure 1: Global Nuclear Imaging Market in US Revenue Breakdown (Million, %) by Region 2024 & 2032
- Figure 2: United states Nuclear Imaging Market in US Revenue (Million), by Country 2024 & 2032
- Figure 3: United states Nuclear Imaging Market in US Revenue Share (%), by Country 2024 & 2032
- Figure 4: North America Nuclear Imaging Market in US Revenue (Million), by Product 2024 & 2032
- Figure 5: North America Nuclear Imaging Market in US Revenue Share (%), by Product 2024 & 2032
- Figure 6: North America Nuclear Imaging Market in US Revenue (Million), by Application 2024 & 2032
- Figure 7: North America Nuclear Imaging Market in US Revenue Share (%), by Application 2024 & 2032
- Figure 8: North America Nuclear Imaging Market in US Revenue (Million), by Country 2024 & 2032
- Figure 9: North America Nuclear Imaging Market in US Revenue Share (%), by Country 2024 & 2032
- Figure 10: South America Nuclear Imaging Market in US Revenue (Million), by Product 2024 & 2032
- Figure 11: South America Nuclear Imaging Market in US Revenue Share (%), by Product 2024 & 2032
- Figure 12: South America Nuclear Imaging Market in US Revenue (Million), by Application 2024 & 2032
- Figure 13: South America Nuclear Imaging Market in US Revenue Share (%), by Application 2024 & 2032
- Figure 14: South America Nuclear Imaging Market in US Revenue (Million), by Country 2024 & 2032
- Figure 15: South America Nuclear Imaging Market in US Revenue Share (%), by Country 2024 & 2032
- Figure 16: Europe Nuclear Imaging Market in US Revenue (Million), by Product 2024 & 2032
- Figure 17: Europe Nuclear Imaging Market in US Revenue Share (%), by Product 2024 & 2032
- Figure 18: Europe Nuclear Imaging Market in US Revenue (Million), by Application 2024 & 2032
- Figure 19: Europe Nuclear Imaging Market in US Revenue Share (%), by Application 2024 & 2032
- Figure 20: Europe Nuclear Imaging Market in US Revenue (Million), by Country 2024 & 2032
- Figure 21: Europe Nuclear Imaging Market in US Revenue Share (%), by Country 2024 & 2032
- Figure 22: Middle East & Africa Nuclear Imaging Market in US Revenue (Million), by Product 2024 & 2032
- Figure 23: Middle East & Africa Nuclear Imaging Market in US Revenue Share (%), by Product 2024 & 2032
- Figure 24: Middle East & Africa Nuclear Imaging Market in US Revenue (Million), by Application 2024 & 2032
- Figure 25: Middle East & Africa Nuclear Imaging Market in US Revenue Share (%), by Application 2024 & 2032
- Figure 26: Middle East & Africa Nuclear Imaging Market in US Revenue (Million), by Country 2024 & 2032
- Figure 27: Middle East & Africa Nuclear Imaging Market in US Revenue Share (%), by Country 2024 & 2032
- Figure 28: Asia Pacific Nuclear Imaging Market in US Revenue (Million), by Product 2024 & 2032
- Figure 29: Asia Pacific Nuclear Imaging Market in US Revenue Share (%), by Product 2024 & 2032
- Figure 30: Asia Pacific Nuclear Imaging Market in US Revenue (Million), by Application 2024 & 2032
- Figure 31: Asia Pacific Nuclear Imaging Market in US Revenue Share (%), by Application 2024 & 2032
- Figure 32: Asia Pacific Nuclear Imaging Market in US Revenue (Million), by Country 2024 & 2032
- Figure 33: Asia Pacific Nuclear Imaging Market in US Revenue Share (%), by Country 2024 & 2032
List of Tables
- Table 1: Global Nuclear Imaging Market in US Revenue Million Forecast, by Region 2019 & 2032
- Table 2: Global Nuclear Imaging Market in US Revenue Million Forecast, by Product 2019 & 2032
- Table 3: Global Nuclear Imaging Market in US Revenue Million Forecast, by Application 2019 & 2032
- Table 4: Global Nuclear Imaging Market in US Revenue Million Forecast, by Region 2019 & 2032
- Table 5: Global Nuclear Imaging Market in US Revenue Million Forecast, by Country 2019 & 2032
- Table 6: Northeast Nuclear Imaging Market in US Revenue (Million) Forecast, by Application 2019 & 2032
- Table 7: Southeast Nuclear Imaging Market in US Revenue (Million) Forecast, by Application 2019 & 2032
- Table 8: Midwest Nuclear Imaging Market in US Revenue (Million) Forecast, by Application 2019 & 2032
- Table 9: Southwest Nuclear Imaging Market in US Revenue (Million) Forecast, by Application 2019 & 2032
- Table 10: West Nuclear Imaging Market in US Revenue (Million) Forecast, by Application 2019 & 2032
- Table 11: Global Nuclear Imaging Market in US Revenue Million Forecast, by Product 2019 & 2032
- Table 12: Global Nuclear Imaging Market in US Revenue Million Forecast, by Application 2019 & 2032
- Table 13: Global Nuclear Imaging Market in US Revenue Million Forecast, by Country 2019 & 2032
- Table 14: United States Nuclear Imaging Market in US Revenue (Million) Forecast, by Application 2019 & 2032
- Table 15: Canada Nuclear Imaging Market in US Revenue (Million) Forecast, by Application 2019 & 2032
- Table 16: Mexico Nuclear Imaging Market in US Revenue (Million) Forecast, by Application 2019 & 2032
- Table 17: Global Nuclear Imaging Market in US Revenue Million Forecast, by Product 2019 & 2032
- Table 18: Global Nuclear Imaging Market in US Revenue Million Forecast, by Application 2019 & 2032
- Table 19: Global Nuclear Imaging Market in US Revenue Million Forecast, by Country 2019 & 2032
- Table 20: Brazil Nuclear Imaging Market in US Revenue (Million) Forecast, by Application 2019 & 2032
- Table 21: Argentina Nuclear Imaging Market in US Revenue (Million) Forecast, by Application 2019 & 2032
- Table 22: Rest of South America Nuclear Imaging Market in US Revenue (Million) Forecast, by Application 2019 & 2032
- Table 23: Global Nuclear Imaging Market in US Revenue Million Forecast, by Product 2019 & 2032
- Table 24: Global Nuclear Imaging Market in US Revenue Million Forecast, by Application 2019 & 2032
- Table 25: Global Nuclear Imaging Market in US Revenue Million Forecast, by Country 2019 & 2032
- Table 26: United Kingdom Nuclear Imaging Market in US Revenue (Million) Forecast, by Application 2019 & 2032
- Table 27: Germany Nuclear Imaging Market in US Revenue (Million) Forecast, by Application 2019 & 2032
- Table 28: France Nuclear Imaging Market in US Revenue (Million) Forecast, by Application 2019 & 2032
- Table 29: Italy Nuclear Imaging Market in US Revenue (Million) Forecast, by Application 2019 & 2032
- Table 30: Spain Nuclear Imaging Market in US Revenue (Million) Forecast, by Application 2019 & 2032
- Table 31: Russia Nuclear Imaging Market in US Revenue (Million) Forecast, by Application 2019 & 2032
- Table 32: Benelux Nuclear Imaging Market in US Revenue (Million) Forecast, by Application 2019 & 2032
- Table 33: Nordics Nuclear Imaging Market in US Revenue (Million) Forecast, by Application 2019 & 2032
- Table 34: Rest of Europe Nuclear Imaging Market in US Revenue (Million) Forecast, by Application 2019 & 2032
- Table 35: Global Nuclear Imaging Market in US Revenue Million Forecast, by Product 2019 & 2032
- Table 36: Global Nuclear Imaging Market in US Revenue Million Forecast, by Application 2019 & 2032
- Table 37: Global Nuclear Imaging Market in US Revenue Million Forecast, by Country 2019 & 2032
- Table 38: Turkey Nuclear Imaging Market in US Revenue (Million) Forecast, by Application 2019 & 2032
- Table 39: Israel Nuclear Imaging Market in US Revenue (Million) Forecast, by Application 2019 & 2032
- Table 40: GCC Nuclear Imaging Market in US Revenue (Million) Forecast, by Application 2019 & 2032
- Table 41: North Africa Nuclear Imaging Market in US Revenue (Million) Forecast, by Application 2019 & 2032
- Table 42: South Africa Nuclear Imaging Market in US Revenue (Million) Forecast, by Application 2019 & 2032
- Table 43: Rest of Middle East & Africa Nuclear Imaging Market in US Revenue (Million) Forecast, by Application 2019 & 2032
- Table 44: Global Nuclear Imaging Market in US Revenue Million Forecast, by Product 2019 & 2032
- Table 45: Global Nuclear Imaging Market in US Revenue Million Forecast, by Application 2019 & 2032
- Table 46: Global Nuclear Imaging Market in US Revenue Million Forecast, by Country 2019 & 2032
- Table 47: China Nuclear Imaging Market in US Revenue (Million) Forecast, by Application 2019 & 2032
- Table 48: India Nuclear Imaging Market in US Revenue (Million) Forecast, by Application 2019 & 2032
- Table 49: Japan Nuclear Imaging Market in US Revenue (Million) Forecast, by Application 2019 & 2032
- Table 50: South Korea Nuclear Imaging Market in US Revenue (Million) Forecast, by Application 2019 & 2032
- Table 51: ASEAN Nuclear Imaging Market in US Revenue (Million) Forecast, by Application 2019 & 2032
- Table 52: Oceania Nuclear Imaging Market in US Revenue (Million) Forecast, by Application 2019 & 2032
- Table 53: Rest of Asia Pacific Nuclear Imaging Market in US Revenue (Million) Forecast, by Application 2019 & 2032
Frequently Asked Questions
1. What is the projected Compound Annual Growth Rate (CAGR) of the Nuclear Imaging Market in US?
The projected CAGR is approximately 3.94%.
2. Which companies are prominent players in the Nuclear Imaging Market in US?
Key companies in the market include BWX Technologies Inc, Canon Inc (Canon Medical Systems Corporation), Bracco Group, Koninklijke Philips N V, Cardinal Health Inc, Siemens Healthineers AG, Novartis AG (Advanced Accelerator Applications), GE Healthcare, Curium, Fujifilm Holdings Corporation.
3. What are the main segments of the Nuclear Imaging Market in US?
The market segments include Product, Application.
4. Can you provide details about the market size?
The market size is estimated to be USD 3.08 Million as of 2022.
5. What are some drivers contributing to market growth?
Increasing Prevalence of Chronic Diseases; Rising Geriatric Population; Increasing Technological Advancements.
6. What are the notable trends driving market growth?
Equipment Segment is Expected to Hold a Significant Market Share Over the Forecast Period.
7. Are there any restraints impacting market growth?
Lack Of Proper Reimbursement And Stringent Regulatory Approval Procedures; High Cost of Equipment.
8. Can you provide examples of recent developments in the market?
In June 2022, The Mars Shot Fund was established by the Society of Nuclear Medicine and Molecular Imaging (SNMMI) as a campaign to generate USD 100 million to support nuclear medicine, molecular imaging, and therapeutic research. Grants and pledges of USD 600,000 have been made to the fund so far, and efforts are being made to boost federal spending on this problem.
9. What pricing options are available for accessing the report?
Pricing options include single-user, multi-user, and enterprise licenses priced at USD 3800, USD 4500, and USD 5800 respectively.
10. Is the market size provided in terms of value or volume?
The market size is provided in terms of value, measured in Million.
11. Are there any specific market keywords associated with the report?
Yes, the market keyword associated with the report is "Nuclear Imaging Market in US," which aids in identifying and referencing the specific market segment covered.
12. How do I determine which pricing option suits my needs best?
The pricing options vary based on user requirements and access needs. Individual users may opt for single-user licenses, while businesses requiring broader access may choose multi-user or enterprise licenses for cost-effective access to the report.
13. Are there any additional resources or data provided in the Nuclear Imaging Market in US report?
While the report offers comprehensive insights, it's advisable to review the specific contents or supplementary materials provided to ascertain if additional resources or data are available.
14. How can I stay updated on further developments or reports in the Nuclear Imaging Market in US?
To stay informed about further developments, trends, and reports in the Nuclear Imaging Market in US, consider subscribing to industry newsletters, following relevant companies and organizations, or regularly checking reputable industry news sources and publications.
Methodology
Step 1 - Identification of Relevant Samples Size from Population Database


Step 2 - Approaches for Defining Global Market Size (Value, Volume* & Price*)

Note*: In applicable scenarios
Step 3 - Data Sources
Primary Research
- Web Analytics
- Survey Reports
- Research Institute
- Latest Research Reports
- Opinion Leaders
Secondary Research
- Annual Reports
- White Paper
- Latest Press Release
- Industry Association
- Paid Database
- Investor Presentations

Step 4 - Data Triangulation
Involves using different sources of information in order to increase the validity of a study
These sources are likely to be stakeholders in a program - participants, other researchers, program staff, other community members, and so on.
Then we put all data in single framework & apply various statistical tools to find out the dynamic on the market.
During the analysis stage, feedback from the stakeholder groups would be compared to determine areas of agreement as well as areas of divergence
