

Key Insights
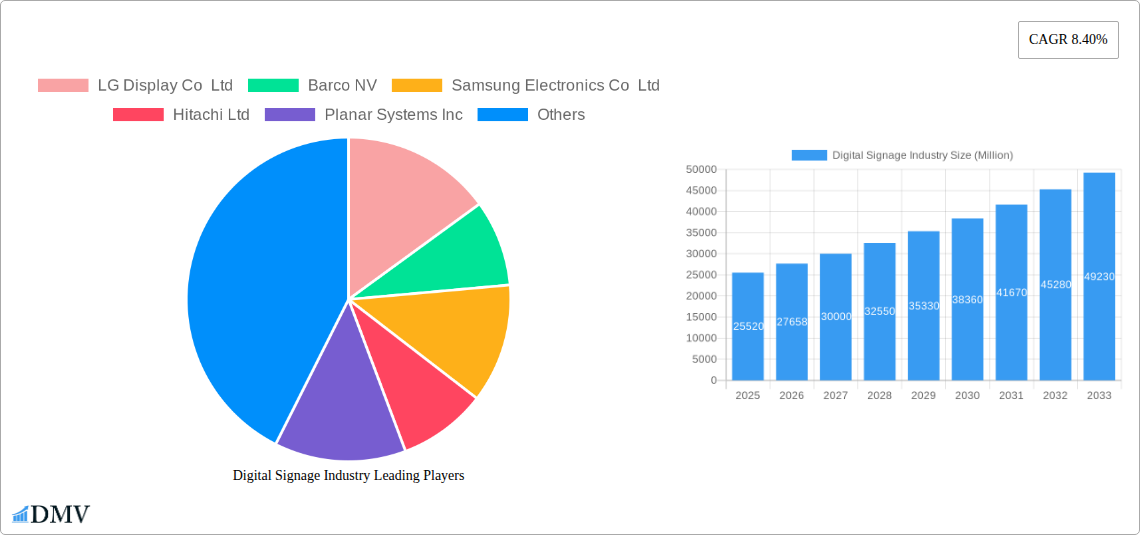
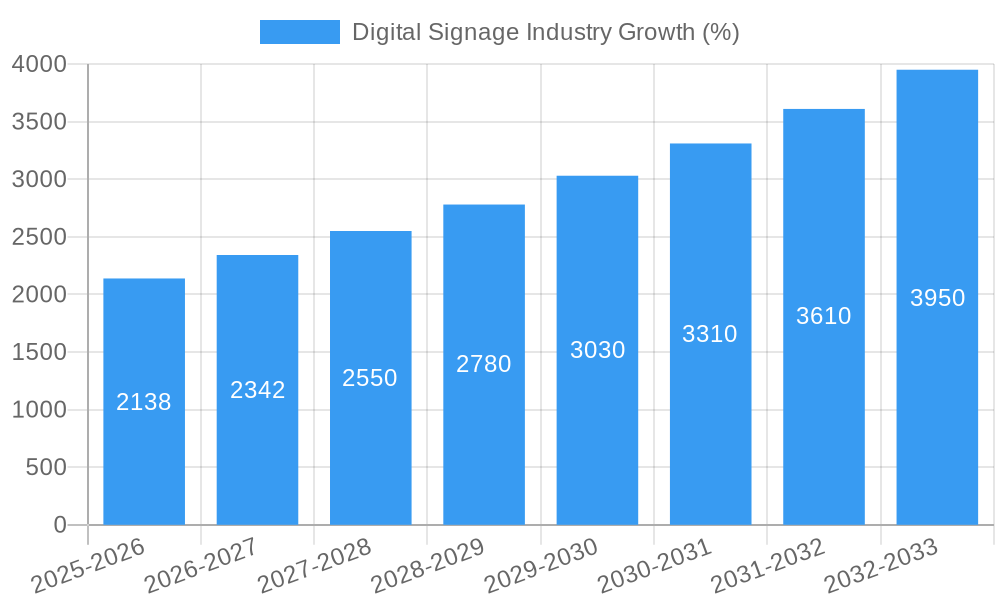
The digital signage market, valued at $25.52 billion in 2025, is experiencing robust growth, projected to expand at a compound annual growth rate (CAGR) of 8.40% from 2025 to 2033. This expansion is driven by several key factors. The increasing adoption of digital signage across diverse sectors like retail (for dynamic promotions and interactive displays), transportation (for passenger information and advertising), and hospitality (for enhancing guest experiences) is a major catalyst. Furthermore, technological advancements such as the introduction of higher-resolution displays, improved software capabilities for content management, and the integration of interactive features are fueling market growth. The shift towards more engaging and personalized customer experiences, coupled with the ability of digital signage to deliver targeted advertising, is significantly impacting market demand. The market is segmented by component (hardware, software, services), screen size (below 32", 32"-52", above 52"), location (in-store, outdoor), application (retail, transportation, hospitality, corporate, education, government, other), and type (video wall, video screen, kiosk, transparent LCD screen, digital poster, other). Major players like LG Display, Samsung, and Barco are driving innovation and competition within this dynamic market.
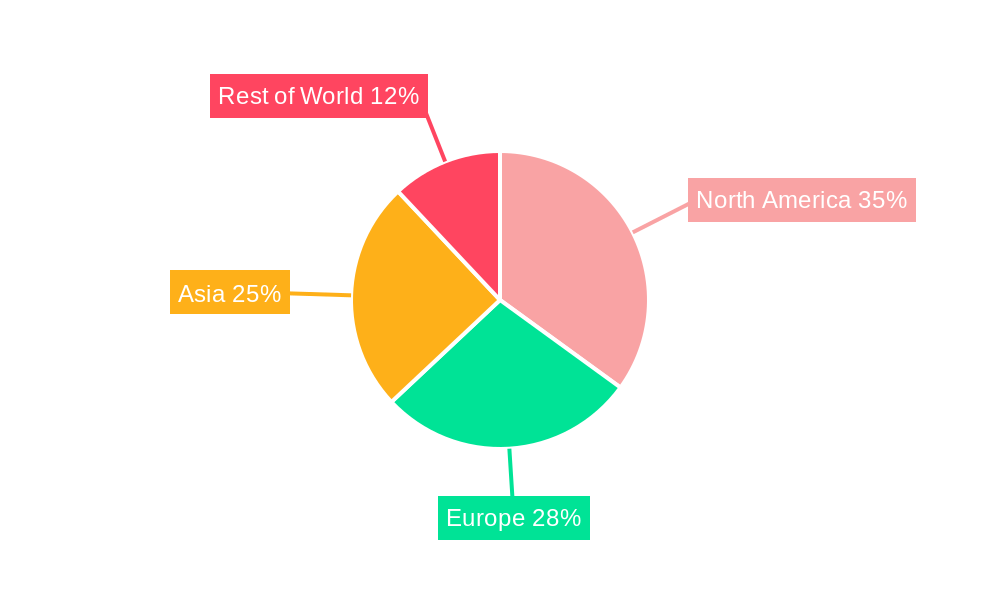
The market's growth, however, isn't without challenges. The high initial investment cost associated with implementing digital signage solutions can act as a restraint, particularly for smaller businesses. Furthermore, the need for regular maintenance and software updates can also add to the overall cost. Competition amongst established players and new entrants is intense, leading to price pressures. Despite these challenges, the long-term outlook for the digital signage market remains positive, driven by the continuous evolution of display technology, the increasing adoption of smart technologies, and the growing demand for efficient and engaging communication solutions across various industries. The market's geographical distribution likely sees strong growth in Asia and North America, reflecting higher technology adoption rates in these regions. Future growth will depend on overcoming cost barriers through innovative financing models and demonstrating a strong ROI for businesses.
Digital Signage Industry Market Report: 2019-2033
This comprehensive report provides an in-depth analysis of the global digital signage market, projecting a multi-billion dollar valuation by 2033. We delve into market segmentation, competitive landscape, technological advancements, and future growth opportunities, offering invaluable insights for stakeholders across the entire digital signage ecosystem. The report covers the period 2019-2033, with a focus on the estimated year 2025 and a forecast period of 2025-2033. Key players such as LG Display Co Ltd, Barco NV, Samsung Electronics Co Ltd, and others are analyzed, along with recent industry developments shaping the future of digital signage.
Digital Signage Industry Market Composition & Trends
This section evaluates the competitive intensity within the digital signage market, identifying key players like LG Display Co Ltd, Samsung Electronics Co Ltd, and Barco NV. We analyze market share distribution (estimated at xx% for Samsung, xx% for LG, xx% for Barco, and the remaining xx% distributed across other players in 2025), examining factors influencing concentration such as mergers and acquisitions (M&A). The report explores innovation drivers, including the rise of AI-powered content management systems and the integration of advanced display technologies like transparent LCD screens. We also consider regulatory landscapes, focusing on data privacy and accessibility standards impacting market growth. The evolving role of substitute products, like traditional print advertising, is assessed, alongside detailed end-user profiles across various sectors like retail, transportation, and hospitality. Finally, we analyze significant M&A activities within the industry, including deal values (estimated at $xx Million in total M&A value during 2019-2024) and their impact on market dynamics.
- Market Share Distribution (2025): Samsung (xx%), LG Display (xx%), Barco (xx%), Others (xx%)
- Key M&A Activities (2019-2024): Details of significant mergers and acquisitions, including estimated deal values.
Digital Signage Industry Industry Evolution
This section provides a detailed analysis of the digital signage industry's evolutionary path from 2019 to 2033. We examine the market's growth trajectory, projecting a Compound Annual Growth Rate (CAGR) of xx% during the forecast period (2025-2033), driven by increasing adoption across various sectors and technological advancements. The transition from traditional static signage to dynamic, interactive digital displays is meticulously charted, analyzing adoption rates in different sectors and geographic regions. We discuss the impact of emerging technologies, such as 8K resolution displays, artificial intelligence (AI) for content management, and the Internet of Things (IoT) integration, on the industry’s evolution. The evolving demands of consumers, especially their preferences for engaging and personalized digital experiences, are considered. Specific data points on growth rates and adoption metrics in key segments are included. The influence of factors such as increasing internet penetration and the rising popularity of interactive digital displays are analyzed in detail.
Leading Regions, Countries, or Segments in Digital Signage Industry
This section identifies the leading regions, countries, and segments within the digital signage market. We analyze the dominance factors for each segment, including Component (Hardware, Software, Services), Size (Below 32”, 32”-52”, Above 52”), Location (In-store, Outdoor), Application (Retail, Transportation, Hospitality, Corporate, Education, Government, Other), and Type (Video Wall, Video Screen, Kiosk, Transparent LCD Screen, Digital Poster, Other). The North American market is projected to maintain a leading position, primarily driven by high investments in digital signage solutions across various sectors.
- Key Drivers:
- Retail: High adoption rates due to increased consumer engagement and targeted advertising opportunities.
- Transportation: Growth driven by the need for real-time information delivery in airports, train stations, etc.
- Hardware: The largest segment, driven by advancements in display technology.
- In-store: Significant market share due to high consumer foot traffic and targeted advertising.
Digital Signage Industry Product Innovations
The digital signage industry has witnessed significant product innovations, characterized by advancements in display technologies, increased interactivity, and improved content management systems. New products include higher-resolution displays, transparent LCD screens offering unique aesthetic appeal and enhanced user experience, and AI-powered solutions optimizing content delivery and audience engagement. These innovations are driven by the desire for richer, more immersive digital signage experiences and greater efficiency in content management, leading to a compelling value proposition for businesses.
Propelling Factors for Digital Signage Industry Growth
The digital signage market is experiencing robust growth fueled by several key factors. Technological advancements, such as the development of high-resolution displays and interactive touchscreens, are driving increased adoption. Favorable economic conditions, especially in developed economies, support higher investment in digital signage solutions. Furthermore, supportive government regulations promoting digitalization are fostering market expansion. Examples include incentives for businesses to adopt digital technologies and improved infrastructure facilitating seamless digital signage deployment.
Obstacles in the Digital Signage Industry Market
Despite significant growth, the digital signage market faces several challenges. Supply chain disruptions, particularly concerning crucial display components, can impact production and lead to delays. Intense competition among established players and new entrants creates pricing pressures and necessitates continuous innovation to maintain market share. Furthermore, evolving regulatory landscapes concerning data privacy and accessibility standards can pose significant hurdles for businesses operating in this sector, leading to increased compliance costs and potential market restrictions. These challenges affect the market by reducing profitability and limiting growth. For instance, a supply chain disruption in 2022 caused a xx% decrease in production (estimated).
Future Opportunities in Digital Signage Industry
The future of the digital signage industry presents exciting opportunities. The expansion into new markets, particularly in developing economies with growing urbanization and improving infrastructure, offers significant potential for growth. Advancements in technologies like augmented reality (AR) and virtual reality (VR) integration create new avenues for immersive and interactive experiences. Emerging consumer trends, particularly the growing preference for personalized and engaging digital content, are shaping future market demands, opening up opportunities for customized digital signage solutions.
Major Players in the Digital Signage Industry Ecosystem
- LG Display Co Ltd
- Barco NV
- Samsung Electronics Co Ltd
- Hitachi Ltd
- Planar Systems Inc
- Cisco Systems Inc
- NEC Display Solutions Ltd
- Goodview
- Panasonic Corporation
- Stratacache
- Sony Corporation
Key Developments in Digital Signage Industry Industry
- May 2024: Quest Technology Management and Samsung Electronics America launch a managed service for SMBs via Telarus.
- March 2024: Quest Technology Management partners with Samsung, offering a holistic digital signage service through Telarus.
Strategic Digital Signage Industry Market Forecast
The digital signage market is poised for continued expansion driven by technological innovation, expanding applications across various sectors, and increasing demand for engaging digital experiences. The integration of AI, AR, and VR technologies presents significant opportunities for growth, while emerging markets in developing economies offer substantial untapped potential. These factors will collectively contribute to a substantial increase in market size, making it an attractive investment prospect for years to come.
Digital Signage Industry Segmentation
-
1. Type
- 1.1. Video Wall
- 1.2. Video Screen
- 1.3. Kiosk
- 1.4. Transparent LCD Screen
- 1.5. Digital Poster
- 1.6. Other Types
-
2. Component
-
2.1. Hardware
- 2.1.1. LCD/LED Display
- 2.1.2. OLED Display
- 2.1.3. Media Players
- 2.1.4. Projector/Projection Screens
- 2.1.5. Other Hardware
- 2.2. Software
- 2.3. Services
-
2.1. Hardware
-
3. Size
- 3.1. Below 32'
- 3.2. 32' - 52'
- 3.3. Above 52'
-
4. Location
- 4.1. In-store
- 4.2. Outdoor
-
5. Application
- 5.1. Retail
- 5.2. Transportation
- 5.3. Hospitality
- 5.4. Corporate
- 5.5. Education
- 5.6. Government
- 5.7. Other Applications
Digital Signage Industry Segmentation By Geography
- 1. North America
- 2. Asia
- 3. Australia and New Zealand
- 4. Europe
- 5. Latin America
- 6. Middle East and Africa
Digital Signage Industry REPORT HIGHLIGHTS
| Aspects | Details |
|---|---|
| Study Period | 2019-2033 |
| Base Year | 2024 |
| Estimated Year | 2025 |
| Forecast Period | 2025-2033 |
| Historical Period | 2019-2024 |
| Growth Rate | CAGR of 8.40% from 2019-2033 |
| Segmentation |
|
Table of Contents
- 1. Introduction
- 1.1. Research Scope
- 1.2. Market Segmentation
- 1.3. Research Methodology
- 1.4. Definitions and Assumptions
- 2. Executive Summary
- 2.1. Introduction
- 3. Market Dynamics
- 3.1. Introduction
- 3.2. Market Drivers
- 3.2.1. Convergence of Digital Signage with Cross-platform Media Tool; Evolution of Turnkey Solutions; Diminishing Cost of Infrastructure Leading to Higher Penetration
- 3.3. Market Restrains
- 3.3.1. Poor Integration with Complex Business Requirements
- 3.4. Market Trends
- 3.4.1. OLED Display is Expected to Experience Healthy Growth
- 4. Market Factor Analysis
- 4.1. Porters Five Forces
- 4.2. Supply/Value Chain
- 4.3. PESTEL analysis
- 4.4. Market Entropy
- 4.5. Patent/Trademark Analysis
- 5. Global Digital Signage Industry Analysis, Insights and Forecast, 2019-2031
- 5.1. Market Analysis, Insights and Forecast - by Type
- 5.1.1. Video Wall
- 5.1.2. Video Screen
- 5.1.3. Kiosk
- 5.1.4. Transparent LCD Screen
- 5.1.5. Digital Poster
- 5.1.6. Other Types
- 5.2. Market Analysis, Insights and Forecast - by Component
- 5.2.1. Hardware
- 5.2.1.1. LCD/LED Display
- 5.2.1.2. OLED Display
- 5.2.1.3. Media Players
- 5.2.1.4. Projector/Projection Screens
- 5.2.1.5. Other Hardware
- 5.2.2. Software
- 5.2.3. Services
- 5.2.1. Hardware
- 5.3. Market Analysis, Insights and Forecast - by Size
- 5.3.1. Below 32'
- 5.3.2. 32' - 52'
- 5.3.3. Above 52'
- 5.4. Market Analysis, Insights and Forecast - by Location
- 5.4.1. In-store
- 5.4.2. Outdoor
- 5.5. Market Analysis, Insights and Forecast - by Application
- 5.5.1. Retail
- 5.5.2. Transportation
- 5.5.3. Hospitality
- 5.5.4. Corporate
- 5.5.5. Education
- 5.5.6. Government
- 5.5.7. Other Applications
- 5.6. Market Analysis, Insights and Forecast - by Region
- 5.6.1. North America
- 5.6.2. Asia
- 5.6.3. Australia and New Zealand
- 5.6.4. Europe
- 5.6.5. Latin America
- 5.6.6. Middle East and Africa
- 5.1. Market Analysis, Insights and Forecast - by Type
- 6. North America Digital Signage Industry Analysis, Insights and Forecast, 2019-2031
- 6.1. Market Analysis, Insights and Forecast - by Type
- 6.1.1. Video Wall
- 6.1.2. Video Screen
- 6.1.3. Kiosk
- 6.1.4. Transparent LCD Screen
- 6.1.5. Digital Poster
- 6.1.6. Other Types
- 6.2. Market Analysis, Insights and Forecast - by Component
- 6.2.1. Hardware
- 6.2.1.1. LCD/LED Display
- 6.2.1.2. OLED Display
- 6.2.1.3. Media Players
- 6.2.1.4. Projector/Projection Screens
- 6.2.1.5. Other Hardware
- 6.2.2. Software
- 6.2.3. Services
- 6.2.1. Hardware
- 6.3. Market Analysis, Insights and Forecast - by Size
- 6.3.1. Below 32'
- 6.3.2. 32' - 52'
- 6.3.3. Above 52'
- 6.4. Market Analysis, Insights and Forecast - by Location
- 6.4.1. In-store
- 6.4.2. Outdoor
- 6.5. Market Analysis, Insights and Forecast - by Application
- 6.5.1. Retail
- 6.5.2. Transportation
- 6.5.3. Hospitality
- 6.5.4. Corporate
- 6.5.5. Education
- 6.5.6. Government
- 6.5.7. Other Applications
- 6.1. Market Analysis, Insights and Forecast - by Type
- 7. Asia Digital Signage Industry Analysis, Insights and Forecast, 2019-2031
- 7.1. Market Analysis, Insights and Forecast - by Type
- 7.1.1. Video Wall
- 7.1.2. Video Screen
- 7.1.3. Kiosk
- 7.1.4. Transparent LCD Screen
- 7.1.5. Digital Poster
- 7.1.6. Other Types
- 7.2. Market Analysis, Insights and Forecast - by Component
- 7.2.1. Hardware
- 7.2.1.1. LCD/LED Display
- 7.2.1.2. OLED Display
- 7.2.1.3. Media Players
- 7.2.1.4. Projector/Projection Screens
- 7.2.1.5. Other Hardware
- 7.2.2. Software
- 7.2.3. Services
- 7.2.1. Hardware
- 7.3. Market Analysis, Insights and Forecast - by Size
- 7.3.1. Below 32'
- 7.3.2. 32' - 52'
- 7.3.3. Above 52'
- 7.4. Market Analysis, Insights and Forecast - by Location
- 7.4.1. In-store
- 7.4.2. Outdoor
- 7.5. Market Analysis, Insights and Forecast - by Application
- 7.5.1. Retail
- 7.5.2. Transportation
- 7.5.3. Hospitality
- 7.5.4. Corporate
- 7.5.5. Education
- 7.5.6. Government
- 7.5.7. Other Applications
- 7.1. Market Analysis, Insights and Forecast - by Type
- 8. Australia and New Zealand Digital Signage Industry Analysis, Insights and Forecast, 2019-2031
- 8.1. Market Analysis, Insights and Forecast - by Type
- 8.1.1. Video Wall
- 8.1.2. Video Screen
- 8.1.3. Kiosk
- 8.1.4. Transparent LCD Screen
- 8.1.5. Digital Poster
- 8.1.6. Other Types
- 8.2. Market Analysis, Insights and Forecast - by Component
- 8.2.1. Hardware
- 8.2.1.1. LCD/LED Display
- 8.2.1.2. OLED Display
- 8.2.1.3. Media Players
- 8.2.1.4. Projector/Projection Screens
- 8.2.1.5. Other Hardware
- 8.2.2. Software
- 8.2.3. Services
- 8.2.1. Hardware
- 8.3. Market Analysis, Insights and Forecast - by Size
- 8.3.1. Below 32'
- 8.3.2. 32' - 52'
- 8.3.3. Above 52'
- 8.4. Market Analysis, Insights and Forecast - by Location
- 8.4.1. In-store
- 8.4.2. Outdoor
- 8.5. Market Analysis, Insights and Forecast - by Application
- 8.5.1. Retail
- 8.5.2. Transportation
- 8.5.3. Hospitality
- 8.5.4. Corporate
- 8.5.5. Education
- 8.5.6. Government
- 8.5.7. Other Applications
- 8.1. Market Analysis, Insights and Forecast - by Type
- 9. Europe Digital Signage Industry Analysis, Insights and Forecast, 2019-2031
- 9.1. Market Analysis, Insights and Forecast - by Type
- 9.1.1. Video Wall
- 9.1.2. Video Screen
- 9.1.3. Kiosk
- 9.1.4. Transparent LCD Screen
- 9.1.5. Digital Poster
- 9.1.6. Other Types
- 9.2. Market Analysis, Insights and Forecast - by Component
- 9.2.1. Hardware
- 9.2.1.1. LCD/LED Display
- 9.2.1.2. OLED Display
- 9.2.1.3. Media Players
- 9.2.1.4. Projector/Projection Screens
- 9.2.1.5. Other Hardware
- 9.2.2. Software
- 9.2.3. Services
- 9.2.1. Hardware
- 9.3. Market Analysis, Insights and Forecast - by Size
- 9.3.1. Below 32'
- 9.3.2. 32' - 52'
- 9.3.3. Above 52'
- 9.4. Market Analysis, Insights and Forecast - by Location
- 9.4.1. In-store
- 9.4.2. Outdoor
- 9.5. Market Analysis, Insights and Forecast - by Application
- 9.5.1. Retail
- 9.5.2. Transportation
- 9.5.3. Hospitality
- 9.5.4. Corporate
- 9.5.5. Education
- 9.5.6. Government
- 9.5.7. Other Applications
- 9.1. Market Analysis, Insights and Forecast - by Type
- 10. Latin America Digital Signage Industry Analysis, Insights and Forecast, 2019-2031
- 10.1. Market Analysis, Insights and Forecast - by Type
- 10.1.1. Video Wall
- 10.1.2. Video Screen
- 10.1.3. Kiosk
- 10.1.4. Transparent LCD Screen
- 10.1.5. Digital Poster
- 10.1.6. Other Types
- 10.2. Market Analysis, Insights and Forecast - by Component
- 10.2.1. Hardware
- 10.2.1.1. LCD/LED Display
- 10.2.1.2. OLED Display
- 10.2.1.3. Media Players
- 10.2.1.4. Projector/Projection Screens
- 10.2.1.5. Other Hardware
- 10.2.2. Software
- 10.2.3. Services
- 10.2.1. Hardware
- 10.3. Market Analysis, Insights and Forecast - by Size
- 10.3.1. Below 32'
- 10.3.2. 32' - 52'
- 10.3.3. Above 52'
- 10.4. Market Analysis, Insights and Forecast - by Location
- 10.4.1. In-store
- 10.4.2. Outdoor
- 10.5. Market Analysis, Insights and Forecast - by Application
- 10.5.1. Retail
- 10.5.2. Transportation
- 10.5.3. Hospitality
- 10.5.4. Corporate
- 10.5.5. Education
- 10.5.6. Government
- 10.5.7. Other Applications
- 10.1. Market Analysis, Insights and Forecast - by Type
- 11. Middle East and Africa Digital Signage Industry Analysis, Insights and Forecast, 2019-2031
- 11.1. Market Analysis, Insights and Forecast - by Type
- 11.1.1. Video Wall
- 11.1.2. Video Screen
- 11.1.3. Kiosk
- 11.1.4. Transparent LCD Screen
- 11.1.5. Digital Poster
- 11.1.6. Other Types
- 11.2. Market Analysis, Insights and Forecast - by Component
- 11.2.1. Hardware
- 11.2.1.1. LCD/LED Display
- 11.2.1.2. OLED Display
- 11.2.1.3. Media Players
- 11.2.1.4. Projector/Projection Screens
- 11.2.1.5. Other Hardware
- 11.2.2. Software
- 11.2.3. Services
- 11.2.1. Hardware
- 11.3. Market Analysis, Insights and Forecast - by Size
- 11.3.1. Below 32'
- 11.3.2. 32' - 52'
- 11.3.3. Above 52'
- 11.4. Market Analysis, Insights and Forecast - by Location
- 11.4.1. In-store
- 11.4.2. Outdoor
- 11.5. Market Analysis, Insights and Forecast - by Application
- 11.5.1. Retail
- 11.5.2. Transportation
- 11.5.3. Hospitality
- 11.5.4. Corporate
- 11.5.5. Education
- 11.5.6. Government
- 11.5.7. Other Applications
- 11.1. Market Analysis, Insights and Forecast - by Type
- 12. North America Digital Signage Industry Analysis, Insights and Forecast, 2019-2031
- 12.1. Market Analysis, Insights and Forecast - By Country/Sub-region
- 12.1.1.
- 13. Asia Digital Signage Industry Analysis, Insights and Forecast, 2019-2031
- 13.1. Market Analysis, Insights and Forecast - By Country/Sub-region
- 13.1.1.
- 14. Australia and New Zealand Digital Signage Industry Analysis, Insights and Forecast, 2019-2031
- 14.1. Market Analysis, Insights and Forecast - By Country/Sub-region
- 14.1.1.
- 15. Europe Digital Signage Industry Analysis, Insights and Forecast, 2019-2031
- 15.1. Market Analysis, Insights and Forecast - By Country/Sub-region
- 15.1.1.
- 16. Latin America Digital Signage Industry Analysis, Insights and Forecast, 2019-2031
- 16.1. Market Analysis, Insights and Forecast - By Country/Sub-region
- 16.1.1.
- 17. Middle East and Africa Digital Signage Industry Analysis, Insights and Forecast, 2019-2031
- 17.1. Market Analysis, Insights and Forecast - By Country/Sub-region
- 17.1.1.
- 18. Competitive Analysis
- 18.1. Global Market Share Analysis 2024
- 18.2. Company Profiles
- 18.2.1 LG Display Co Ltd
- 18.2.1.1. Overview
- 18.2.1.2. Products
- 18.2.1.3. SWOT Analysis
- 18.2.1.4. Recent Developments
- 18.2.1.5. Financials (Based on Availability)
- 18.2.2 Barco NV
- 18.2.2.1. Overview
- 18.2.2.2. Products
- 18.2.2.3. SWOT Analysis
- 18.2.2.4. Recent Developments
- 18.2.2.5. Financials (Based on Availability)
- 18.2.3 Samsung Electronics Co Ltd
- 18.2.3.1. Overview
- 18.2.3.2. Products
- 18.2.3.3. SWOT Analysis
- 18.2.3.4. Recent Developments
- 18.2.3.5. Financials (Based on Availability)
- 18.2.4 Hitachi Ltd
- 18.2.4.1. Overview
- 18.2.4.2. Products
- 18.2.4.3. SWOT Analysis
- 18.2.4.4. Recent Developments
- 18.2.4.5. Financials (Based on Availability)
- 18.2.5 Planar Systems Inc
- 18.2.5.1. Overview
- 18.2.5.2. Products
- 18.2.5.3. SWOT Analysis
- 18.2.5.4. Recent Developments
- 18.2.5.5. Financials (Based on Availability)
- 18.2.6 Cisco Systems Inc
- 18.2.6.1. Overview
- 18.2.6.2. Products
- 18.2.6.3. SWOT Analysis
- 18.2.6.4. Recent Developments
- 18.2.6.5. Financials (Based on Availability)
- 18.2.7 NEC Display Solutions Ltd
- 18.2.7.1. Overview
- 18.2.7.2. Products
- 18.2.7.3. SWOT Analysis
- 18.2.7.4. Recent Developments
- 18.2.7.5. Financials (Based on Availability)
- 18.2.8 Goodview
- 18.2.8.1. Overview
- 18.2.8.2. Products
- 18.2.8.3. SWOT Analysis
- 18.2.8.4. Recent Developments
- 18.2.8.5. Financials (Based on Availability)
- 18.2.9 Panasonic Corporation
- 18.2.9.1. Overview
- 18.2.9.2. Products
- 18.2.9.3. SWOT Analysis
- 18.2.9.4. Recent Developments
- 18.2.9.5. Financials (Based on Availability)
- 18.2.10 Stratacache
- 18.2.10.1. Overview
- 18.2.10.2. Products
- 18.2.10.3. SWOT Analysis
- 18.2.10.4. Recent Developments
- 18.2.10.5. Financials (Based on Availability)
- 18.2.11 Sony Corporation
- 18.2.11.1. Overview
- 18.2.11.2. Products
- 18.2.11.3. SWOT Analysis
- 18.2.11.4. Recent Developments
- 18.2.11.5. Financials (Based on Availability)
- 18.2.1 LG Display Co Ltd
List of Figures
- Figure 1: Global Digital Signage Industry Revenue Breakdown (Million, %) by Region 2024 & 2032
- Figure 2: North America Digital Signage Industry Revenue (Million), by Country 2024 & 2032
- Figure 3: North America Digital Signage Industry Revenue Share (%), by Country 2024 & 2032
- Figure 4: Asia Digital Signage Industry Revenue (Million), by Country 2024 & 2032
- Figure 5: Asia Digital Signage Industry Revenue Share (%), by Country 2024 & 2032
- Figure 6: Australia and New Zealand Digital Signage Industry Revenue (Million), by Country 2024 & 2032
- Figure 7: Australia and New Zealand Digital Signage Industry Revenue Share (%), by Country 2024 & 2032
- Figure 8: Europe Digital Signage Industry Revenue (Million), by Country 2024 & 2032
- Figure 9: Europe Digital Signage Industry Revenue Share (%), by Country 2024 & 2032
- Figure 10: Latin America Digital Signage Industry Revenue (Million), by Country 2024 & 2032
- Figure 11: Latin America Digital Signage Industry Revenue Share (%), by Country 2024 & 2032
- Figure 12: Middle East and Africa Digital Signage Industry Revenue (Million), by Country 2024 & 2032
- Figure 13: Middle East and Africa Digital Signage Industry Revenue Share (%), by Country 2024 & 2032
- Figure 14: North America Digital Signage Industry Revenue (Million), by Type 2024 & 2032
- Figure 15: North America Digital Signage Industry Revenue Share (%), by Type 2024 & 2032
- Figure 16: North America Digital Signage Industry Revenue (Million), by Component 2024 & 2032
- Figure 17: North America Digital Signage Industry Revenue Share (%), by Component 2024 & 2032
- Figure 18: North America Digital Signage Industry Revenue (Million), by Size 2024 & 2032
- Figure 19: North America Digital Signage Industry Revenue Share (%), by Size 2024 & 2032
- Figure 20: North America Digital Signage Industry Revenue (Million), by Location 2024 & 2032
- Figure 21: North America Digital Signage Industry Revenue Share (%), by Location 2024 & 2032
- Figure 22: North America Digital Signage Industry Revenue (Million), by Application 2024 & 2032
- Figure 23: North America Digital Signage Industry Revenue Share (%), by Application 2024 & 2032
- Figure 24: North America Digital Signage Industry Revenue (Million), by Country 2024 & 2032
- Figure 25: North America Digital Signage Industry Revenue Share (%), by Country 2024 & 2032
- Figure 26: Asia Digital Signage Industry Revenue (Million), by Type 2024 & 2032
- Figure 27: Asia Digital Signage Industry Revenue Share (%), by Type 2024 & 2032
- Figure 28: Asia Digital Signage Industry Revenue (Million), by Component 2024 & 2032
- Figure 29: Asia Digital Signage Industry Revenue Share (%), by Component 2024 & 2032
- Figure 30: Asia Digital Signage Industry Revenue (Million), by Size 2024 & 2032
- Figure 31: Asia Digital Signage Industry Revenue Share (%), by Size 2024 & 2032
- Figure 32: Asia Digital Signage Industry Revenue (Million), by Location 2024 & 2032
- Figure 33: Asia Digital Signage Industry Revenue Share (%), by Location 2024 & 2032
- Figure 34: Asia Digital Signage Industry Revenue (Million), by Application 2024 & 2032
- Figure 35: Asia Digital Signage Industry Revenue Share (%), by Application 2024 & 2032
- Figure 36: Asia Digital Signage Industry Revenue (Million), by Country 2024 & 2032
- Figure 37: Asia Digital Signage Industry Revenue Share (%), by Country 2024 & 2032
- Figure 38: Australia and New Zealand Digital Signage Industry Revenue (Million), by Type 2024 & 2032
- Figure 39: Australia and New Zealand Digital Signage Industry Revenue Share (%), by Type 2024 & 2032
- Figure 40: Australia and New Zealand Digital Signage Industry Revenue (Million), by Component 2024 & 2032
- Figure 41: Australia and New Zealand Digital Signage Industry Revenue Share (%), by Component 2024 & 2032
- Figure 42: Australia and New Zealand Digital Signage Industry Revenue (Million), by Size 2024 & 2032
- Figure 43: Australia and New Zealand Digital Signage Industry Revenue Share (%), by Size 2024 & 2032
- Figure 44: Australia and New Zealand Digital Signage Industry Revenue (Million), by Location 2024 & 2032
- Figure 45: Australia and New Zealand Digital Signage Industry Revenue Share (%), by Location 2024 & 2032
- Figure 46: Australia and New Zealand Digital Signage Industry Revenue (Million), by Application 2024 & 2032
- Figure 47: Australia and New Zealand Digital Signage Industry Revenue Share (%), by Application 2024 & 2032
- Figure 48: Australia and New Zealand Digital Signage Industry Revenue (Million), by Country 2024 & 2032
- Figure 49: Australia and New Zealand Digital Signage Industry Revenue Share (%), by Country 2024 & 2032
- Figure 50: Europe Digital Signage Industry Revenue (Million), by Type 2024 & 2032
- Figure 51: Europe Digital Signage Industry Revenue Share (%), by Type 2024 & 2032
- Figure 52: Europe Digital Signage Industry Revenue (Million), by Component 2024 & 2032
- Figure 53: Europe Digital Signage Industry Revenue Share (%), by Component 2024 & 2032
- Figure 54: Europe Digital Signage Industry Revenue (Million), by Size 2024 & 2032
- Figure 55: Europe Digital Signage Industry Revenue Share (%), by Size 2024 & 2032
- Figure 56: Europe Digital Signage Industry Revenue (Million), by Location 2024 & 2032
- Figure 57: Europe Digital Signage Industry Revenue Share (%), by Location 2024 & 2032
- Figure 58: Europe Digital Signage Industry Revenue (Million), by Application 2024 & 2032
- Figure 59: Europe Digital Signage Industry Revenue Share (%), by Application 2024 & 2032
- Figure 60: Europe Digital Signage Industry Revenue (Million), by Country 2024 & 2032
- Figure 61: Europe Digital Signage Industry Revenue Share (%), by Country 2024 & 2032
- Figure 62: Latin America Digital Signage Industry Revenue (Million), by Type 2024 & 2032
- Figure 63: Latin America Digital Signage Industry Revenue Share (%), by Type 2024 & 2032
- Figure 64: Latin America Digital Signage Industry Revenue (Million), by Component 2024 & 2032
- Figure 65: Latin America Digital Signage Industry Revenue Share (%), by Component 2024 & 2032
- Figure 66: Latin America Digital Signage Industry Revenue (Million), by Size 2024 & 2032
- Figure 67: Latin America Digital Signage Industry Revenue Share (%), by Size 2024 & 2032
- Figure 68: Latin America Digital Signage Industry Revenue (Million), by Location 2024 & 2032
- Figure 69: Latin America Digital Signage Industry Revenue Share (%), by Location 2024 & 2032
- Figure 70: Latin America Digital Signage Industry Revenue (Million), by Application 2024 & 2032
- Figure 71: Latin America Digital Signage Industry Revenue Share (%), by Application 2024 & 2032
- Figure 72: Latin America Digital Signage Industry Revenue (Million), by Country 2024 & 2032
- Figure 73: Latin America Digital Signage Industry Revenue Share (%), by Country 2024 & 2032
- Figure 74: Middle East and Africa Digital Signage Industry Revenue (Million), by Type 2024 & 2032
- Figure 75: Middle East and Africa Digital Signage Industry Revenue Share (%), by Type 2024 & 2032
- Figure 76: Middle East and Africa Digital Signage Industry Revenue (Million), by Component 2024 & 2032
- Figure 77: Middle East and Africa Digital Signage Industry Revenue Share (%), by Component 2024 & 2032
- Figure 78: Middle East and Africa Digital Signage Industry Revenue (Million), by Size 2024 & 2032
- Figure 79: Middle East and Africa Digital Signage Industry Revenue Share (%), by Size 2024 & 2032
- Figure 80: Middle East and Africa Digital Signage Industry Revenue (Million), by Location 2024 & 2032
- Figure 81: Middle East and Africa Digital Signage Industry Revenue Share (%), by Location 2024 & 2032
- Figure 82: Middle East and Africa Digital Signage Industry Revenue (Million), by Application 2024 & 2032
- Figure 83: Middle East and Africa Digital Signage Industry Revenue Share (%), by Application 2024 & 2032
- Figure 84: Middle East and Africa Digital Signage Industry Revenue (Million), by Country 2024 & 2032
- Figure 85: Middle East and Africa Digital Signage Industry Revenue Share (%), by Country 2024 & 2032
List of Tables
- Table 1: Global Digital Signage Industry Revenue Million Forecast, by Region 2019 & 2032
- Table 2: Global Digital Signage Industry Revenue Million Forecast, by Type 2019 & 2032
- Table 3: Global Digital Signage Industry Revenue Million Forecast, by Component 2019 & 2032
- Table 4: Global Digital Signage Industry Revenue Million Forecast, by Size 2019 & 2032
- Table 5: Global Digital Signage Industry Revenue Million Forecast, by Location 2019 & 2032
- Table 6: Global Digital Signage Industry Revenue Million Forecast, by Application 2019 & 2032
- Table 7: Global Digital Signage Industry Revenue Million Forecast, by Region 2019 & 2032
- Table 8: Global Digital Signage Industry Revenue Million Forecast, by Country 2019 & 2032
- Table 9: Digital Signage Industry Revenue (Million) Forecast, by Application 2019 & 2032
- Table 10: Global Digital Signage Industry Revenue Million Forecast, by Country 2019 & 2032
- Table 11: Digital Signage Industry Revenue (Million) Forecast, by Application 2019 & 2032
- Table 12: Global Digital Signage Industry Revenue Million Forecast, by Country 2019 & 2032
- Table 13: Digital Signage Industry Revenue (Million) Forecast, by Application 2019 & 2032
- Table 14: Global Digital Signage Industry Revenue Million Forecast, by Country 2019 & 2032
- Table 15: Digital Signage Industry Revenue (Million) Forecast, by Application 2019 & 2032
- Table 16: Global Digital Signage Industry Revenue Million Forecast, by Country 2019 & 2032
- Table 17: Digital Signage Industry Revenue (Million) Forecast, by Application 2019 & 2032
- Table 18: Global Digital Signage Industry Revenue Million Forecast, by Country 2019 & 2032
- Table 19: Digital Signage Industry Revenue (Million) Forecast, by Application 2019 & 2032
- Table 20: Global Digital Signage Industry Revenue Million Forecast, by Type 2019 & 2032
- Table 21: Global Digital Signage Industry Revenue Million Forecast, by Component 2019 & 2032
- Table 22: Global Digital Signage Industry Revenue Million Forecast, by Size 2019 & 2032
- Table 23: Global Digital Signage Industry Revenue Million Forecast, by Location 2019 & 2032
- Table 24: Global Digital Signage Industry Revenue Million Forecast, by Application 2019 & 2032
- Table 25: Global Digital Signage Industry Revenue Million Forecast, by Country 2019 & 2032
- Table 26: Global Digital Signage Industry Revenue Million Forecast, by Type 2019 & 2032
- Table 27: Global Digital Signage Industry Revenue Million Forecast, by Component 2019 & 2032
- Table 28: Global Digital Signage Industry Revenue Million Forecast, by Size 2019 & 2032
- Table 29: Global Digital Signage Industry Revenue Million Forecast, by Location 2019 & 2032
- Table 30: Global Digital Signage Industry Revenue Million Forecast, by Application 2019 & 2032
- Table 31: Global Digital Signage Industry Revenue Million Forecast, by Country 2019 & 2032
- Table 32: Global Digital Signage Industry Revenue Million Forecast, by Type 2019 & 2032
- Table 33: Global Digital Signage Industry Revenue Million Forecast, by Component 2019 & 2032
- Table 34: Global Digital Signage Industry Revenue Million Forecast, by Size 2019 & 2032
- Table 35: Global Digital Signage Industry Revenue Million Forecast, by Location 2019 & 2032
- Table 36: Global Digital Signage Industry Revenue Million Forecast, by Application 2019 & 2032
- Table 37: Global Digital Signage Industry Revenue Million Forecast, by Country 2019 & 2032
- Table 38: Global Digital Signage Industry Revenue Million Forecast, by Type 2019 & 2032
- Table 39: Global Digital Signage Industry Revenue Million Forecast, by Component 2019 & 2032
- Table 40: Global Digital Signage Industry Revenue Million Forecast, by Size 2019 & 2032
- Table 41: Global Digital Signage Industry Revenue Million Forecast, by Location 2019 & 2032
- Table 42: Global Digital Signage Industry Revenue Million Forecast, by Application 2019 & 2032
- Table 43: Global Digital Signage Industry Revenue Million Forecast, by Country 2019 & 2032
- Table 44: Global Digital Signage Industry Revenue Million Forecast, by Type 2019 & 2032
- Table 45: Global Digital Signage Industry Revenue Million Forecast, by Component 2019 & 2032
- Table 46: Global Digital Signage Industry Revenue Million Forecast, by Size 2019 & 2032
- Table 47: Global Digital Signage Industry Revenue Million Forecast, by Location 2019 & 2032
- Table 48: Global Digital Signage Industry Revenue Million Forecast, by Application 2019 & 2032
- Table 49: Global Digital Signage Industry Revenue Million Forecast, by Country 2019 & 2032
- Table 50: Global Digital Signage Industry Revenue Million Forecast, by Type 2019 & 2032
- Table 51: Global Digital Signage Industry Revenue Million Forecast, by Component 2019 & 2032
- Table 52: Global Digital Signage Industry Revenue Million Forecast, by Size 2019 & 2032
- Table 53: Global Digital Signage Industry Revenue Million Forecast, by Location 2019 & 2032
- Table 54: Global Digital Signage Industry Revenue Million Forecast, by Application 2019 & 2032
- Table 55: Global Digital Signage Industry Revenue Million Forecast, by Country 2019 & 2032
Frequently Asked Questions
1. What is the projected Compound Annual Growth Rate (CAGR) of the Digital Signage Industry?
The projected CAGR is approximately 8.40%.
2. Which companies are prominent players in the Digital Signage Industry?
Key companies in the market include LG Display Co Ltd, Barco NV, Samsung Electronics Co Ltd, Hitachi Ltd, Planar Systems Inc, Cisco Systems Inc, NEC Display Solutions Ltd, Goodview, Panasonic Corporation, Stratacache, Sony Corporation.
3. What are the main segments of the Digital Signage Industry?
The market segments include Type, Component, Size, Location, Application.
4. Can you provide details about the market size?
The market size is estimated to be USD 25.52 Million as of 2022.
5. What are some drivers contributing to market growth?
Convergence of Digital Signage with Cross-platform Media Tool; Evolution of Turnkey Solutions; Diminishing Cost of Infrastructure Leading to Higher Penetration.
6. What are the notable trends driving market growth?
OLED Display is Expected to Experience Healthy Growth.
7. Are there any restraints impacting market growth?
Poor Integration with Complex Business Requirements.
8. Can you provide examples of recent developments in the market?
May 2024 - Quest Technology Management and Samsung Electronics America have collaborated to launch a pioneering managed service tailored for small and midsize businesses (SMBs). This service is available through Telarus technology advisors. The comprehensive package streamlines content and device management and features advanced displays, empowering SMB owners to revamp their business settings and enhance their brand's visibility.
9. What pricing options are available for accessing the report?
Pricing options include single-user, multi-user, and enterprise licenses priced at USD 4750, USD 5250, and USD 8750 respectively.
10. Is the market size provided in terms of value or volume?
The market size is provided in terms of value, measured in Million.
11. Are there any specific market keywords associated with the report?
Yes, the market keyword associated with the report is "Digital Signage Industry," which aids in identifying and referencing the specific market segment covered.
12. How do I determine which pricing option suits my needs best?
The pricing options vary based on user requirements and access needs. Individual users may opt for single-user licenses, while businesses requiring broader access may choose multi-user or enterprise licenses for cost-effective access to the report.
13. Are there any additional resources or data provided in the Digital Signage Industry report?
While the report offers comprehensive insights, it's advisable to review the specific contents or supplementary materials provided to ascertain if additional resources or data are available.
14. How can I stay updated on further developments or reports in the Digital Signage Industry?
To stay informed about further developments, trends, and reports in the Digital Signage Industry, consider subscribing to industry newsletters, following relevant companies and organizations, or regularly checking reputable industry news sources and publications.
Methodology
Step 1 - Identification of Relevant Samples Size from Population Database


Step 2 - Approaches for Defining Global Market Size (Value, Volume* & Price*)

Note*: In applicable scenarios
Step 3 - Data Sources
Primary Research
- Web Analytics
- Survey Reports
- Research Institute
- Latest Research Reports
- Opinion Leaders
Secondary Research
- Annual Reports
- White Paper
- Latest Press Release
- Industry Association
- Paid Database
- Investor Presentations

Step 4 - Data Triangulation
Involves using different sources of information in order to increase the validity of a study
These sources are likely to be stakeholders in a program - participants, other researchers, program staff, other community members, and so on.
Then we put all data in single framework & apply various statistical tools to find out the dynamic on the market.
During the analysis stage, feedback from the stakeholder groups would be compared to determine areas of agreement as well as areas of divergence
