

Key Insights
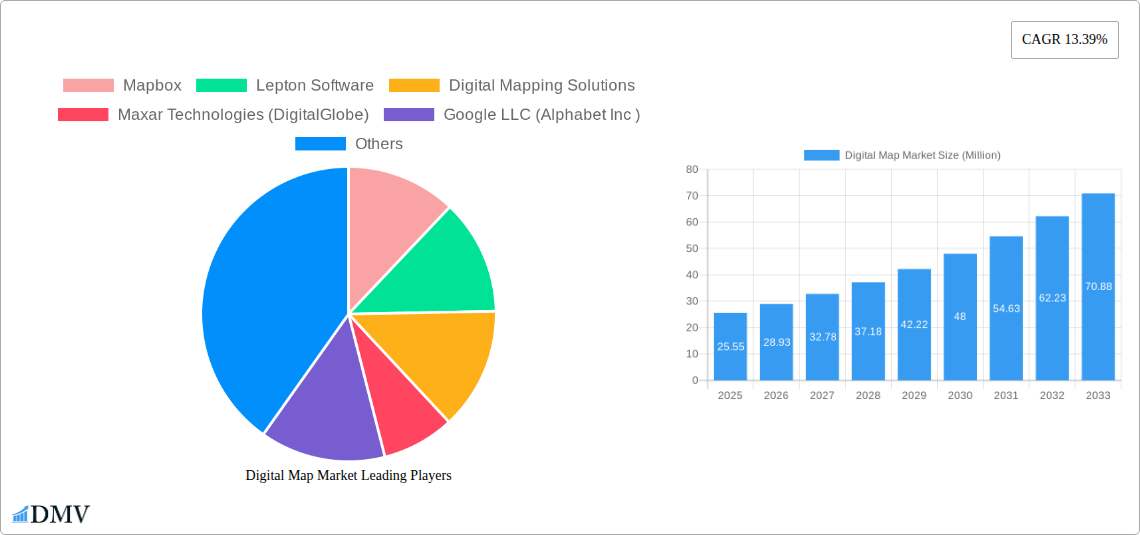
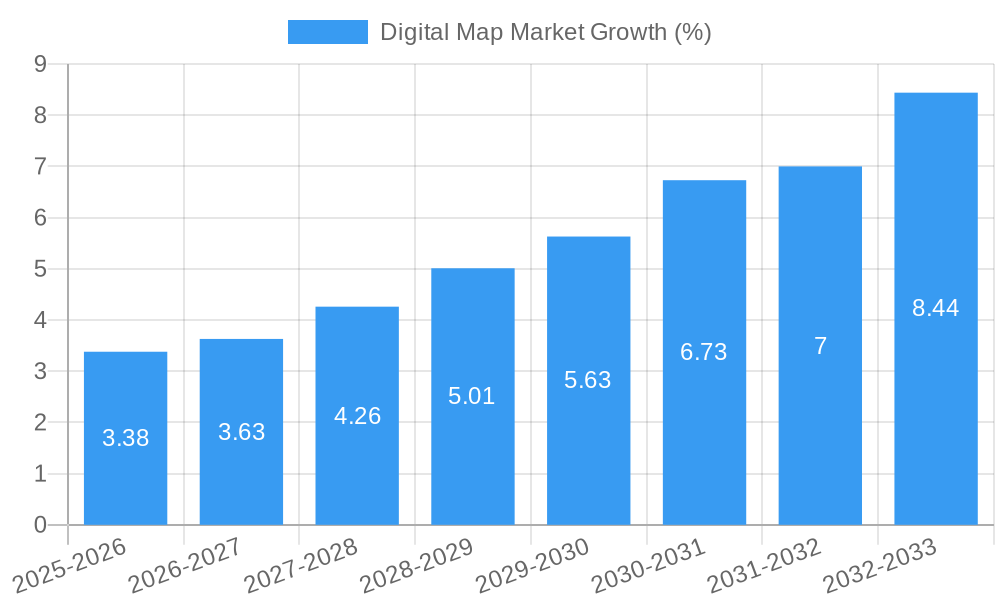
The global digital map market is experiencing robust growth, projected to reach \$25.55 million in 2025 and exhibiting a Compound Annual Growth Rate (CAGR) of 13.39% from 2025 to 2033. This expansion is fueled by several key factors. The increasing adoption of location-based services (LBS) across various sectors, including automotive, logistics, and smart city initiatives, is a primary driver. Furthermore, advancements in technologies like AI and machine learning are enhancing map accuracy, detail, and functionality, leading to increased demand. The shift towards cloud-based deployment models offers scalability and cost-effectiveness, further boosting market growth. While the on-premise segment currently holds a significant share, the cloud segment is anticipated to experience faster growth due to its inherent advantages. The automotive industry is a major consumer, utilizing digital maps for advanced driver-assistance systems (ADAS) and autonomous driving technologies. However, data privacy concerns and the high initial investment required for implementing advanced mapping solutions represent potential restraints. Competition is fierce, with established players like Google and TomTom alongside emerging innovative companies vying for market share. Geographical expansion, particularly in developing economies with rapidly growing infrastructure and technological adoption, presents significant opportunities for market players. The market is segmented by solution (software and services), deployment (on-premise and cloud), and industry (automotive, engineering & construction, logistics & transportation, energy & utilities, telecommunications, and others). This segmentation reflects the diverse applications and user needs within the digital map ecosystem.
Looking ahead, the market is expected to witness continued growth driven by the increasing integration of digital maps into Internet of Things (IoT) devices, the proliferation of 5G networks enabling real-time data updates, and the rising demand for personalized and context-aware mapping solutions. The focus on improving map accuracy and data quality, along with the development of 3D and HD maps, will be crucial for future market success. Strategies focusing on partnerships and collaborations to expand data coverage and integrate with complementary technologies will be essential for companies seeking to maintain a competitive edge. The market’s future is bright, indicating substantial opportunities for companies involved in the development, provision, and application of digital maps.
Digital Map Market: A Comprehensive Report (2019-2033)
This insightful report provides a detailed analysis of the Digital Map Market, encompassing market size, trends, leading players, and future projections. The study period covers 2019-2033, with 2025 as the base and estimated year, and a forecast period of 2025-2033. The report is essential for stakeholders seeking a comprehensive understanding of this rapidly evolving market, projected to reach xx Million by 2033.
Digital Map Market Composition & Trends
This section evaluates the competitive landscape, innovation drivers, regulatory factors, and market dynamics of the Digital Map Market. The market is characterized by a mix of established players and emerging innovators, resulting in a dynamic competitive landscape. Market share distribution reveals a concentrated market with key players holding significant portions. However, smaller players are actively pursuing innovation, leading to increased competition.
Market Concentration & Innovation:
- High market concentration among major players like Google LLC (Alphabet Inc.), TomTom International B.V., and HERE Technologies.
- Continuous innovation in areas such as AI-powered mapping, 3D mapping, and real-time data integration drives market growth.
- Strategic partnerships and mergers & acquisitions (M&A) activities are shaping the market landscape. For example, while precise M&A deal values are not publicly available for all transactions, we estimate the combined value of significant deals within the last five years to be approximately xx Million.
Regulatory Landscape & Substitute Products:
- Government regulations regarding data privacy and map accuracy significantly influence market dynamics.
- Limited availability of substitute products maintains the market’s growth trajectory, however, open-source mapping initiatives pose a potential long-term challenge.
End-User Profiles & Market Segmentation:
- The market is segmented across various industries including Automotive, Engineering & Construction, Logistics & Transportation, Energy & Utilities, and Telecommunications.
- Automotive and Logistics & Transportation segments currently drive significant market demand.
Digital Map Market Industry Evolution
The Digital Map Market has experienced substantial growth over the historical period (2019-2024), driven by technological advancements such as the integration of AI, big data analytics, and cloud computing. This has enabled the creation of more accurate, detailed, and feature-rich maps. The increased adoption of connected devices and the growing demand for location-based services across diverse industries are major contributors to market expansion. The market demonstrates a Compound Annual Growth Rate (CAGR) of xx% during the historical period. Furthermore, the shift towards cloud-based mapping solutions simplifies data accessibility and reduces infrastructure costs for businesses, accelerating market growth. This trend, coupled with increasing consumer demand for personalized mapping experiences and real-time navigation, is expected to fuel continued expansion during the forecast period. The market's growth trajectory is further strengthened by the rising integration of digital maps with other technologies, such as augmented reality and the Internet of Things (IoT).
Leading Regions, Countries, or Segments in Digital Map Market
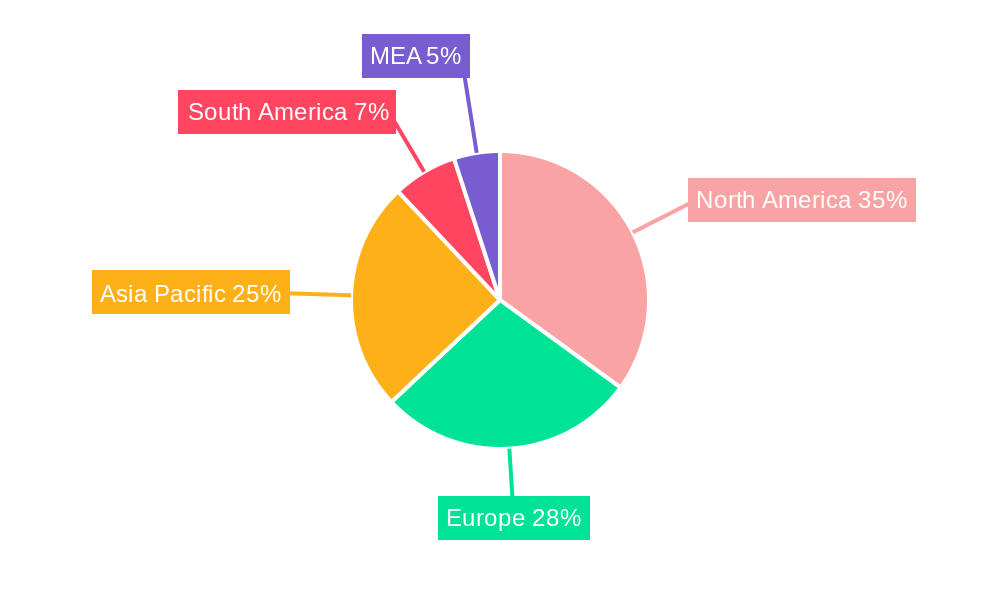
The Digital Map Market exhibits significant regional variations in terms of adoption and growth. While a definitive 'leading' region requires further specification (e.g., by revenue, market share, or growth rate), initial analysis suggests that North America and Europe currently hold prominent positions, driven by robust technological infrastructure and high adoption rates across various sectors. Asia-Pacific is projected to witness significant growth during the forecast period due to rising smartphone penetration and expanding digital infrastructure.
Key Drivers by Segment:
- By Solution: The Software segment dominates due to its scalability and adaptability across various industries, followed by the Services segment which provides customization and support.
- By Deployment: Cloud deployment is rapidly gaining traction, surpassing on-premise solutions due to its cost-effectiveness and ease of access.
- By Industry: The Automotive sector is a leading consumer, followed closely by Logistics & Transportation, driven by the need for efficient navigation and route optimization.
Dominance Factors:
High levels of technological advancement, substantial investments in R&D, and the presence of major industry players contribute to the dominance of certain regions and segments. Stringent data privacy regulations in certain regions might impact market penetration while supportive government initiatives can propel growth.
Digital Map Market Product Innovations
Recent innovations focus on enhancing map accuracy, detail, and functionality through advanced technologies like AI-powered map updates, 3D modeling, and the integration of real-time traffic data. These improvements offer superior navigation, location-based services, and augmented reality experiences. Unique selling propositions include highly customizable map interfaces, seamless integration with various platforms, and advanced analytical capabilities to support decision-making.
Propelling Factors for Digital Map Market Growth
Technological advancements such as AI, machine learning, and cloud computing significantly enhance map accuracy, functionality, and accessibility. Increased adoption of connected devices and the surge in demand for location-based services across various sectors fuel market expansion. Supportive government regulations and investments in digital infrastructure further stimulate market growth. For instance, the Overture Maps Foundation's initiative promotes open map data, potentially accelerating innovation and market expansion.
Obstacles in the Digital Map Market
Data privacy concerns and stringent regulations regarding data usage pose significant challenges. Supply chain disruptions can affect the availability of essential components, while intense competition from established and emerging players creates pressure on pricing and profitability. The potential for inaccuracies in map data, leading to safety concerns, also acts as a significant constraint.
Future Opportunities in Digital Map Market
Emerging technologies like autonomous vehicles, augmented reality (AR), and the Internet of Things (IoT) offer substantial opportunities. The expansion into new markets and underserved regions presents significant growth potential. Increasing demand for personalized mapping experiences and advanced analytical capabilities presents lucrative opportunities for innovation and service diversification.
Major Players in the Digital Map Market Ecosystem
- Mapbox
- Lepton Software
- Digital Mapping Solutions
- Maxar Technologies (DigitalGlobe)
- Google LLC (Alphabet Inc)
- Collins Bartholomew Ltd
- DMTI Spatial
- Digital Map Products Inc
- ThinkGeo LLC
- MapData Services Pty Ltd
- ESRI Business Information Solutions Inc
- TomTom International B.V.
- HERE Technologies
Key Developments in Digital Map Market Industry
- December 2022: The launch of the Overture Maps Foundation signifies a collaborative effort towards creating open and interoperable map data, potentially disrupting the market landscape and promoting wider adoption.
- July 27, 2022: Google's expansion of Street View to India, through partnerships with Genesys International and Tech Mahindra, demonstrates the growing focus on geographical expansion and market penetration in developing economies.
Strategic Digital Map Market Forecast
The Digital Map Market is poised for substantial growth driven by technological advancements, rising demand across various industries, and strategic partnerships. Continued innovation in areas such as AI-powered mapping and real-time data integration will fuel market expansion. The increasing adoption of cloud-based solutions and the emergence of new applications in sectors such as autonomous vehicles will further contribute to the market's overall growth potential. The market’s projected expansion indicates significant opportunities for existing and emerging players.
Digital Map Market Segmentation
-
1. Solution
- 1.1. Software
- 1.2. Services
-
2. Deployment
- 2.1. On-Premise
- 2.2. Cloud
-
3. Industry
- 3.1. Automotive
- 3.2. Engineering & Construction
- 3.3. Logistics & Transportation
- 3.4. Energy & Utilities
- 3.5. Telecommunication
- 3.6. Other Industries
Digital Map Market Segmentation By Geography
-
1. North America
- 1.1. United States
- 1.2. Canada
-
2. Europe
- 2.1. United Kingdom
- 2.2. Germany
- 2.3. France
- 2.4. Rest of Europe
-
3. Asia Pacific
- 3.1. China
- 3.2. Japan
- 3.3. India
- 3.4. Rest of Asia Pacific
- 4. Rest of the World
Digital Map Market REPORT HIGHLIGHTS
| Aspects | Details |
|---|---|
| Study Period | 2019-2033 |
| Base Year | 2024 |
| Estimated Year | 2025 |
| Forecast Period | 2025-2033 |
| Historical Period | 2019-2024 |
| Growth Rate | CAGR of 13.39% from 2019-2033 |
| Segmentation |
|
Table of Contents
- 1. Introduction
- 1.1. Research Scope
- 1.2. Market Segmentation
- 1.3. Research Methodology
- 1.4. Definitions and Assumptions
- 2. Executive Summary
- 2.1. Introduction
- 3. Market Dynamics
- 3.1. Introduction
- 3.2. Market Drivers
- 3.2.1. Growth in Application for Advanced Navigation System in Automotive Industry; Surge in Demand for Geographic Information System (GIS); Increased Adoption of Connected Devices and Internet
- 3.3. Market Restrains
- 3.3.1. Complexity in Integration of Traditional Maps with Modern GIS System
- 3.4. Market Trends
- 3.4.1. Surge in Demand for GIS and GNSS to Influence the Adoption of Digital Map Technology
- 4. Market Factor Analysis
- 4.1. Porters Five Forces
- 4.2. Supply/Value Chain
- 4.3. PESTEL analysis
- 4.4. Market Entropy
- 4.5. Patent/Trademark Analysis
- 5. Global Digital Map Market Analysis, Insights and Forecast, 2019-2031
- 5.1. Market Analysis, Insights and Forecast - by Solution
- 5.1.1. Software
- 5.1.2. Services
- 5.2. Market Analysis, Insights and Forecast - by Deployment
- 5.2.1. On-Premise
- 5.2.2. Cloud
- 5.3. Market Analysis, Insights and Forecast - by Industry
- 5.3.1. Automotive
- 5.3.2. Engineering & Construction
- 5.3.3. Logistics & Transportation
- 5.3.4. Energy & Utilities
- 5.3.5. Telecommunication
- 5.3.6. Other Industries
- 5.4. Market Analysis, Insights and Forecast - by Region
- 5.4.1. North America
- 5.4.2. Europe
- 5.4.3. Asia Pacific
- 5.4.4. Rest of the World
- 5.1. Market Analysis, Insights and Forecast - by Solution
- 6. North America Digital Map Market Analysis, Insights and Forecast, 2019-2031
- 6.1. Market Analysis, Insights and Forecast - by Solution
- 6.1.1. Software
- 6.1.2. Services
- 6.2. Market Analysis, Insights and Forecast - by Deployment
- 6.2.1. On-Premise
- 6.2.2. Cloud
- 6.3. Market Analysis, Insights and Forecast - by Industry
- 6.3.1. Automotive
- 6.3.2. Engineering & Construction
- 6.3.3. Logistics & Transportation
- 6.3.4. Energy & Utilities
- 6.3.5. Telecommunication
- 6.3.6. Other Industries
- 6.1. Market Analysis, Insights and Forecast - by Solution
- 7. Europe Digital Map Market Analysis, Insights and Forecast, 2019-2031
- 7.1. Market Analysis, Insights and Forecast - by Solution
- 7.1.1. Software
- 7.1.2. Services
- 7.2. Market Analysis, Insights and Forecast - by Deployment
- 7.2.1. On-Premise
- 7.2.2. Cloud
- 7.3. Market Analysis, Insights and Forecast - by Industry
- 7.3.1. Automotive
- 7.3.2. Engineering & Construction
- 7.3.3. Logistics & Transportation
- 7.3.4. Energy & Utilities
- 7.3.5. Telecommunication
- 7.3.6. Other Industries
- 7.1. Market Analysis, Insights and Forecast - by Solution
- 8. Asia Pacific Digital Map Market Analysis, Insights and Forecast, 2019-2031
- 8.1. Market Analysis, Insights and Forecast - by Solution
- 8.1.1. Software
- 8.1.2. Services
- 8.2. Market Analysis, Insights and Forecast - by Deployment
- 8.2.1. On-Premise
- 8.2.2. Cloud
- 8.3. Market Analysis, Insights and Forecast - by Industry
- 8.3.1. Automotive
- 8.3.2. Engineering & Construction
- 8.3.3. Logistics & Transportation
- 8.3.4. Energy & Utilities
- 8.3.5. Telecommunication
- 8.3.6. Other Industries
- 8.1. Market Analysis, Insights and Forecast - by Solution
- 9. Rest of the World Digital Map Market Analysis, Insights and Forecast, 2019-2031
- 9.1. Market Analysis, Insights and Forecast - by Solution
- 9.1.1. Software
- 9.1.2. Services
- 9.2. Market Analysis, Insights and Forecast - by Deployment
- 9.2.1. On-Premise
- 9.2.2. Cloud
- 9.3. Market Analysis, Insights and Forecast - by Industry
- 9.3.1. Automotive
- 9.3.2. Engineering & Construction
- 9.3.3. Logistics & Transportation
- 9.3.4. Energy & Utilities
- 9.3.5. Telecommunication
- 9.3.6. Other Industries
- 9.1. Market Analysis, Insights and Forecast - by Solution
- 10. North America Digital Map Market Analysis, Insights and Forecast, 2019-2031
- 10.1. Market Analysis, Insights and Forecast - By Country/Sub-region
- 10.1.1 United States
- 10.1.2 Canada
- 10.1.3 Mexico
- 11. Europe Digital Map Market Analysis, Insights and Forecast, 2019-2031
- 11.1. Market Analysis, Insights and Forecast - By Country/Sub-region
- 11.1.1 Germany
- 11.1.2 United Kingdom
- 11.1.3 France
- 11.1.4 Spain
- 11.1.5 Italy
- 11.1.6 Spain
- 11.1.7 Belgium
- 11.1.8 Netherland
- 11.1.9 Nordics
- 11.1.10 Rest of Europe
- 12. Asia Pacific Digital Map Market Analysis, Insights and Forecast, 2019-2031
- 12.1. Market Analysis, Insights and Forecast - By Country/Sub-region
- 12.1.1 China
- 12.1.2 Japan
- 12.1.3 India
- 12.1.4 South Korea
- 12.1.5 Southeast Asia
- 12.1.6 Australia
- 12.1.7 Indonesia
- 12.1.8 Phillipes
- 12.1.9 Singapore
- 12.1.10 Thailandc
- 12.1.11 Rest of Asia Pacific
- 13. South America Digital Map Market Analysis, Insights and Forecast, 2019-2031
- 13.1. Market Analysis, Insights and Forecast - By Country/Sub-region
- 13.1.1 Brazil
- 13.1.2 Argentina
- 13.1.3 Peru
- 13.1.4 Chile
- 13.1.5 Colombia
- 13.1.6 Ecuador
- 13.1.7 Venezuela
- 13.1.8 Rest of South America
- 14. North America Digital Map Market Analysis, Insights and Forecast, 2019-2031
- 14.1. Market Analysis, Insights and Forecast - By Country/Sub-region
- 14.1.1 United States
- 14.1.2 Canada
- 14.1.3 Mexico
- 15. MEA Digital Map Market Analysis, Insights and Forecast, 2019-2031
- 15.1. Market Analysis, Insights and Forecast - By Country/Sub-region
- 15.1.1 United Arab Emirates
- 15.1.2 Saudi Arabia
- 15.1.3 South Africa
- 15.1.4 Rest of Middle East and Africa
- 16. Competitive Analysis
- 16.1. Global Market Share Analysis 2024
- 16.2. Company Profiles
- 16.2.1 Mapbox
- 16.2.1.1. Overview
- 16.2.1.2. Products
- 16.2.1.3. SWOT Analysis
- 16.2.1.4. Recent Developments
- 16.2.1.5. Financials (Based on Availability)
- 16.2.2 Lepton Software
- 16.2.2.1. Overview
- 16.2.2.2. Products
- 16.2.2.3. SWOT Analysis
- 16.2.2.4. Recent Developments
- 16.2.2.5. Financials (Based on Availability)
- 16.2.3 Digital Mapping Solutions
- 16.2.3.1. Overview
- 16.2.3.2. Products
- 16.2.3.3. SWOT Analysis
- 16.2.3.4. Recent Developments
- 16.2.3.5. Financials (Based on Availability)
- 16.2.4 Maxar Technologies (DigitalGlobe)
- 16.2.4.1. Overview
- 16.2.4.2. Products
- 16.2.4.3. SWOT Analysis
- 16.2.4.4. Recent Developments
- 16.2.4.5. Financials (Based on Availability)
- 16.2.5 Google LLC (Alphabet Inc )
- 16.2.5.1. Overview
- 16.2.5.2. Products
- 16.2.5.3. SWOT Analysis
- 16.2.5.4. Recent Developments
- 16.2.5.5. Financials (Based on Availability)
- 16.2.6 Collins Bartholomew Ltd
- 16.2.6.1. Overview
- 16.2.6.2. Products
- 16.2.6.3. SWOT Analysis
- 16.2.6.4. Recent Developments
- 16.2.6.5. Financials (Based on Availability)
- 16.2.7 DMTI Spatial
- 16.2.7.1. Overview
- 16.2.7.2. Products
- 16.2.7.3. SWOT Analysis
- 16.2.7.4. Recent Developments
- 16.2.7.5. Financials (Based on Availability)
- 16.2.8 Digital Map Products Inc
- 16.2.8.1. Overview
- 16.2.8.2. Products
- 16.2.8.3. SWOT Analysis
- 16.2.8.4. Recent Developments
- 16.2.8.5. Financials (Based on Availability)
- 16.2.9 ThinkGeo LLC
- 16.2.9.1. Overview
- 16.2.9.2. Products
- 16.2.9.3. SWOT Analysis
- 16.2.9.4. Recent Developments
- 16.2.9.5. Financials (Based on Availability)
- 16.2.10 MapData Services Pty Ltd
- 16.2.10.1. Overview
- 16.2.10.2. Products
- 16.2.10.3. SWOT Analysis
- 16.2.10.4. Recent Developments
- 16.2.10.5. Financials (Based on Availability)
- 16.2.11 ESRI Business Information Solutions Inc
- 16.2.11.1. Overview
- 16.2.11.2. Products
- 16.2.11.3. SWOT Analysis
- 16.2.11.4. Recent Developments
- 16.2.11.5. Financials (Based on Availability)
- 16.2.12 TomTom International B V *List Not Exhaustive
- 16.2.12.1. Overview
- 16.2.12.2. Products
- 16.2.12.3. SWOT Analysis
- 16.2.12.4. Recent Developments
- 16.2.12.5. Financials (Based on Availability)
- 16.2.13 HERE Technologies
- 16.2.13.1. Overview
- 16.2.13.2. Products
- 16.2.13.3. SWOT Analysis
- 16.2.13.4. Recent Developments
- 16.2.13.5. Financials (Based on Availability)
- 16.2.1 Mapbox
List of Figures
- Figure 1: Global Digital Map Market Revenue Breakdown (Million, %) by Region 2024 & 2032
- Figure 2: North America Digital Map Market Revenue (Million), by Country 2024 & 2032
- Figure 3: North America Digital Map Market Revenue Share (%), by Country 2024 & 2032
- Figure 4: Europe Digital Map Market Revenue (Million), by Country 2024 & 2032
- Figure 5: Europe Digital Map Market Revenue Share (%), by Country 2024 & 2032
- Figure 6: Asia Pacific Digital Map Market Revenue (Million), by Country 2024 & 2032
- Figure 7: Asia Pacific Digital Map Market Revenue Share (%), by Country 2024 & 2032
- Figure 8: South America Digital Map Market Revenue (Million), by Country 2024 & 2032
- Figure 9: South America Digital Map Market Revenue Share (%), by Country 2024 & 2032
- Figure 10: North America Digital Map Market Revenue (Million), by Country 2024 & 2032
- Figure 11: North America Digital Map Market Revenue Share (%), by Country 2024 & 2032
- Figure 12: MEA Digital Map Market Revenue (Million), by Country 2024 & 2032
- Figure 13: MEA Digital Map Market Revenue Share (%), by Country 2024 & 2032
- Figure 14: North America Digital Map Market Revenue (Million), by Solution 2024 & 2032
- Figure 15: North America Digital Map Market Revenue Share (%), by Solution 2024 & 2032
- Figure 16: North America Digital Map Market Revenue (Million), by Deployment 2024 & 2032
- Figure 17: North America Digital Map Market Revenue Share (%), by Deployment 2024 & 2032
- Figure 18: North America Digital Map Market Revenue (Million), by Industry 2024 & 2032
- Figure 19: North America Digital Map Market Revenue Share (%), by Industry 2024 & 2032
- Figure 20: North America Digital Map Market Revenue (Million), by Country 2024 & 2032
- Figure 21: North America Digital Map Market Revenue Share (%), by Country 2024 & 2032
- Figure 22: Europe Digital Map Market Revenue (Million), by Solution 2024 & 2032
- Figure 23: Europe Digital Map Market Revenue Share (%), by Solution 2024 & 2032
- Figure 24: Europe Digital Map Market Revenue (Million), by Deployment 2024 & 2032
- Figure 25: Europe Digital Map Market Revenue Share (%), by Deployment 2024 & 2032
- Figure 26: Europe Digital Map Market Revenue (Million), by Industry 2024 & 2032
- Figure 27: Europe Digital Map Market Revenue Share (%), by Industry 2024 & 2032
- Figure 28: Europe Digital Map Market Revenue (Million), by Country 2024 & 2032
- Figure 29: Europe Digital Map Market Revenue Share (%), by Country 2024 & 2032
- Figure 30: Asia Pacific Digital Map Market Revenue (Million), by Solution 2024 & 2032
- Figure 31: Asia Pacific Digital Map Market Revenue Share (%), by Solution 2024 & 2032
- Figure 32: Asia Pacific Digital Map Market Revenue (Million), by Deployment 2024 & 2032
- Figure 33: Asia Pacific Digital Map Market Revenue Share (%), by Deployment 2024 & 2032
- Figure 34: Asia Pacific Digital Map Market Revenue (Million), by Industry 2024 & 2032
- Figure 35: Asia Pacific Digital Map Market Revenue Share (%), by Industry 2024 & 2032
- Figure 36: Asia Pacific Digital Map Market Revenue (Million), by Country 2024 & 2032
- Figure 37: Asia Pacific Digital Map Market Revenue Share (%), by Country 2024 & 2032
- Figure 38: Rest of the World Digital Map Market Revenue (Million), by Solution 2024 & 2032
- Figure 39: Rest of the World Digital Map Market Revenue Share (%), by Solution 2024 & 2032
- Figure 40: Rest of the World Digital Map Market Revenue (Million), by Deployment 2024 & 2032
- Figure 41: Rest of the World Digital Map Market Revenue Share (%), by Deployment 2024 & 2032
- Figure 42: Rest of the World Digital Map Market Revenue (Million), by Industry 2024 & 2032
- Figure 43: Rest of the World Digital Map Market Revenue Share (%), by Industry 2024 & 2032
- Figure 44: Rest of the World Digital Map Market Revenue (Million), by Country 2024 & 2032
- Figure 45: Rest of the World Digital Map Market Revenue Share (%), by Country 2024 & 2032
List of Tables
- Table 1: Global Digital Map Market Revenue Million Forecast, by Region 2019 & 2032
- Table 2: Global Digital Map Market Revenue Million Forecast, by Solution 2019 & 2032
- Table 3: Global Digital Map Market Revenue Million Forecast, by Deployment 2019 & 2032
- Table 4: Global Digital Map Market Revenue Million Forecast, by Industry 2019 & 2032
- Table 5: Global Digital Map Market Revenue Million Forecast, by Region 2019 & 2032
- Table 6: Global Digital Map Market Revenue Million Forecast, by Country 2019 & 2032
- Table 7: United States Digital Map Market Revenue (Million) Forecast, by Application 2019 & 2032
- Table 8: Canada Digital Map Market Revenue (Million) Forecast, by Application 2019 & 2032
- Table 9: Mexico Digital Map Market Revenue (Million) Forecast, by Application 2019 & 2032
- Table 10: Global Digital Map Market Revenue Million Forecast, by Country 2019 & 2032
- Table 11: Germany Digital Map Market Revenue (Million) Forecast, by Application 2019 & 2032
- Table 12: United Kingdom Digital Map Market Revenue (Million) Forecast, by Application 2019 & 2032
- Table 13: France Digital Map Market Revenue (Million) Forecast, by Application 2019 & 2032
- Table 14: Spain Digital Map Market Revenue (Million) Forecast, by Application 2019 & 2032
- Table 15: Italy Digital Map Market Revenue (Million) Forecast, by Application 2019 & 2032
- Table 16: Spain Digital Map Market Revenue (Million) Forecast, by Application 2019 & 2032
- Table 17: Belgium Digital Map Market Revenue (Million) Forecast, by Application 2019 & 2032
- Table 18: Netherland Digital Map Market Revenue (Million) Forecast, by Application 2019 & 2032
- Table 19: Nordics Digital Map Market Revenue (Million) Forecast, by Application 2019 & 2032
- Table 20: Rest of Europe Digital Map Market Revenue (Million) Forecast, by Application 2019 & 2032
- Table 21: Global Digital Map Market Revenue Million Forecast, by Country 2019 & 2032
- Table 22: China Digital Map Market Revenue (Million) Forecast, by Application 2019 & 2032
- Table 23: Japan Digital Map Market Revenue (Million) Forecast, by Application 2019 & 2032
- Table 24: India Digital Map Market Revenue (Million) Forecast, by Application 2019 & 2032
- Table 25: South Korea Digital Map Market Revenue (Million) Forecast, by Application 2019 & 2032
- Table 26: Southeast Asia Digital Map Market Revenue (Million) Forecast, by Application 2019 & 2032
- Table 27: Australia Digital Map Market Revenue (Million) Forecast, by Application 2019 & 2032
- Table 28: Indonesia Digital Map Market Revenue (Million) Forecast, by Application 2019 & 2032
- Table 29: Phillipes Digital Map Market Revenue (Million) Forecast, by Application 2019 & 2032
- Table 30: Singapore Digital Map Market Revenue (Million) Forecast, by Application 2019 & 2032
- Table 31: Thailandc Digital Map Market Revenue (Million) Forecast, by Application 2019 & 2032
- Table 32: Rest of Asia Pacific Digital Map Market Revenue (Million) Forecast, by Application 2019 & 2032
- Table 33: Global Digital Map Market Revenue Million Forecast, by Country 2019 & 2032
- Table 34: Brazil Digital Map Market Revenue (Million) Forecast, by Application 2019 & 2032
- Table 35: Argentina Digital Map Market Revenue (Million) Forecast, by Application 2019 & 2032
- Table 36: Peru Digital Map Market Revenue (Million) Forecast, by Application 2019 & 2032
- Table 37: Chile Digital Map Market Revenue (Million) Forecast, by Application 2019 & 2032
- Table 38: Colombia Digital Map Market Revenue (Million) Forecast, by Application 2019 & 2032
- Table 39: Ecuador Digital Map Market Revenue (Million) Forecast, by Application 2019 & 2032
- Table 40: Venezuela Digital Map Market Revenue (Million) Forecast, by Application 2019 & 2032
- Table 41: Rest of South America Digital Map Market Revenue (Million) Forecast, by Application 2019 & 2032
- Table 42: Global Digital Map Market Revenue Million Forecast, by Country 2019 & 2032
- Table 43: United States Digital Map Market Revenue (Million) Forecast, by Application 2019 & 2032
- Table 44: Canada Digital Map Market Revenue (Million) Forecast, by Application 2019 & 2032
- Table 45: Mexico Digital Map Market Revenue (Million) Forecast, by Application 2019 & 2032
- Table 46: Global Digital Map Market Revenue Million Forecast, by Country 2019 & 2032
- Table 47: United Arab Emirates Digital Map Market Revenue (Million) Forecast, by Application 2019 & 2032
- Table 48: Saudi Arabia Digital Map Market Revenue (Million) Forecast, by Application 2019 & 2032
- Table 49: South Africa Digital Map Market Revenue (Million) Forecast, by Application 2019 & 2032
- Table 50: Rest of Middle East and Africa Digital Map Market Revenue (Million) Forecast, by Application 2019 & 2032
- Table 51: Global Digital Map Market Revenue Million Forecast, by Solution 2019 & 2032
- Table 52: Global Digital Map Market Revenue Million Forecast, by Deployment 2019 & 2032
- Table 53: Global Digital Map Market Revenue Million Forecast, by Industry 2019 & 2032
- Table 54: Global Digital Map Market Revenue Million Forecast, by Country 2019 & 2032
- Table 55: United States Digital Map Market Revenue (Million) Forecast, by Application 2019 & 2032
- Table 56: Canada Digital Map Market Revenue (Million) Forecast, by Application 2019 & 2032
- Table 57: Global Digital Map Market Revenue Million Forecast, by Solution 2019 & 2032
- Table 58: Global Digital Map Market Revenue Million Forecast, by Deployment 2019 & 2032
- Table 59: Global Digital Map Market Revenue Million Forecast, by Industry 2019 & 2032
- Table 60: Global Digital Map Market Revenue Million Forecast, by Country 2019 & 2032
- Table 61: United Kingdom Digital Map Market Revenue (Million) Forecast, by Application 2019 & 2032
- Table 62: Germany Digital Map Market Revenue (Million) Forecast, by Application 2019 & 2032
- Table 63: France Digital Map Market Revenue (Million) Forecast, by Application 2019 & 2032
- Table 64: Rest of Europe Digital Map Market Revenue (Million) Forecast, by Application 2019 & 2032
- Table 65: Global Digital Map Market Revenue Million Forecast, by Solution 2019 & 2032
- Table 66: Global Digital Map Market Revenue Million Forecast, by Deployment 2019 & 2032
- Table 67: Global Digital Map Market Revenue Million Forecast, by Industry 2019 & 2032
- Table 68: Global Digital Map Market Revenue Million Forecast, by Country 2019 & 2032
- Table 69: China Digital Map Market Revenue (Million) Forecast, by Application 2019 & 2032
- Table 70: Japan Digital Map Market Revenue (Million) Forecast, by Application 2019 & 2032
- Table 71: India Digital Map Market Revenue (Million) Forecast, by Application 2019 & 2032
- Table 72: Rest of Asia Pacific Digital Map Market Revenue (Million) Forecast, by Application 2019 & 2032
- Table 73: Global Digital Map Market Revenue Million Forecast, by Solution 2019 & 2032
- Table 74: Global Digital Map Market Revenue Million Forecast, by Deployment 2019 & 2032
- Table 75: Global Digital Map Market Revenue Million Forecast, by Industry 2019 & 2032
- Table 76: Global Digital Map Market Revenue Million Forecast, by Country 2019 & 2032
Frequently Asked Questions
1. What is the projected Compound Annual Growth Rate (CAGR) of the Digital Map Market?
The projected CAGR is approximately 13.39%.
2. Which companies are prominent players in the Digital Map Market?
Key companies in the market include Mapbox, Lepton Software, Digital Mapping Solutions, Maxar Technologies (DigitalGlobe), Google LLC (Alphabet Inc ), Collins Bartholomew Ltd, DMTI Spatial, Digital Map Products Inc, ThinkGeo LLC, MapData Services Pty Ltd, ESRI Business Information Solutions Inc, TomTom International B V *List Not Exhaustive, HERE Technologies.
3. What are the main segments of the Digital Map Market?
The market segments include Solution, Deployment, Industry.
4. Can you provide details about the market size?
The market size is estimated to be USD 25.55 Million as of 2022.
5. What are some drivers contributing to market growth?
Growth in Application for Advanced Navigation System in Automotive Industry; Surge in Demand for Geographic Information System (GIS); Increased Adoption of Connected Devices and Internet.
6. What are the notable trends driving market growth?
Surge in Demand for GIS and GNSS to Influence the Adoption of Digital Map Technology.
7. Are there any restraints impacting market growth?
Complexity in Integration of Traditional Maps with Modern GIS System.
8. Can you provide examples of recent developments in the market?
December 2022 - The Linux Foundation has partnered with some of the biggest technology companies in the world to build interoperable and open map data in what is an apparent move t. The Overture Maps Foundation, as the new effort is called, is officially hosted by the Linux Foundation. The ultimate aim of the Overture Maps Foundation is to power new map products through openly available datasets that can be used and reused across applications and businesses, with each member throwing their data and resources into the mix.
9. What pricing options are available for accessing the report?
Pricing options include single-user, multi-user, and enterprise licenses priced at USD 4750, USD 5250, and USD 8750 respectively.
10. Is the market size provided in terms of value or volume?
The market size is provided in terms of value, measured in Million.
11. Are there any specific market keywords associated with the report?
Yes, the market keyword associated with the report is "Digital Map Market," which aids in identifying and referencing the specific market segment covered.
12. How do I determine which pricing option suits my needs best?
The pricing options vary based on user requirements and access needs. Individual users may opt for single-user licenses, while businesses requiring broader access may choose multi-user or enterprise licenses for cost-effective access to the report.
13. Are there any additional resources or data provided in the Digital Map Market report?
While the report offers comprehensive insights, it's advisable to review the specific contents or supplementary materials provided to ascertain if additional resources or data are available.
14. How can I stay updated on further developments or reports in the Digital Map Market?
To stay informed about further developments, trends, and reports in the Digital Map Market, consider subscribing to industry newsletters, following relevant companies and organizations, or regularly checking reputable industry news sources and publications.
Methodology
Step 1 - Identification of Relevant Samples Size from Population Database


Step 2 - Approaches for Defining Global Market Size (Value, Volume* & Price*)

Note*: In applicable scenarios
Step 3 - Data Sources
Primary Research
- Web Analytics
- Survey Reports
- Research Institute
- Latest Research Reports
- Opinion Leaders
Secondary Research
- Annual Reports
- White Paper
- Latest Press Release
- Industry Association
- Paid Database
- Investor Presentations

Step 4 - Data Triangulation
Involves using different sources of information in order to increase the validity of a study
These sources are likely to be stakeholders in a program - participants, other researchers, program staff, other community members, and so on.
Then we put all data in single framework & apply various statistical tools to find out the dynamic on the market.
During the analysis stage, feedback from the stakeholder groups would be compared to determine areas of agreement as well as areas of divergence
