

Key Insights
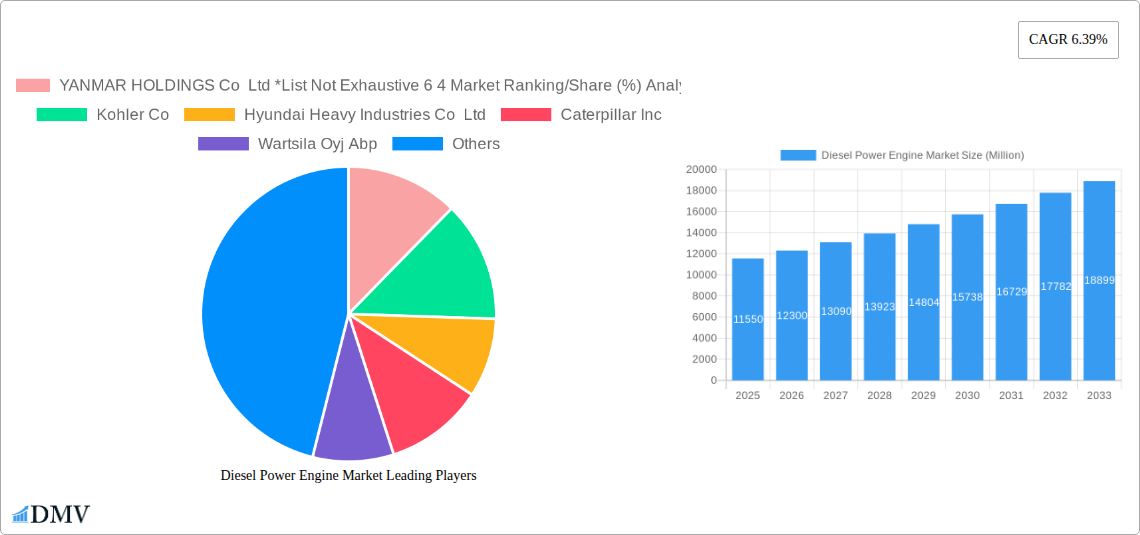
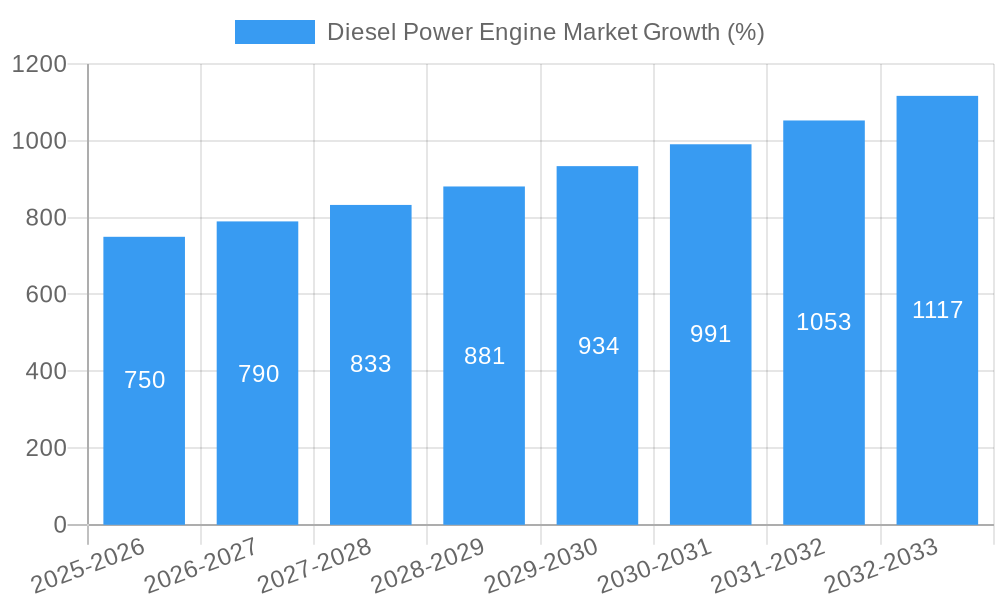
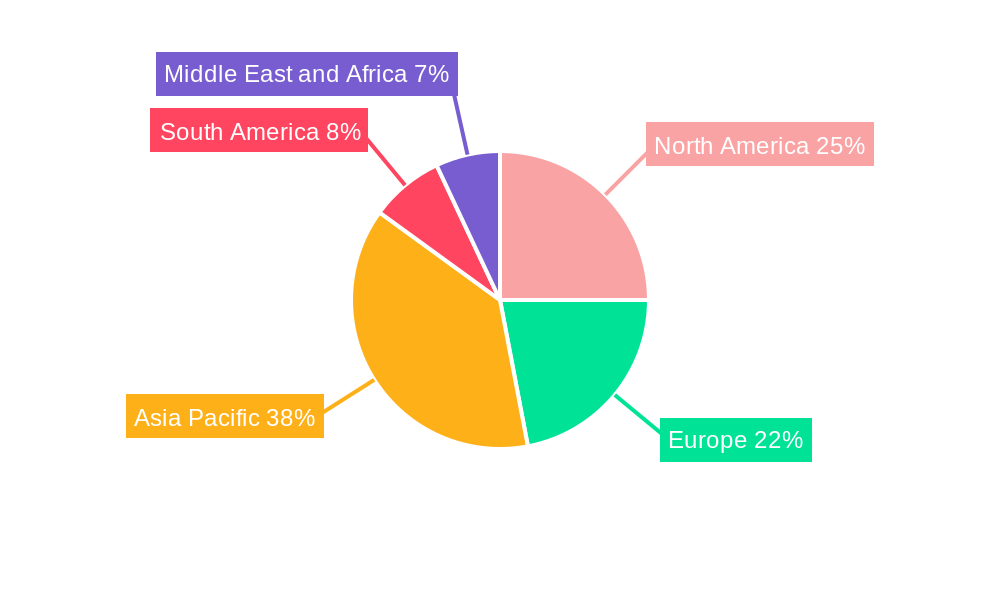
The global diesel power engine market, valued at $11.55 billion in 2025, is projected to experience robust growth, driven by increasing industrialization, particularly in developing economies across Asia-Pacific and the Middle East & Africa. The market's Compound Annual Growth Rate (CAGR) of 6.39% from 2025 to 2033 indicates significant expansion opportunities. Key growth drivers include rising demand for reliable power sources in remote areas with limited grid access, the increasing adoption of diesel engines in construction, mining, and agriculture, and the ongoing development of more fuel-efficient and environmentally friendly diesel engine technologies. However, stringent emission regulations and the growing popularity of alternative power sources like natural gas and renewables represent significant constraints to market growth. The market is segmented by end-user (industrial, commercial, residential) and application (standby, prime, peak shaving). The industrial segment currently holds the largest market share due to the extensive use of diesel engines in heavy-duty machinery and power generation. The standby application segment is also experiencing strong growth, fueled by the need for backup power in critical infrastructure and facilities. Leading players such as Yanmar Holdings, Kohler, Caterpillar, and Cummins are actively investing in research and development to enhance engine efficiency and reduce emissions, further shaping market dynamics. The competitive landscape is characterized by intense rivalry among established players and emerging manufacturers. Regional variations in market growth are expected, with Asia-Pacific anticipated to witness the most substantial growth, followed by North America and Europe.
The forecast period (2025-2033) anticipates a continued shift towards higher-efficiency diesel engines, propelled by advancements in fuel injection systems and turbocharging technology. While the transition towards cleaner energy sources presents a long-term challenge, the short-to-medium-term outlook remains positive, given the continued reliance on diesel power, particularly in sectors where electrification or alternative fuels are not yet economically feasible or technologically mature. Continued investments in infrastructure projects across various regions are expected to further bolster the demand for diesel power engines. The market will likely see increased consolidation, mergers, and acquisitions as companies strive to enhance their market position and technological capabilities.
Diesel Power Engine Market: A Comprehensive Report (2019-2033)
This insightful report provides a detailed analysis of the global Diesel Power Engine Market, offering a comprehensive overview of market trends, competitive dynamics, and future growth prospects. Covering the period from 2019 to 2033, with a focus on 2025, this study is essential for stakeholders seeking to understand and capitalize on opportunities within this dynamic sector. The report's in-depth analysis, encompassing market sizing (in Millions), segmentation, and key player activities, empowers informed decision-making and strategic planning.
Diesel Power Engine Market Composition & Trends
This section delves into the market's competitive landscape, analyzing market concentration and the influence of innovation, regulatory changes, and substitute products. We examine end-user profiles and the impact of mergers and acquisitions (M&A) activities on market share distribution. The report includes a granular analysis of the top 10 players, including YANMAR HOLDINGS Co Ltd, Kohler Co, Hyundai Heavy Industries Co Ltd, Caterpillar Inc, Wartsila Oyj Abp, Cummins Inc, Volvo AB, Man SE, Mitsubishi Heavy Industries Ltd, and Rolls-Royce Holding PLC, providing a detailed 6-4 Market Ranking/Share (%) Analysis and assessing their strategic moves. Data on M&A deal values, while not publicly available for all transactions, will be estimated to illustrate the market's consolidation trends. The xx Million total M&A deal value in the past five years reflects significant activity in the sector.
- Market Concentration: Analysis of market share held by the top players, revealing the level of competition and potential for consolidation.
- Innovation Catalysts: Examination of technological advancements, such as the integration of hydrogen injection systems and the use of alternative fuels like HVO, driving market innovation.
- Regulatory Landscape: Assessment of evolving emission standards (e.g., EU Stage V, US EPA Tier 4 Final) and their impact on engine design and adoption.
- Substitute Products: Evaluation of alternative power sources and their potential to disrupt the diesel power engine market.
- End-User Profiles: Detailed analysis of the industrial, commercial, and residential end-user segments, highlighting their unique needs and purchasing patterns.
- M&A Activities: Overview of recent mergers and acquisitions, including deal values and their implications for market dynamics.
Diesel Power Engine Market Industry Evolution
This section analyzes the historical (2019-2024) and forecast (2025-2033) growth trajectories of the diesel power engine market. We explore the impact of technological advancements, such as the development of more fuel-efficient and emission-compliant engines and the integration of digital technologies. The evolving consumer demands for sustainable and cost-effective power solutions are also examined, considering factors like increasing environmental regulations and fluctuating fuel prices. We project a Compound Annual Growth Rate (CAGR) of xx% during the forecast period (2025-2033), driven by increasing demand from specific end-user segments and technological improvements in engine efficiency and emissions reduction.
Leading Regions, Countries, or Segments in Diesel Power Engine Market
This section identifies the dominant regions, countries, or segments within the market. The analysis considers factors like infrastructure development, industrial growth, and government policies. The Industrial sector is currently the leading end-user segment, driven by robust demand from construction and manufacturing. Similarly, the Prime application dominates due to the reliability and efficiency associated with continuous power generation.
- Key Drivers (Industrial Segment):
- Strong growth in infrastructure development projects.
- Increased industrial production across various sectors.
- Government investments in infrastructure modernization.
- Key Drivers (Prime Application):
- Requirement for reliable power in essential services (hospitals, data centers).
- High operational efficiency compared to other applications.
- Long-term cost-effectiveness and low maintenance.
- In-depth analysis of dominance factors: Detailed examination of the economic, technological, and regulatory factors that underpin the leading segments' market share. This includes an assessment of regional disparities, competitive landscapes, and emerging trends.
Diesel Power Engine Market Product Innovations
Recent innovations focus on improving fuel efficiency, reducing emissions, and enhancing engine durability. Manufacturers are actively integrating advanced technologies, such as selective catalytic reduction (SCR) systems and exhaust gas recirculation (EGR) to meet stringent environmental regulations. The introduction of new engine series (e.g., Caterpillar's new IPUs) incorporating advanced emission control technologies demonstrates a clear commitment to producing greener engines. These innovations also translate into improved performance metrics, such as increased power output and enhanced reliability, while simultaneously aiming for cost reductions for consumers.
Propelling Factors for Diesel Power Engine Market Growth
Several key factors are driving the growth of the diesel power engine market. These include increasing industrialization and urbanization, growing demand for reliable power sources in developing countries, and technological advancements that enhance engine efficiency and reduce emissions. Government regulations promoting sustainable energy sources, albeit focused on reducing emissions, also indirectly support the market by pushing innovation toward cleaner diesel technologies. Furthermore, cost-effective engine options compared to alternatives are fueling market expansion in certain sectors.
Obstacles in the Diesel Power Engine Market
The diesel power engine market faces significant challenges, including stringent emission regulations, the increasing availability of alternative power solutions (renewables, etc.), and potential supply chain disruptions impacting raw materials and manufacturing. The rising cost of raw materials, coupled with fluctuating fuel prices, adds further pressure on manufacturers and consumers. These factors can constrain market growth and increase the pressure on innovation and cost optimization. The xx% decrease in production observed during 2022 highlights these supply chain difficulties.
Future Opportunities in Diesel Power Engine Market
Future opportunities lie in developing cleaner, more efficient, and sustainable diesel engine technologies. This includes exploring alternative fuels, such as HVO and biodiesels, and integrating advanced emission control systems. Growth will also be supported by expanding into new markets, particularly in developing economies experiencing rapid industrialization. The increasing demand for off-grid and backup power solutions also presents a significant growth opportunity.
Major Players in the Diesel Power Engine Market Ecosystem
- YANMAR HOLDINGS Co Ltd
- Kohler Co
- Hyundai Heavy Industries Co Ltd
- Caterpillar Inc
- Wartsila Oyj Abp
- Cummins Inc
- Volvo AB
- Man SE
- Mitsubishi Heavy Industries Ltd
- Rolls-Royce Holding PLC
Key Developments in Diesel Power Engine Market Industry
- October 2023: Mitsubishi Heavy Industries Engine & Turbocharger Ltd (MHIET) approved the use of unblended HVO fuel (EN15940 compliant) in several engine series (SM, SD, SB, SA, SH, SR, and SU), impacting fuel choices and potentially reducing emissions.
- August 2023: United H2 Limited (UHL) launched hydrogen injection kits for diesel engines, offering a pathway towards reducing emissions and fuel costs in the oil & gas and mining sectors.
- May 2023: Caterpillar introduced two new industrial diesel power units (74-134 hp) meeting stringent emission standards (EU Stage V, US EPA Tier 4 Final, etc.), demonstrating the commitment to compliant and competitive power solutions.
Strategic Diesel Power Engine Market Forecast
The diesel power engine market is poised for continued growth, driven by ongoing industrialization, infrastructure development, and the increasing adoption of more efficient and cleaner technologies. While challenges remain regarding emissions regulations and competition from alternative power sources, the market's adaptability and ongoing innovations suggest a positive outlook. The focus on reducing emissions, improving fuel efficiency, and expanding into new markets will drive market expansion in the coming years.
Diesel Power Engine Market Segmentation
-
1. End User
- 1.1. Industrial
- 1.2. Commercial
- 1.3. Residential
-
2. Application
- 2.1. Standby
- 2.2. Prime
- 2.3. Peak Shaving
Diesel Power Engine Market Segmentation By Geography
-
1. North America
- 1.1. United States
- 1.2. Canada
- 1.3. Rest of North America
-
2. Europe
- 2.1. United Kingdom
- 2.2. France
- 2.3. Germany
- 2.4. Spain
- 2.5. Rest of Europe
-
3. Asia Pacific
- 3.1. China
- 3.2. India
- 3.3. ASEAN Countries
- 3.4. Australia
- 3.5. Rest of Asia Pacific
-
4. South America
- 4.1. Brazil
- 4.2. Argentina
- 4.3. Rest of South America
-
5. Middle East and Africa
- 5.1. Saudi Arabia
- 5.2. Nigeria
- 5.3. South Africa
- 5.4. Rest of Middle East and Africa
Diesel Power Engine Market REPORT HIGHLIGHTS
| Aspects | Details |
|---|---|
| Study Period | 2019-2033 |
| Base Year | 2024 |
| Estimated Year | 2025 |
| Forecast Period | 2025-2033 |
| Historical Period | 2019-2024 |
| Growth Rate | CAGR of 6.39% from 2019-2033 |
| Segmentation |
|
Table of Contents
- 1. Introduction
- 1.1. Research Scope
- 1.2. Market Segmentation
- 1.3. Research Methodology
- 1.4. Definitions and Assumptions
- 2. Executive Summary
- 2.1. Introduction
- 3. Market Dynamics
- 3.1. Introduction
- 3.2. Market Drivers
- 3.2.1. 4.; Increasing Demand From Industrial Sector4.; Rising Power Outages To Increase The Demand For Diesel Generators
- 3.3. Market Restrains
- 3.3.1. 4.; Increasing Shift Toward Cleaner Energy Resources
- 3.4. Market Trends
- 3.4.1. The Industrial Segment to Dominate the Market
- 4. Market Factor Analysis
- 4.1. Porters Five Forces
- 4.2. Supply/Value Chain
- 4.3. PESTEL analysis
- 4.4. Market Entropy
- 4.5. Patent/Trademark Analysis
- 5. Global Diesel Power Engine Market Analysis, Insights and Forecast, 2019-2031
- 5.1. Market Analysis, Insights and Forecast - by End User
- 5.1.1. Industrial
- 5.1.2. Commercial
- 5.1.3. Residential
- 5.2. Market Analysis, Insights and Forecast - by Application
- 5.2.1. Standby
- 5.2.2. Prime
- 5.2.3. Peak Shaving
- 5.3. Market Analysis, Insights and Forecast - by Region
- 5.3.1. North America
- 5.3.2. Europe
- 5.3.3. Asia Pacific
- 5.3.4. South America
- 5.3.5. Middle East and Africa
- 5.1. Market Analysis, Insights and Forecast - by End User
- 6. North America Diesel Power Engine Market Analysis, Insights and Forecast, 2019-2031
- 6.1. Market Analysis, Insights and Forecast - by End User
- 6.1.1. Industrial
- 6.1.2. Commercial
- 6.1.3. Residential
- 6.2. Market Analysis, Insights and Forecast - by Application
- 6.2.1. Standby
- 6.2.2. Prime
- 6.2.3. Peak Shaving
- 6.1. Market Analysis, Insights and Forecast - by End User
- 7. Europe Diesel Power Engine Market Analysis, Insights and Forecast, 2019-2031
- 7.1. Market Analysis, Insights and Forecast - by End User
- 7.1.1. Industrial
- 7.1.2. Commercial
- 7.1.3. Residential
- 7.2. Market Analysis, Insights and Forecast - by Application
- 7.2.1. Standby
- 7.2.2. Prime
- 7.2.3. Peak Shaving
- 7.1. Market Analysis, Insights and Forecast - by End User
- 8. Asia Pacific Diesel Power Engine Market Analysis, Insights and Forecast, 2019-2031
- 8.1. Market Analysis, Insights and Forecast - by End User
- 8.1.1. Industrial
- 8.1.2. Commercial
- 8.1.3. Residential
- 8.2. Market Analysis, Insights and Forecast - by Application
- 8.2.1. Standby
- 8.2.2. Prime
- 8.2.3. Peak Shaving
- 8.1. Market Analysis, Insights and Forecast - by End User
- 9. South America Diesel Power Engine Market Analysis, Insights and Forecast, 2019-2031
- 9.1. Market Analysis, Insights and Forecast - by End User
- 9.1.1. Industrial
- 9.1.2. Commercial
- 9.1.3. Residential
- 9.2. Market Analysis, Insights and Forecast - by Application
- 9.2.1. Standby
- 9.2.2. Prime
- 9.2.3. Peak Shaving
- 9.1. Market Analysis, Insights and Forecast - by End User
- 10. Middle East and Africa Diesel Power Engine Market Analysis, Insights and Forecast, 2019-2031
- 10.1. Market Analysis, Insights and Forecast - by End User
- 10.1.1. Industrial
- 10.1.2. Commercial
- 10.1.3. Residential
- 10.2. Market Analysis, Insights and Forecast - by Application
- 10.2.1. Standby
- 10.2.2. Prime
- 10.2.3. Peak Shaving
- 10.1. Market Analysis, Insights and Forecast - by End User
- 11. North America Diesel Power Engine Market Analysis, Insights and Forecast, 2019-2031
- 11.1. Market Analysis, Insights and Forecast - By Country/Sub-region
- 11.1.1 United States
- 11.1.2 Canada
- 11.1.3 Rest of North America
- 12. Europe Diesel Power Engine Market Analysis, Insights and Forecast, 2019-2031
- 12.1. Market Analysis, Insights and Forecast - By Country/Sub-region
- 12.1.1 United Kingdom
- 12.1.2 France
- 12.1.3 Germany
- 12.1.4 Spain
- 12.1.5 Rest of Europe
- 13. Asia Pacific Diesel Power Engine Market Analysis, Insights and Forecast, 2019-2031
- 13.1. Market Analysis, Insights and Forecast - By Country/Sub-region
- 13.1.1 China
- 13.1.2 India
- 13.1.3 ASEAN Countries
- 13.1.4 Australia
- 13.1.5 Rest of Asia Pacific
- 14. South America Diesel Power Engine Market Analysis, Insights and Forecast, 2019-2031
- 14.1. Market Analysis, Insights and Forecast - By Country/Sub-region
- 14.1.1 Brazil
- 14.1.2 Argentina
- 14.1.3 Rest of South America
- 15. Middle East and Africa Diesel Power Engine Market Analysis, Insights and Forecast, 2019-2031
- 15.1. Market Analysis, Insights and Forecast - By Country/Sub-region
- 15.1.1 Saudi Arabia
- 15.1.2 Nigeria
- 15.1.3 South Africa
- 15.1.4 Rest of Middle East and Africa
- 16. Competitive Analysis
- 16.1. Global Market Share Analysis 2024
- 16.2. Company Profiles
- 16.2.1 YANMAR HOLDINGS Co Ltd *List Not Exhaustive 6 4 Market Ranking/Share (%) Analysi
- 16.2.1.1. Overview
- 16.2.1.2. Products
- 16.2.1.3. SWOT Analysis
- 16.2.1.4. Recent Developments
- 16.2.1.5. Financials (Based on Availability)
- 16.2.2 Kohler Co
- 16.2.2.1. Overview
- 16.2.2.2. Products
- 16.2.2.3. SWOT Analysis
- 16.2.2.4. Recent Developments
- 16.2.2.5. Financials (Based on Availability)
- 16.2.3 Hyundai Heavy Industries Co Ltd
- 16.2.3.1. Overview
- 16.2.3.2. Products
- 16.2.3.3. SWOT Analysis
- 16.2.3.4. Recent Developments
- 16.2.3.5. Financials (Based on Availability)
- 16.2.4 Caterpillar Inc
- 16.2.4.1. Overview
- 16.2.4.2. Products
- 16.2.4.3. SWOT Analysis
- 16.2.4.4. Recent Developments
- 16.2.4.5. Financials (Based on Availability)
- 16.2.5 Wartsila Oyj Abp
- 16.2.5.1. Overview
- 16.2.5.2. Products
- 16.2.5.3. SWOT Analysis
- 16.2.5.4. Recent Developments
- 16.2.5.5. Financials (Based on Availability)
- 16.2.6 Cummins Inc
- 16.2.6.1. Overview
- 16.2.6.2. Products
- 16.2.6.3. SWOT Analysis
- 16.2.6.4. Recent Developments
- 16.2.6.5. Financials (Based on Availability)
- 16.2.7 Volvo AB
- 16.2.7.1. Overview
- 16.2.7.2. Products
- 16.2.7.3. SWOT Analysis
- 16.2.7.4. Recent Developments
- 16.2.7.5. Financials (Based on Availability)
- 16.2.8 Man SE
- 16.2.8.1. Overview
- 16.2.8.2. Products
- 16.2.8.3. SWOT Analysis
- 16.2.8.4. Recent Developments
- 16.2.8.5. Financials (Based on Availability)
- 16.2.9 Mitsubishi Heavy Industries Ltd
- 16.2.9.1. Overview
- 16.2.9.2. Products
- 16.2.9.3. SWOT Analysis
- 16.2.9.4. Recent Developments
- 16.2.9.5. Financials (Based on Availability)
- 16.2.10 Rolls-Royce Holding PLC
- 16.2.10.1. Overview
- 16.2.10.2. Products
- 16.2.10.3. SWOT Analysis
- 16.2.10.4. Recent Developments
- 16.2.10.5. Financials (Based on Availability)
- 16.2.1 YANMAR HOLDINGS Co Ltd *List Not Exhaustive 6 4 Market Ranking/Share (%) Analysi
List of Figures
- Figure 1: Global Diesel Power Engine Market Revenue Breakdown (Million, %) by Region 2024 & 2032
- Figure 2: Global Diesel Power Engine Market Volume Breakdown (K Unit, %) by Region 2024 & 2032
- Figure 3: North America Diesel Power Engine Market Revenue (Million), by Country 2024 & 2032
- Figure 4: North America Diesel Power Engine Market Volume (K Unit), by Country 2024 & 2032
- Figure 5: North America Diesel Power Engine Market Revenue Share (%), by Country 2024 & 2032
- Figure 6: North America Diesel Power Engine Market Volume Share (%), by Country 2024 & 2032
- Figure 7: Europe Diesel Power Engine Market Revenue (Million), by Country 2024 & 2032
- Figure 8: Europe Diesel Power Engine Market Volume (K Unit), by Country 2024 & 2032
- Figure 9: Europe Diesel Power Engine Market Revenue Share (%), by Country 2024 & 2032
- Figure 10: Europe Diesel Power Engine Market Volume Share (%), by Country 2024 & 2032
- Figure 11: Asia Pacific Diesel Power Engine Market Revenue (Million), by Country 2024 & 2032
- Figure 12: Asia Pacific Diesel Power Engine Market Volume (K Unit), by Country 2024 & 2032
- Figure 13: Asia Pacific Diesel Power Engine Market Revenue Share (%), by Country 2024 & 2032
- Figure 14: Asia Pacific Diesel Power Engine Market Volume Share (%), by Country 2024 & 2032
- Figure 15: South America Diesel Power Engine Market Revenue (Million), by Country 2024 & 2032
- Figure 16: South America Diesel Power Engine Market Volume (K Unit), by Country 2024 & 2032
- Figure 17: South America Diesel Power Engine Market Revenue Share (%), by Country 2024 & 2032
- Figure 18: South America Diesel Power Engine Market Volume Share (%), by Country 2024 & 2032
- Figure 19: Middle East and Africa Diesel Power Engine Market Revenue (Million), by Country 2024 & 2032
- Figure 20: Middle East and Africa Diesel Power Engine Market Volume (K Unit), by Country 2024 & 2032
- Figure 21: Middle East and Africa Diesel Power Engine Market Revenue Share (%), by Country 2024 & 2032
- Figure 22: Middle East and Africa Diesel Power Engine Market Volume Share (%), by Country 2024 & 2032
- Figure 23: North America Diesel Power Engine Market Revenue (Million), by End User 2024 & 2032
- Figure 24: North America Diesel Power Engine Market Volume (K Unit), by End User 2024 & 2032
- Figure 25: North America Diesel Power Engine Market Revenue Share (%), by End User 2024 & 2032
- Figure 26: North America Diesel Power Engine Market Volume Share (%), by End User 2024 & 2032
- Figure 27: North America Diesel Power Engine Market Revenue (Million), by Application 2024 & 2032
- Figure 28: North America Diesel Power Engine Market Volume (K Unit), by Application 2024 & 2032
- Figure 29: North America Diesel Power Engine Market Revenue Share (%), by Application 2024 & 2032
- Figure 30: North America Diesel Power Engine Market Volume Share (%), by Application 2024 & 2032
- Figure 31: North America Diesel Power Engine Market Revenue (Million), by Country 2024 & 2032
- Figure 32: North America Diesel Power Engine Market Volume (K Unit), by Country 2024 & 2032
- Figure 33: North America Diesel Power Engine Market Revenue Share (%), by Country 2024 & 2032
- Figure 34: North America Diesel Power Engine Market Volume Share (%), by Country 2024 & 2032
- Figure 35: Europe Diesel Power Engine Market Revenue (Million), by End User 2024 & 2032
- Figure 36: Europe Diesel Power Engine Market Volume (K Unit), by End User 2024 & 2032
- Figure 37: Europe Diesel Power Engine Market Revenue Share (%), by End User 2024 & 2032
- Figure 38: Europe Diesel Power Engine Market Volume Share (%), by End User 2024 & 2032
- Figure 39: Europe Diesel Power Engine Market Revenue (Million), by Application 2024 & 2032
- Figure 40: Europe Diesel Power Engine Market Volume (K Unit), by Application 2024 & 2032
- Figure 41: Europe Diesel Power Engine Market Revenue Share (%), by Application 2024 & 2032
- Figure 42: Europe Diesel Power Engine Market Volume Share (%), by Application 2024 & 2032
- Figure 43: Europe Diesel Power Engine Market Revenue (Million), by Country 2024 & 2032
- Figure 44: Europe Diesel Power Engine Market Volume (K Unit), by Country 2024 & 2032
- Figure 45: Europe Diesel Power Engine Market Revenue Share (%), by Country 2024 & 2032
- Figure 46: Europe Diesel Power Engine Market Volume Share (%), by Country 2024 & 2032
- Figure 47: Asia Pacific Diesel Power Engine Market Revenue (Million), by End User 2024 & 2032
- Figure 48: Asia Pacific Diesel Power Engine Market Volume (K Unit), by End User 2024 & 2032
- Figure 49: Asia Pacific Diesel Power Engine Market Revenue Share (%), by End User 2024 & 2032
- Figure 50: Asia Pacific Diesel Power Engine Market Volume Share (%), by End User 2024 & 2032
- Figure 51: Asia Pacific Diesel Power Engine Market Revenue (Million), by Application 2024 & 2032
- Figure 52: Asia Pacific Diesel Power Engine Market Volume (K Unit), by Application 2024 & 2032
- Figure 53: Asia Pacific Diesel Power Engine Market Revenue Share (%), by Application 2024 & 2032
- Figure 54: Asia Pacific Diesel Power Engine Market Volume Share (%), by Application 2024 & 2032
- Figure 55: Asia Pacific Diesel Power Engine Market Revenue (Million), by Country 2024 & 2032
- Figure 56: Asia Pacific Diesel Power Engine Market Volume (K Unit), by Country 2024 & 2032
- Figure 57: Asia Pacific Diesel Power Engine Market Revenue Share (%), by Country 2024 & 2032
- Figure 58: Asia Pacific Diesel Power Engine Market Volume Share (%), by Country 2024 & 2032
- Figure 59: South America Diesel Power Engine Market Revenue (Million), by End User 2024 & 2032
- Figure 60: South America Diesel Power Engine Market Volume (K Unit), by End User 2024 & 2032
- Figure 61: South America Diesel Power Engine Market Revenue Share (%), by End User 2024 & 2032
- Figure 62: South America Diesel Power Engine Market Volume Share (%), by End User 2024 & 2032
- Figure 63: South America Diesel Power Engine Market Revenue (Million), by Application 2024 & 2032
- Figure 64: South America Diesel Power Engine Market Volume (K Unit), by Application 2024 & 2032
- Figure 65: South America Diesel Power Engine Market Revenue Share (%), by Application 2024 & 2032
- Figure 66: South America Diesel Power Engine Market Volume Share (%), by Application 2024 & 2032
- Figure 67: South America Diesel Power Engine Market Revenue (Million), by Country 2024 & 2032
- Figure 68: South America Diesel Power Engine Market Volume (K Unit), by Country 2024 & 2032
- Figure 69: South America Diesel Power Engine Market Revenue Share (%), by Country 2024 & 2032
- Figure 70: South America Diesel Power Engine Market Volume Share (%), by Country 2024 & 2032
- Figure 71: Middle East and Africa Diesel Power Engine Market Revenue (Million), by End User 2024 & 2032
- Figure 72: Middle East and Africa Diesel Power Engine Market Volume (K Unit), by End User 2024 & 2032
- Figure 73: Middle East and Africa Diesel Power Engine Market Revenue Share (%), by End User 2024 & 2032
- Figure 74: Middle East and Africa Diesel Power Engine Market Volume Share (%), by End User 2024 & 2032
- Figure 75: Middle East and Africa Diesel Power Engine Market Revenue (Million), by Application 2024 & 2032
- Figure 76: Middle East and Africa Diesel Power Engine Market Volume (K Unit), by Application 2024 & 2032
- Figure 77: Middle East and Africa Diesel Power Engine Market Revenue Share (%), by Application 2024 & 2032
- Figure 78: Middle East and Africa Diesel Power Engine Market Volume Share (%), by Application 2024 & 2032
- Figure 79: Middle East and Africa Diesel Power Engine Market Revenue (Million), by Country 2024 & 2032
- Figure 80: Middle East and Africa Diesel Power Engine Market Volume (K Unit), by Country 2024 & 2032
- Figure 81: Middle East and Africa Diesel Power Engine Market Revenue Share (%), by Country 2024 & 2032
- Figure 82: Middle East and Africa Diesel Power Engine Market Volume Share (%), by Country 2024 & 2032
List of Tables
- Table 1: Global Diesel Power Engine Market Revenue Million Forecast, by Region 2019 & 2032
- Table 2: Global Diesel Power Engine Market Volume K Unit Forecast, by Region 2019 & 2032
- Table 3: Global Diesel Power Engine Market Revenue Million Forecast, by End User 2019 & 2032
- Table 4: Global Diesel Power Engine Market Volume K Unit Forecast, by End User 2019 & 2032
- Table 5: Global Diesel Power Engine Market Revenue Million Forecast, by Application 2019 & 2032
- Table 6: Global Diesel Power Engine Market Volume K Unit Forecast, by Application 2019 & 2032
- Table 7: Global Diesel Power Engine Market Revenue Million Forecast, by Region 2019 & 2032
- Table 8: Global Diesel Power Engine Market Volume K Unit Forecast, by Region 2019 & 2032
- Table 9: Global Diesel Power Engine Market Revenue Million Forecast, by Country 2019 & 2032
- Table 10: Global Diesel Power Engine Market Volume K Unit Forecast, by Country 2019 & 2032
- Table 11: United States Diesel Power Engine Market Revenue (Million) Forecast, by Application 2019 & 2032
- Table 12: United States Diesel Power Engine Market Volume (K Unit) Forecast, by Application 2019 & 2032
- Table 13: Canada Diesel Power Engine Market Revenue (Million) Forecast, by Application 2019 & 2032
- Table 14: Canada Diesel Power Engine Market Volume (K Unit) Forecast, by Application 2019 & 2032
- Table 15: Rest of North America Diesel Power Engine Market Revenue (Million) Forecast, by Application 2019 & 2032
- Table 16: Rest of North America Diesel Power Engine Market Volume (K Unit) Forecast, by Application 2019 & 2032
- Table 17: Global Diesel Power Engine Market Revenue Million Forecast, by Country 2019 & 2032
- Table 18: Global Diesel Power Engine Market Volume K Unit Forecast, by Country 2019 & 2032
- Table 19: United Kingdom Diesel Power Engine Market Revenue (Million) Forecast, by Application 2019 & 2032
- Table 20: United Kingdom Diesel Power Engine Market Volume (K Unit) Forecast, by Application 2019 & 2032
- Table 21: France Diesel Power Engine Market Revenue (Million) Forecast, by Application 2019 & 2032
- Table 22: France Diesel Power Engine Market Volume (K Unit) Forecast, by Application 2019 & 2032
- Table 23: Germany Diesel Power Engine Market Revenue (Million) Forecast, by Application 2019 & 2032
- Table 24: Germany Diesel Power Engine Market Volume (K Unit) Forecast, by Application 2019 & 2032
- Table 25: Spain Diesel Power Engine Market Revenue (Million) Forecast, by Application 2019 & 2032
- Table 26: Spain Diesel Power Engine Market Volume (K Unit) Forecast, by Application 2019 & 2032
- Table 27: Rest of Europe Diesel Power Engine Market Revenue (Million) Forecast, by Application 2019 & 2032
- Table 28: Rest of Europe Diesel Power Engine Market Volume (K Unit) Forecast, by Application 2019 & 2032
- Table 29: Global Diesel Power Engine Market Revenue Million Forecast, by Country 2019 & 2032
- Table 30: Global Diesel Power Engine Market Volume K Unit Forecast, by Country 2019 & 2032
- Table 31: China Diesel Power Engine Market Revenue (Million) Forecast, by Application 2019 & 2032
- Table 32: China Diesel Power Engine Market Volume (K Unit) Forecast, by Application 2019 & 2032
- Table 33: India Diesel Power Engine Market Revenue (Million) Forecast, by Application 2019 & 2032
- Table 34: India Diesel Power Engine Market Volume (K Unit) Forecast, by Application 2019 & 2032
- Table 35: ASEAN Countries Diesel Power Engine Market Revenue (Million) Forecast, by Application 2019 & 2032
- Table 36: ASEAN Countries Diesel Power Engine Market Volume (K Unit) Forecast, by Application 2019 & 2032
- Table 37: Australia Diesel Power Engine Market Revenue (Million) Forecast, by Application 2019 & 2032
- Table 38: Australia Diesel Power Engine Market Volume (K Unit) Forecast, by Application 2019 & 2032
- Table 39: Rest of Asia Pacific Diesel Power Engine Market Revenue (Million) Forecast, by Application 2019 & 2032
- Table 40: Rest of Asia Pacific Diesel Power Engine Market Volume (K Unit) Forecast, by Application 2019 & 2032
- Table 41: Global Diesel Power Engine Market Revenue Million Forecast, by Country 2019 & 2032
- Table 42: Global Diesel Power Engine Market Volume K Unit Forecast, by Country 2019 & 2032
- Table 43: Brazil Diesel Power Engine Market Revenue (Million) Forecast, by Application 2019 & 2032
- Table 44: Brazil Diesel Power Engine Market Volume (K Unit) Forecast, by Application 2019 & 2032
- Table 45: Argentina Diesel Power Engine Market Revenue (Million) Forecast, by Application 2019 & 2032
- Table 46: Argentina Diesel Power Engine Market Volume (K Unit) Forecast, by Application 2019 & 2032
- Table 47: Rest of South America Diesel Power Engine Market Revenue (Million) Forecast, by Application 2019 & 2032
- Table 48: Rest of South America Diesel Power Engine Market Volume (K Unit) Forecast, by Application 2019 & 2032
- Table 49: Global Diesel Power Engine Market Revenue Million Forecast, by Country 2019 & 2032
- Table 50: Global Diesel Power Engine Market Volume K Unit Forecast, by Country 2019 & 2032
- Table 51: Saudi Arabia Diesel Power Engine Market Revenue (Million) Forecast, by Application 2019 & 2032
- Table 52: Saudi Arabia Diesel Power Engine Market Volume (K Unit) Forecast, by Application 2019 & 2032
- Table 53: Nigeria Diesel Power Engine Market Revenue (Million) Forecast, by Application 2019 & 2032
- Table 54: Nigeria Diesel Power Engine Market Volume (K Unit) Forecast, by Application 2019 & 2032
- Table 55: South Africa Diesel Power Engine Market Revenue (Million) Forecast, by Application 2019 & 2032
- Table 56: South Africa Diesel Power Engine Market Volume (K Unit) Forecast, by Application 2019 & 2032
- Table 57: Rest of Middle East and Africa Diesel Power Engine Market Revenue (Million) Forecast, by Application 2019 & 2032
- Table 58: Rest of Middle East and Africa Diesel Power Engine Market Volume (K Unit) Forecast, by Application 2019 & 2032
- Table 59: Global Diesel Power Engine Market Revenue Million Forecast, by End User 2019 & 2032
- Table 60: Global Diesel Power Engine Market Volume K Unit Forecast, by End User 2019 & 2032
- Table 61: Global Diesel Power Engine Market Revenue Million Forecast, by Application 2019 & 2032
- Table 62: Global Diesel Power Engine Market Volume K Unit Forecast, by Application 2019 & 2032
- Table 63: Global Diesel Power Engine Market Revenue Million Forecast, by Country 2019 & 2032
- Table 64: Global Diesel Power Engine Market Volume K Unit Forecast, by Country 2019 & 2032
- Table 65: United States Diesel Power Engine Market Revenue (Million) Forecast, by Application 2019 & 2032
- Table 66: United States Diesel Power Engine Market Volume (K Unit) Forecast, by Application 2019 & 2032
- Table 67: Canada Diesel Power Engine Market Revenue (Million) Forecast, by Application 2019 & 2032
- Table 68: Canada Diesel Power Engine Market Volume (K Unit) Forecast, by Application 2019 & 2032
- Table 69: Rest of North America Diesel Power Engine Market Revenue (Million) Forecast, by Application 2019 & 2032
- Table 70: Rest of North America Diesel Power Engine Market Volume (K Unit) Forecast, by Application 2019 & 2032
- Table 71: Global Diesel Power Engine Market Revenue Million Forecast, by End User 2019 & 2032
- Table 72: Global Diesel Power Engine Market Volume K Unit Forecast, by End User 2019 & 2032
- Table 73: Global Diesel Power Engine Market Revenue Million Forecast, by Application 2019 & 2032
- Table 74: Global Diesel Power Engine Market Volume K Unit Forecast, by Application 2019 & 2032
- Table 75: Global Diesel Power Engine Market Revenue Million Forecast, by Country 2019 & 2032
- Table 76: Global Diesel Power Engine Market Volume K Unit Forecast, by Country 2019 & 2032
- Table 77: United Kingdom Diesel Power Engine Market Revenue (Million) Forecast, by Application 2019 & 2032
- Table 78: United Kingdom Diesel Power Engine Market Volume (K Unit) Forecast, by Application 2019 & 2032
- Table 79: France Diesel Power Engine Market Revenue (Million) Forecast, by Application 2019 & 2032
- Table 80: France Diesel Power Engine Market Volume (K Unit) Forecast, by Application 2019 & 2032
- Table 81: Germany Diesel Power Engine Market Revenue (Million) Forecast, by Application 2019 & 2032
- Table 82: Germany Diesel Power Engine Market Volume (K Unit) Forecast, by Application 2019 & 2032
- Table 83: Spain Diesel Power Engine Market Revenue (Million) Forecast, by Application 2019 & 2032
- Table 84: Spain Diesel Power Engine Market Volume (K Unit) Forecast, by Application 2019 & 2032
- Table 85: Rest of Europe Diesel Power Engine Market Revenue (Million) Forecast, by Application 2019 & 2032
- Table 86: Rest of Europe Diesel Power Engine Market Volume (K Unit) Forecast, by Application 2019 & 2032
- Table 87: Global Diesel Power Engine Market Revenue Million Forecast, by End User 2019 & 2032
- Table 88: Global Diesel Power Engine Market Volume K Unit Forecast, by End User 2019 & 2032
- Table 89: Global Diesel Power Engine Market Revenue Million Forecast, by Application 2019 & 2032
- Table 90: Global Diesel Power Engine Market Volume K Unit Forecast, by Application 2019 & 2032
- Table 91: Global Diesel Power Engine Market Revenue Million Forecast, by Country 2019 & 2032
- Table 92: Global Diesel Power Engine Market Volume K Unit Forecast, by Country 2019 & 2032
- Table 93: China Diesel Power Engine Market Revenue (Million) Forecast, by Application 2019 & 2032
- Table 94: China Diesel Power Engine Market Volume (K Unit) Forecast, by Application 2019 & 2032
- Table 95: India Diesel Power Engine Market Revenue (Million) Forecast, by Application 2019 & 2032
- Table 96: India Diesel Power Engine Market Volume (K Unit) Forecast, by Application 2019 & 2032
- Table 97: ASEAN Countries Diesel Power Engine Market Revenue (Million) Forecast, by Application 2019 & 2032
- Table 98: ASEAN Countries Diesel Power Engine Market Volume (K Unit) Forecast, by Application 2019 & 2032
- Table 99: Australia Diesel Power Engine Market Revenue (Million) Forecast, by Application 2019 & 2032
- Table 100: Australia Diesel Power Engine Market Volume (K Unit) Forecast, by Application 2019 & 2032
- Table 101: Rest of Asia Pacific Diesel Power Engine Market Revenue (Million) Forecast, by Application 2019 & 2032
- Table 102: Rest of Asia Pacific Diesel Power Engine Market Volume (K Unit) Forecast, by Application 2019 & 2032
- Table 103: Global Diesel Power Engine Market Revenue Million Forecast, by End User 2019 & 2032
- Table 104: Global Diesel Power Engine Market Volume K Unit Forecast, by End User 2019 & 2032
- Table 105: Global Diesel Power Engine Market Revenue Million Forecast, by Application 2019 & 2032
- Table 106: Global Diesel Power Engine Market Volume K Unit Forecast, by Application 2019 & 2032
- Table 107: Global Diesel Power Engine Market Revenue Million Forecast, by Country 2019 & 2032
- Table 108: Global Diesel Power Engine Market Volume K Unit Forecast, by Country 2019 & 2032
- Table 109: Brazil Diesel Power Engine Market Revenue (Million) Forecast, by Application 2019 & 2032
- Table 110: Brazil Diesel Power Engine Market Volume (K Unit) Forecast, by Application 2019 & 2032
- Table 111: Argentina Diesel Power Engine Market Revenue (Million) Forecast, by Application 2019 & 2032
- Table 112: Argentina Diesel Power Engine Market Volume (K Unit) Forecast, by Application 2019 & 2032
- Table 113: Rest of South America Diesel Power Engine Market Revenue (Million) Forecast, by Application 2019 & 2032
- Table 114: Rest of South America Diesel Power Engine Market Volume (K Unit) Forecast, by Application 2019 & 2032
- Table 115: Global Diesel Power Engine Market Revenue Million Forecast, by End User 2019 & 2032
- Table 116: Global Diesel Power Engine Market Volume K Unit Forecast, by End User 2019 & 2032
- Table 117: Global Diesel Power Engine Market Revenue Million Forecast, by Application 2019 & 2032
- Table 118: Global Diesel Power Engine Market Volume K Unit Forecast, by Application 2019 & 2032
- Table 119: Global Diesel Power Engine Market Revenue Million Forecast, by Country 2019 & 2032
- Table 120: Global Diesel Power Engine Market Volume K Unit Forecast, by Country 2019 & 2032
- Table 121: Saudi Arabia Diesel Power Engine Market Revenue (Million) Forecast, by Application 2019 & 2032
- Table 122: Saudi Arabia Diesel Power Engine Market Volume (K Unit) Forecast, by Application 2019 & 2032
- Table 123: Nigeria Diesel Power Engine Market Revenue (Million) Forecast, by Application 2019 & 2032
- Table 124: Nigeria Diesel Power Engine Market Volume (K Unit) Forecast, by Application 2019 & 2032
- Table 125: South Africa Diesel Power Engine Market Revenue (Million) Forecast, by Application 2019 & 2032
- Table 126: South Africa Diesel Power Engine Market Volume (K Unit) Forecast, by Application 2019 & 2032
- Table 127: Rest of Middle East and Africa Diesel Power Engine Market Revenue (Million) Forecast, by Application 2019 & 2032
- Table 128: Rest of Middle East and Africa Diesel Power Engine Market Volume (K Unit) Forecast, by Application 2019 & 2032
Frequently Asked Questions
1. What is the projected Compound Annual Growth Rate (CAGR) of the Diesel Power Engine Market?
The projected CAGR is approximately 6.39%.
2. Which companies are prominent players in the Diesel Power Engine Market?
Key companies in the market include YANMAR HOLDINGS Co Ltd *List Not Exhaustive 6 4 Market Ranking/Share (%) Analysi, Kohler Co, Hyundai Heavy Industries Co Ltd, Caterpillar Inc, Wartsila Oyj Abp, Cummins Inc, Volvo AB, Man SE, Mitsubishi Heavy Industries Ltd, Rolls-Royce Holding PLC.
3. What are the main segments of the Diesel Power Engine Market?
The market segments include End User, Application.
4. Can you provide details about the market size?
The market size is estimated to be USD 11.55 Million as of 2022.
5. What are some drivers contributing to market growth?
4.; Increasing Demand From Industrial Sector4.; Rising Power Outages To Increase The Demand For Diesel Generators.
6. What are the notable trends driving market growth?
The Industrial Segment to Dominate the Market.
7. Are there any restraints impacting market growth?
4.; Increasing Shift Toward Cleaner Energy Resources.
8. Can you provide examples of recent developments in the market?
October 2023: Mitsubishi Heavy Industries Engine & Turbocharger Ltd (MHIET), a part of Mitsubishi Heavy Industries (MHI) Group, approved the use of unblended Hydrotreated Vegetable Oil (HVO) that complies with EN15940 and blends with diesel fuel. Approved engine series include SM, SD, SB, SA, SH, SR, and SU series for all applications, including power systems and marine.
9. What pricing options are available for accessing the report?
Pricing options include single-user, multi-user, and enterprise licenses priced at USD 4750, USD 5250, and USD 8750 respectively.
10. Is the market size provided in terms of value or volume?
The market size is provided in terms of value, measured in Million and volume, measured in K Unit.
11. Are there any specific market keywords associated with the report?
Yes, the market keyword associated with the report is "Diesel Power Engine Market," which aids in identifying and referencing the specific market segment covered.
12. How do I determine which pricing option suits my needs best?
The pricing options vary based on user requirements and access needs. Individual users may opt for single-user licenses, while businesses requiring broader access may choose multi-user or enterprise licenses for cost-effective access to the report.
13. Are there any additional resources or data provided in the Diesel Power Engine Market report?
While the report offers comprehensive insights, it's advisable to review the specific contents or supplementary materials provided to ascertain if additional resources or data are available.
14. How can I stay updated on further developments or reports in the Diesel Power Engine Market?
To stay informed about further developments, trends, and reports in the Diesel Power Engine Market, consider subscribing to industry newsletters, following relevant companies and organizations, or regularly checking reputable industry news sources and publications.
Methodology
Step 1 - Identification of Relevant Samples Size from Population Database


Step 2 - Approaches for Defining Global Market Size (Value, Volume* & Price*)

Note*: In applicable scenarios
Step 3 - Data Sources
Primary Research
- Web Analytics
- Survey Reports
- Research Institute
- Latest Research Reports
- Opinion Leaders
Secondary Research
- Annual Reports
- White Paper
- Latest Press Release
- Industry Association
- Paid Database
- Investor Presentations

Step 4 - Data Triangulation
Involves using different sources of information in order to increase the validity of a study
These sources are likely to be stakeholders in a program - participants, other researchers, program staff, other community members, and so on.
Then we put all data in single framework & apply various statistical tools to find out the dynamic on the market.
During the analysis stage, feedback from the stakeholder groups would be compared to determine areas of agreement as well as areas of divergence
