

Key Insights
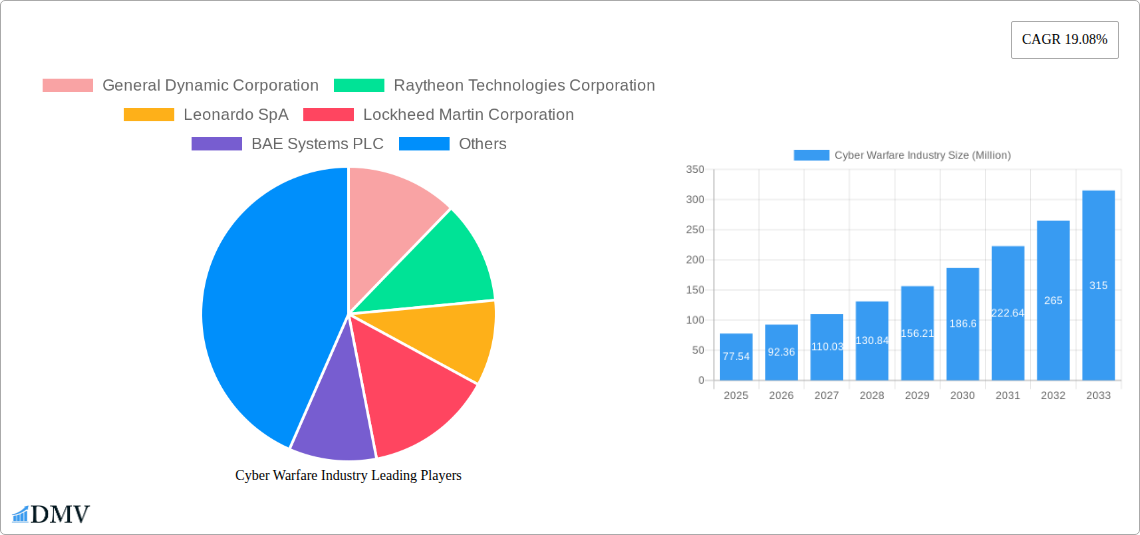
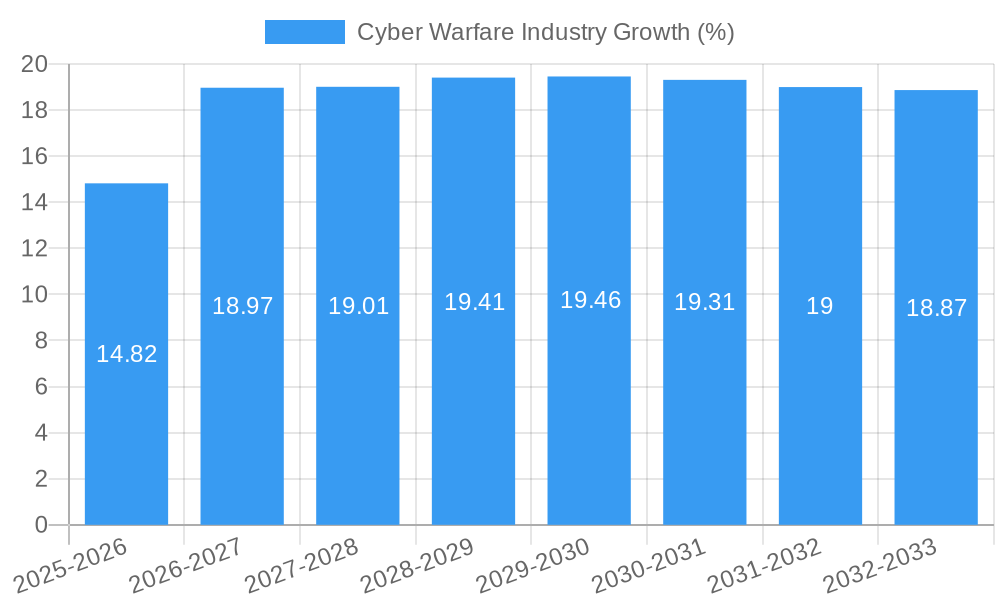
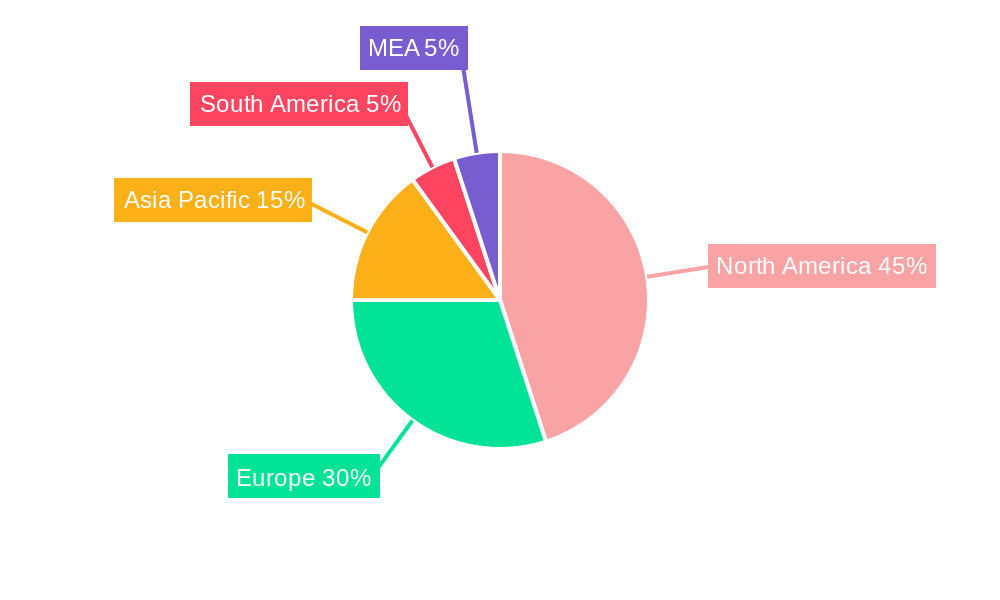
The global cyber warfare market, valued at $77.54 million in 2025, is projected to experience robust growth, driven by escalating geopolitical tensions, increasing sophistication of cyberattacks, and the expanding digital landscape across various sectors. A Compound Annual Growth Rate (CAGR) of 19.08% from 2025 to 2033 indicates a significant market expansion, reaching an estimated $387 million by 2033. Key drivers include the rising adoption of advanced persistent threats (APTs) and nation-state sponsored cyberattacks demanding advanced defense mechanisms. The increasing interconnectedness of critical infrastructure, including power grids and financial institutions, further fuels market growth as these sectors prioritize robust cybersecurity measures to mitigate potential disruptions and data breaches. Significant investments in cybersecurity research and development, coupled with government initiatives promoting cybersecurity awareness and training, also contribute to the market's upward trajectory. Growth is segmented across various end-user industries, with defense, aerospace, and BFSI sectors leading the demand for advanced cyber warfare solutions. North America, particularly the United States, is anticipated to maintain a dominant market share due to advanced technological capabilities and high government spending on defense and cybersecurity.
However, market growth might face certain restraints. These include the high cost of implementing and maintaining sophisticated cybersecurity systems, the shortage of skilled cybersecurity professionals, and the constant evolution of cyber threats, requiring continuous upgrades and adaptation. Nevertheless, the increasing frequency and severity of cyberattacks, coupled with the growing awareness of their potential consequences, will continue to drive investment in advanced cyber warfare technologies, ensuring strong market expansion in the forecast period. The competitive landscape is characterized by a mix of established defense contractors and specialized cybersecurity firms, each vying for market share through continuous innovation and strategic partnerships. Geographical expansion into emerging markets in Asia-Pacific and MEA regions is also expected to contribute significantly to overall market growth.
Cyber Warfare Industry Market Report: 2019-2033
This comprehensive report provides an in-depth analysis of the global Cyber Warfare Industry, offering invaluable insights for stakeholders seeking to understand market dynamics, future trends, and key players. With a study period spanning 2019-2033, a base year of 2025, and a forecast period from 2025-2033, this report delivers crucial data for informed decision-making. The market is projected to reach xx Million by 2033, showcasing significant growth potential.
Cyber Warfare Industry Market Composition & Trends
The Cyber Warfare Industry is characterized by a moderately concentrated market, with key players like General Dynamics Corporation, Raytheon Technologies Corporation, Leonardo SpA, Lockheed Martin Corporation, BAE Systems PLC, and Airbus SE holding significant market share. Innovation is driven by the constant evolution of cyber threats and the need for advanced defense mechanisms. Stringent government regulations and evolving data privacy laws shape the competitive landscape. Substitute products, while limited, include alternative security solutions, but the specialized nature of cyber warfare technology creates high barriers to entry. The industry sees considerable M&A activity, with deal values exceeding xx Million in recent years. End-users range across diverse sectors including defense, aerospace, BFSI, corporate entities, power & utilities, and government agencies.
- Market Share Distribution (2024): General Dynamics: xx%; Raytheon: xx%; Leonardo: xx%; Lockheed Martin: xx%; BAE Systems: xx%; Others: xx%.
- M&A Deal Value (2019-2024): Estimated at xx Million.
- Key Innovation Catalysts: AI-powered threat detection, quantum computing applications, advanced encryption techniques.
- Regulatory Landscape: Focus on data security, compliance standards, and international regulations.
Cyber Warfare Industry Industry Evolution
The Cyber Warfare Industry has witnessed remarkable growth over the past five years, fueled by rising cyber threats and escalating geopolitical tensions. Technological advancements, particularly in artificial intelligence (AI), machine learning (ML), and blockchain, have revolutionized defensive capabilities. The demand for sophisticated cybersecurity solutions continues to surge, driven by increasing digitization across all sectors. Growth rates have averaged xx% annually during the historical period (2019-2024), and this momentum is expected to continue, with a projected CAGR of xx% from 2025 to 2033. Adoption of advanced threat detection and response systems is rapidly increasing. Consumer demand is shifting towards proactive, real-time security solutions, requiring vendors to adapt to this evolving need. The increasing interconnectedness of systems and the rise of cloud computing have expanded the attack surface, further driving industry growth. This has led to a significant increase in investments in the cybersecurity sector, indicating a positive outlook for the industry's future.
Leading Regions, Countries, or Segments in Cyber Warfare Industry
The North American region dominates the Cyber Warfare Industry, driven by robust government investments, a thriving technology sector, and strong defense budgets. The Government segment is the largest end-user, reflecting the critical need for national security and infrastructure protection.
Key Drivers in North America:
- High defense spending.
- Advanced technological capabilities.
- Stringent cybersecurity regulations.
- Strong presence of major industry players.
Other Significant Regions: Europe and Asia-Pacific regions showcase strong growth potential due to rising cybersecurity awareness and increasing digitization.
Dominance Factors:
- High government spending on defense and cybersecurity.
- Presence of major technology companies and R&D hubs.
- Advanced technological infrastructure.
- Stringent data protection and privacy regulations.
Cyber Warfare Industry Product Innovations
Recent innovations include AI-driven threat intelligence platforms, advanced endpoint detection and response (EDR) solutions, and quantum-resistant cryptographic algorithms. These innovations offer enhanced threat detection, faster response times, and improved data security. Unique selling propositions include real-time threat analysis, automated incident response, and seamless integration with existing security infrastructures. The focus is shifting towards proactive security measures and predictive analytics.
Propelling Factors for Cyber Warfare Industry Growth
The industry is propelled by several factors. Firstly, the escalating frequency and sophistication of cyberattacks necessitate robust defense mechanisms. Secondly, the increasing adoption of cloud computing and IoT devices expands the attack surface, driving demand for comprehensive security solutions. Thirdly, government regulations and mandates, such as those related to data privacy and critical infrastructure protection, are compelling organizations to invest in advanced cybersecurity measures. Finally, continuous technological advancements, such as AI and ML, provide innovative solutions for combating evolving cyber threats.
Obstacles in the Cyber Warfare Industry Market
Challenges include the high cost of implementing advanced security solutions, the shortage of skilled cybersecurity professionals, and the complexity of integrating various security technologies. Supply chain vulnerabilities present a significant risk, impacting the availability and reliability of critical components. Intense competition and the rapid evolution of cyber threats also pose significant challenges for vendors. These factors can collectively restrain market growth.
Future Opportunities in Cyber Warfare Industry
Emerging opportunities lie in the development of quantum-resistant cryptography, the expansion into new markets such as the Internet of Things (IoT), and the growing demand for managed security services. The integration of AI and ML into security solutions promises to improve threat detection and response capabilities. Focus on proactive threat hunting and predictive analytics will continue to drive innovation.
Major Players in the Cyber Warfare Industry Ecosystem
- General Dynamics Corporation
- Raytheon Technologies Corporation
- Leonardo SpA
- Lockheed Martin Corporation
- BAE Systems PLC
- Airbus SE
- DXC Technology Company
- Booz Allen Hamilton Inc
- The Boeing Company
- Mandiant Inc (fireeye Inc)
Key Developments in Cyber Warfare Industry Industry
- August 2023: The Department of Homeland Security announced USD 374.9 Million in grant funding for the State and Local Cybersecurity Grant Program (SLCGP), significantly increasing funding from the previous year's USD 185 Million. This boosts state and local cyber resilience efforts, driving demand for security solutions.
- April 2023: Cyber security startup Safe Security secured USD 50 Million in Series B funding, highlighting investor confidence in the market and the demand for innovative cyber risk management platforms.
Strategic Cyber Warfare Industry Market Forecast
The Cyber Warfare Industry is poised for continued growth, driven by the persistent threat of cyberattacks, increasing digitalization, and the ongoing development of advanced security technologies. The market is expected to experience substantial growth over the forecast period, driven primarily by the expansion of cloud-based solutions, the growing adoption of IoT devices, and the demand for proactive and predictive security technologies. The focus on strengthening national cybersecurity infrastructure and compliance with international regulations will significantly propel market growth.
Cyber Warfare Industry Segmentation
-
1. End-user Industry
- 1.1. Defense
- 1.2. Aerospace
- 1.3. BFSI
- 1.4. Corporate
- 1.5. Power and Utilities
- 1.6. Government
- 1.7. Other End-user Industries
Cyber Warfare Industry Segmentation By Geography
- 1. North America
- 2. Europe
- 3. Asia
- 4. Australia and New Zealand
- 5. Latin America
- 6. Middle East and Africa
Cyber Warfare Industry REPORT HIGHLIGHTS
| Aspects | Details |
|---|---|
| Study Period | 2019-2033 |
| Base Year | 2024 |
| Estimated Year | 2025 |
| Forecast Period | 2025-2033 |
| Historical Period | 2019-2024 |
| Growth Rate | CAGR of 19.08% from 2019-2033 |
| Segmentation |
|
Table of Contents
- 1. Introduction
- 1.1. Research Scope
- 1.2. Market Segmentation
- 1.3. Research Methodology
- 1.4. Definitions and Assumptions
- 2. Executive Summary
- 2.1. Introduction
- 3. Market Dynamics
- 3.1. Introduction
- 3.2. Market Drivers
- 3.2.1. Increasing Concerns Regarding National Security; Increase in Defense Spending
- 3.3. Market Restrains
- 3.3.1. Poor Understanding of Industrial Control Systems; Lack of Interoperability Between Products
- 3.4. Market Trends
- 3.4.1. Defense Sector to be the Largest End User
- 4. Market Factor Analysis
- 4.1. Porters Five Forces
- 4.2. Supply/Value Chain
- 4.3. PESTEL analysis
- 4.4. Market Entropy
- 4.5. Patent/Trademark Analysis
- 5. Global Cyber Warfare Industry Analysis, Insights and Forecast, 2019-2031
- 5.1. Market Analysis, Insights and Forecast - by End-user Industry
- 5.1.1. Defense
- 5.1.2. Aerospace
- 5.1.3. BFSI
- 5.1.4. Corporate
- 5.1.5. Power and Utilities
- 5.1.6. Government
- 5.1.7. Other End-user Industries
- 5.2. Market Analysis, Insights and Forecast - by Region
- 5.2.1. North America
- 5.2.2. Europe
- 5.2.3. Asia
- 5.2.4. Australia and New Zealand
- 5.2.5. Latin America
- 5.2.6. Middle East and Africa
- 5.1. Market Analysis, Insights and Forecast - by End-user Industry
- 6. North America Cyber Warfare Industry Analysis, Insights and Forecast, 2019-2031
- 6.1. Market Analysis, Insights and Forecast - by End-user Industry
- 6.1.1. Defense
- 6.1.2. Aerospace
- 6.1.3. BFSI
- 6.1.4. Corporate
- 6.1.5. Power and Utilities
- 6.1.6. Government
- 6.1.7. Other End-user Industries
- 6.1. Market Analysis, Insights and Forecast - by End-user Industry
- 7. Europe Cyber Warfare Industry Analysis, Insights and Forecast, 2019-2031
- 7.1. Market Analysis, Insights and Forecast - by End-user Industry
- 7.1.1. Defense
- 7.1.2. Aerospace
- 7.1.3. BFSI
- 7.1.4. Corporate
- 7.1.5. Power and Utilities
- 7.1.6. Government
- 7.1.7. Other End-user Industries
- 7.1. Market Analysis, Insights and Forecast - by End-user Industry
- 8. Asia Cyber Warfare Industry Analysis, Insights and Forecast, 2019-2031
- 8.1. Market Analysis, Insights and Forecast - by End-user Industry
- 8.1.1. Defense
- 8.1.2. Aerospace
- 8.1.3. BFSI
- 8.1.4. Corporate
- 8.1.5. Power and Utilities
- 8.1.6. Government
- 8.1.7. Other End-user Industries
- 8.1. Market Analysis, Insights and Forecast - by End-user Industry
- 9. Australia and New Zealand Cyber Warfare Industry Analysis, Insights and Forecast, 2019-2031
- 9.1. Market Analysis, Insights and Forecast - by End-user Industry
- 9.1.1. Defense
- 9.1.2. Aerospace
- 9.1.3. BFSI
- 9.1.4. Corporate
- 9.1.5. Power and Utilities
- 9.1.6. Government
- 9.1.7. Other End-user Industries
- 9.1. Market Analysis, Insights and Forecast - by End-user Industry
- 10. Latin America Cyber Warfare Industry Analysis, Insights and Forecast, 2019-2031
- 10.1. Market Analysis, Insights and Forecast - by End-user Industry
- 10.1.1. Defense
- 10.1.2. Aerospace
- 10.1.3. BFSI
- 10.1.4. Corporate
- 10.1.5. Power and Utilities
- 10.1.6. Government
- 10.1.7. Other End-user Industries
- 10.1. Market Analysis, Insights and Forecast - by End-user Industry
- 11. Middle East and Africa Cyber Warfare Industry Analysis, Insights and Forecast, 2019-2031
- 11.1. Market Analysis, Insights and Forecast - by End-user Industry
- 11.1.1. Defense
- 11.1.2. Aerospace
- 11.1.3. BFSI
- 11.1.4. Corporate
- 11.1.5. Power and Utilities
- 11.1.6. Government
- 11.1.7. Other End-user Industries
- 11.1. Market Analysis, Insights and Forecast - by End-user Industry
- 12. North America Cyber Warfare Industry Analysis, Insights and Forecast, 2019-2031
- 12.1. Market Analysis, Insights and Forecast - By Country/Sub-region
- 12.1.1 United States
- 12.1.2 Canada
- 12.1.3 Mexico
- 13. Europe Cyber Warfare Industry Analysis, Insights and Forecast, 2019-2031
- 13.1. Market Analysis, Insights and Forecast - By Country/Sub-region
- 13.1.1 Germany
- 13.1.2 United Kingdom
- 13.1.3 France
- 13.1.4 Spain
- 13.1.5 Italy
- 13.1.6 Spain
- 13.1.7 Belgium
- 13.1.8 Netherland
- 13.1.9 Nordics
- 13.1.10 Rest of Europe
- 14. Asia Pacific Cyber Warfare Industry Analysis, Insights and Forecast, 2019-2031
- 14.1. Market Analysis, Insights and Forecast - By Country/Sub-region
- 14.1.1 China
- 14.1.2 Japan
- 14.1.3 India
- 14.1.4 South Korea
- 14.1.5 Southeast Asia
- 14.1.6 Australia
- 14.1.7 Indonesia
- 14.1.8 Phillipes
- 14.1.9 Singapore
- 14.1.10 Thailandc
- 14.1.11 Rest of Asia Pacific
- 15. South America Cyber Warfare Industry Analysis, Insights and Forecast, 2019-2031
- 15.1. Market Analysis, Insights and Forecast - By Country/Sub-region
- 15.1.1 Brazil
- 15.1.2 Argentina
- 15.1.3 Peru
- 15.1.4 Chile
- 15.1.5 Colombia
- 15.1.6 Ecuador
- 15.1.7 Venezuela
- 15.1.8 Rest of South America
- 16. North America Cyber Warfare Industry Analysis, Insights and Forecast, 2019-2031
- 16.1. Market Analysis, Insights and Forecast - By Country/Sub-region
- 16.1.1 United States
- 16.1.2 Canada
- 16.1.3 Mexico
- 17. MEA Cyber Warfare Industry Analysis, Insights and Forecast, 2019-2031
- 17.1. Market Analysis, Insights and Forecast - By Country/Sub-region
- 17.1.1 United Arab Emirates
- 17.1.2 Saudi Arabia
- 17.1.3 South Africa
- 17.1.4 Rest of Middle East and Africa
- 18. Competitive Analysis
- 18.1. Global Market Share Analysis 2024
- 18.2. Company Profiles
- 18.2.1 General Dynamic Corporation
- 18.2.1.1. Overview
- 18.2.1.2. Products
- 18.2.1.3. SWOT Analysis
- 18.2.1.4. Recent Developments
- 18.2.1.5. Financials (Based on Availability)
- 18.2.2 Raytheon Technologies Corporation
- 18.2.2.1. Overview
- 18.2.2.2. Products
- 18.2.2.3. SWOT Analysis
- 18.2.2.4. Recent Developments
- 18.2.2.5. Financials (Based on Availability)
- 18.2.3 Leonardo SpA
- 18.2.3.1. Overview
- 18.2.3.2. Products
- 18.2.3.3. SWOT Analysis
- 18.2.3.4. Recent Developments
- 18.2.3.5. Financials (Based on Availability)
- 18.2.4 Lockheed Martin Corporation
- 18.2.4.1. Overview
- 18.2.4.2. Products
- 18.2.4.3. SWOT Analysis
- 18.2.4.4. Recent Developments
- 18.2.4.5. Financials (Based on Availability)
- 18.2.5 BAE Systems PLC
- 18.2.5.1. Overview
- 18.2.5.2. Products
- 18.2.5.3. SWOT Analysis
- 18.2.5.4. Recent Developments
- 18.2.5.5. Financials (Based on Availability)
- 18.2.6 Airbus S
- 18.2.6.1. Overview
- 18.2.6.2. Products
- 18.2.6.3. SWOT Analysis
- 18.2.6.4. Recent Developments
- 18.2.6.5. Financials (Based on Availability)
- 18.2.7 DXC Technology Company
- 18.2.7.1. Overview
- 18.2.7.2. Products
- 18.2.7.3. SWOT Analysis
- 18.2.7.4. Recent Developments
- 18.2.7.5. Financials (Based on Availability)
- 18.2.8 Booz Allen Hamilton Inc
- 18.2.8.1. Overview
- 18.2.8.2. Products
- 18.2.8.3. SWOT Analysis
- 18.2.8.4. Recent Developments
- 18.2.8.5. Financials (Based on Availability)
- 18.2.9 The Boeing Company
- 18.2.9.1. Overview
- 18.2.9.2. Products
- 18.2.9.3. SWOT Analysis
- 18.2.9.4. Recent Developments
- 18.2.9.5. Financials (Based on Availability)
- 18.2.10 Mandiant Inc (fireeye Inc )
- 18.2.10.1. Overview
- 18.2.10.2. Products
- 18.2.10.3. SWOT Analysis
- 18.2.10.4. Recent Developments
- 18.2.10.5. Financials (Based on Availability)
- 18.2.1 General Dynamic Corporation
List of Figures
- Figure 1: Global Cyber Warfare Industry Revenue Breakdown (Million, %) by Region 2024 & 2032
- Figure 2: Global Cyber Warfare Industry Volume Breakdown (K Unit, %) by Region 2024 & 2032
- Figure 3: North America Cyber Warfare Industry Revenue (Million), by Country 2024 & 2032
- Figure 4: North America Cyber Warfare Industry Volume (K Unit), by Country 2024 & 2032
- Figure 5: North America Cyber Warfare Industry Revenue Share (%), by Country 2024 & 2032
- Figure 6: North America Cyber Warfare Industry Volume Share (%), by Country 2024 & 2032
- Figure 7: Europe Cyber Warfare Industry Revenue (Million), by Country 2024 & 2032
- Figure 8: Europe Cyber Warfare Industry Volume (K Unit), by Country 2024 & 2032
- Figure 9: Europe Cyber Warfare Industry Revenue Share (%), by Country 2024 & 2032
- Figure 10: Europe Cyber Warfare Industry Volume Share (%), by Country 2024 & 2032
- Figure 11: Asia Pacific Cyber Warfare Industry Revenue (Million), by Country 2024 & 2032
- Figure 12: Asia Pacific Cyber Warfare Industry Volume (K Unit), by Country 2024 & 2032
- Figure 13: Asia Pacific Cyber Warfare Industry Revenue Share (%), by Country 2024 & 2032
- Figure 14: Asia Pacific Cyber Warfare Industry Volume Share (%), by Country 2024 & 2032
- Figure 15: South America Cyber Warfare Industry Revenue (Million), by Country 2024 & 2032
- Figure 16: South America Cyber Warfare Industry Volume (K Unit), by Country 2024 & 2032
- Figure 17: South America Cyber Warfare Industry Revenue Share (%), by Country 2024 & 2032
- Figure 18: South America Cyber Warfare Industry Volume Share (%), by Country 2024 & 2032
- Figure 19: North America Cyber Warfare Industry Revenue (Million), by Country 2024 & 2032
- Figure 20: North America Cyber Warfare Industry Volume (K Unit), by Country 2024 & 2032
- Figure 21: North America Cyber Warfare Industry Revenue Share (%), by Country 2024 & 2032
- Figure 22: North America Cyber Warfare Industry Volume Share (%), by Country 2024 & 2032
- Figure 23: MEA Cyber Warfare Industry Revenue (Million), by Country 2024 & 2032
- Figure 24: MEA Cyber Warfare Industry Volume (K Unit), by Country 2024 & 2032
- Figure 25: MEA Cyber Warfare Industry Revenue Share (%), by Country 2024 & 2032
- Figure 26: MEA Cyber Warfare Industry Volume Share (%), by Country 2024 & 2032
- Figure 27: North America Cyber Warfare Industry Revenue (Million), by End-user Industry 2024 & 2032
- Figure 28: North America Cyber Warfare Industry Volume (K Unit), by End-user Industry 2024 & 2032
- Figure 29: North America Cyber Warfare Industry Revenue Share (%), by End-user Industry 2024 & 2032
- Figure 30: North America Cyber Warfare Industry Volume Share (%), by End-user Industry 2024 & 2032
- Figure 31: North America Cyber Warfare Industry Revenue (Million), by Country 2024 & 2032
- Figure 32: North America Cyber Warfare Industry Volume (K Unit), by Country 2024 & 2032
- Figure 33: North America Cyber Warfare Industry Revenue Share (%), by Country 2024 & 2032
- Figure 34: North America Cyber Warfare Industry Volume Share (%), by Country 2024 & 2032
- Figure 35: Europe Cyber Warfare Industry Revenue (Million), by End-user Industry 2024 & 2032
- Figure 36: Europe Cyber Warfare Industry Volume (K Unit), by End-user Industry 2024 & 2032
- Figure 37: Europe Cyber Warfare Industry Revenue Share (%), by End-user Industry 2024 & 2032
- Figure 38: Europe Cyber Warfare Industry Volume Share (%), by End-user Industry 2024 & 2032
- Figure 39: Europe Cyber Warfare Industry Revenue (Million), by Country 2024 & 2032
- Figure 40: Europe Cyber Warfare Industry Volume (K Unit), by Country 2024 & 2032
- Figure 41: Europe Cyber Warfare Industry Revenue Share (%), by Country 2024 & 2032
- Figure 42: Europe Cyber Warfare Industry Volume Share (%), by Country 2024 & 2032
- Figure 43: Asia Cyber Warfare Industry Revenue (Million), by End-user Industry 2024 & 2032
- Figure 44: Asia Cyber Warfare Industry Volume (K Unit), by End-user Industry 2024 & 2032
- Figure 45: Asia Cyber Warfare Industry Revenue Share (%), by End-user Industry 2024 & 2032
- Figure 46: Asia Cyber Warfare Industry Volume Share (%), by End-user Industry 2024 & 2032
- Figure 47: Asia Cyber Warfare Industry Revenue (Million), by Country 2024 & 2032
- Figure 48: Asia Cyber Warfare Industry Volume (K Unit), by Country 2024 & 2032
- Figure 49: Asia Cyber Warfare Industry Revenue Share (%), by Country 2024 & 2032
- Figure 50: Asia Cyber Warfare Industry Volume Share (%), by Country 2024 & 2032
- Figure 51: Australia and New Zealand Cyber Warfare Industry Revenue (Million), by End-user Industry 2024 & 2032
- Figure 52: Australia and New Zealand Cyber Warfare Industry Volume (K Unit), by End-user Industry 2024 & 2032
- Figure 53: Australia and New Zealand Cyber Warfare Industry Revenue Share (%), by End-user Industry 2024 & 2032
- Figure 54: Australia and New Zealand Cyber Warfare Industry Volume Share (%), by End-user Industry 2024 & 2032
- Figure 55: Australia and New Zealand Cyber Warfare Industry Revenue (Million), by Country 2024 & 2032
- Figure 56: Australia and New Zealand Cyber Warfare Industry Volume (K Unit), by Country 2024 & 2032
- Figure 57: Australia and New Zealand Cyber Warfare Industry Revenue Share (%), by Country 2024 & 2032
- Figure 58: Australia and New Zealand Cyber Warfare Industry Volume Share (%), by Country 2024 & 2032
- Figure 59: Latin America Cyber Warfare Industry Revenue (Million), by End-user Industry 2024 & 2032
- Figure 60: Latin America Cyber Warfare Industry Volume (K Unit), by End-user Industry 2024 & 2032
- Figure 61: Latin America Cyber Warfare Industry Revenue Share (%), by End-user Industry 2024 & 2032
- Figure 62: Latin America Cyber Warfare Industry Volume Share (%), by End-user Industry 2024 & 2032
- Figure 63: Latin America Cyber Warfare Industry Revenue (Million), by Country 2024 & 2032
- Figure 64: Latin America Cyber Warfare Industry Volume (K Unit), by Country 2024 & 2032
- Figure 65: Latin America Cyber Warfare Industry Revenue Share (%), by Country 2024 & 2032
- Figure 66: Latin America Cyber Warfare Industry Volume Share (%), by Country 2024 & 2032
- Figure 67: Middle East and Africa Cyber Warfare Industry Revenue (Million), by End-user Industry 2024 & 2032
- Figure 68: Middle East and Africa Cyber Warfare Industry Volume (K Unit), by End-user Industry 2024 & 2032
- Figure 69: Middle East and Africa Cyber Warfare Industry Revenue Share (%), by End-user Industry 2024 & 2032
- Figure 70: Middle East and Africa Cyber Warfare Industry Volume Share (%), by End-user Industry 2024 & 2032
- Figure 71: Middle East and Africa Cyber Warfare Industry Revenue (Million), by Country 2024 & 2032
- Figure 72: Middle East and Africa Cyber Warfare Industry Volume (K Unit), by Country 2024 & 2032
- Figure 73: Middle East and Africa Cyber Warfare Industry Revenue Share (%), by Country 2024 & 2032
- Figure 74: Middle East and Africa Cyber Warfare Industry Volume Share (%), by Country 2024 & 2032
List of Tables
- Table 1: Global Cyber Warfare Industry Revenue Million Forecast, by Region 2019 & 2032
- Table 2: Global Cyber Warfare Industry Volume K Unit Forecast, by Region 2019 & 2032
- Table 3: Global Cyber Warfare Industry Revenue Million Forecast, by End-user Industry 2019 & 2032
- Table 4: Global Cyber Warfare Industry Volume K Unit Forecast, by End-user Industry 2019 & 2032
- Table 5: Global Cyber Warfare Industry Revenue Million Forecast, by Region 2019 & 2032
- Table 6: Global Cyber Warfare Industry Volume K Unit Forecast, by Region 2019 & 2032
- Table 7: Global Cyber Warfare Industry Revenue Million Forecast, by Country 2019 & 2032
- Table 8: Global Cyber Warfare Industry Volume K Unit Forecast, by Country 2019 & 2032
- Table 9: United States Cyber Warfare Industry Revenue (Million) Forecast, by Application 2019 & 2032
- Table 10: United States Cyber Warfare Industry Volume (K Unit) Forecast, by Application 2019 & 2032
- Table 11: Canada Cyber Warfare Industry Revenue (Million) Forecast, by Application 2019 & 2032
- Table 12: Canada Cyber Warfare Industry Volume (K Unit) Forecast, by Application 2019 & 2032
- Table 13: Mexico Cyber Warfare Industry Revenue (Million) Forecast, by Application 2019 & 2032
- Table 14: Mexico Cyber Warfare Industry Volume (K Unit) Forecast, by Application 2019 & 2032
- Table 15: Global Cyber Warfare Industry Revenue Million Forecast, by Country 2019 & 2032
- Table 16: Global Cyber Warfare Industry Volume K Unit Forecast, by Country 2019 & 2032
- Table 17: Germany Cyber Warfare Industry Revenue (Million) Forecast, by Application 2019 & 2032
- Table 18: Germany Cyber Warfare Industry Volume (K Unit) Forecast, by Application 2019 & 2032
- Table 19: United Kingdom Cyber Warfare Industry Revenue (Million) Forecast, by Application 2019 & 2032
- Table 20: United Kingdom Cyber Warfare Industry Volume (K Unit) Forecast, by Application 2019 & 2032
- Table 21: France Cyber Warfare Industry Revenue (Million) Forecast, by Application 2019 & 2032
- Table 22: France Cyber Warfare Industry Volume (K Unit) Forecast, by Application 2019 & 2032
- Table 23: Spain Cyber Warfare Industry Revenue (Million) Forecast, by Application 2019 & 2032
- Table 24: Spain Cyber Warfare Industry Volume (K Unit) Forecast, by Application 2019 & 2032
- Table 25: Italy Cyber Warfare Industry Revenue (Million) Forecast, by Application 2019 & 2032
- Table 26: Italy Cyber Warfare Industry Volume (K Unit) Forecast, by Application 2019 & 2032
- Table 27: Spain Cyber Warfare Industry Revenue (Million) Forecast, by Application 2019 & 2032
- Table 28: Spain Cyber Warfare Industry Volume (K Unit) Forecast, by Application 2019 & 2032
- Table 29: Belgium Cyber Warfare Industry Revenue (Million) Forecast, by Application 2019 & 2032
- Table 30: Belgium Cyber Warfare Industry Volume (K Unit) Forecast, by Application 2019 & 2032
- Table 31: Netherland Cyber Warfare Industry Revenue (Million) Forecast, by Application 2019 & 2032
- Table 32: Netherland Cyber Warfare Industry Volume (K Unit) Forecast, by Application 2019 & 2032
- Table 33: Nordics Cyber Warfare Industry Revenue (Million) Forecast, by Application 2019 & 2032
- Table 34: Nordics Cyber Warfare Industry Volume (K Unit) Forecast, by Application 2019 & 2032
- Table 35: Rest of Europe Cyber Warfare Industry Revenue (Million) Forecast, by Application 2019 & 2032
- Table 36: Rest of Europe Cyber Warfare Industry Volume (K Unit) Forecast, by Application 2019 & 2032
- Table 37: Global Cyber Warfare Industry Revenue Million Forecast, by Country 2019 & 2032
- Table 38: Global Cyber Warfare Industry Volume K Unit Forecast, by Country 2019 & 2032
- Table 39: China Cyber Warfare Industry Revenue (Million) Forecast, by Application 2019 & 2032
- Table 40: China Cyber Warfare Industry Volume (K Unit) Forecast, by Application 2019 & 2032
- Table 41: Japan Cyber Warfare Industry Revenue (Million) Forecast, by Application 2019 & 2032
- Table 42: Japan Cyber Warfare Industry Volume (K Unit) Forecast, by Application 2019 & 2032
- Table 43: India Cyber Warfare Industry Revenue (Million) Forecast, by Application 2019 & 2032
- Table 44: India Cyber Warfare Industry Volume (K Unit) Forecast, by Application 2019 & 2032
- Table 45: South Korea Cyber Warfare Industry Revenue (Million) Forecast, by Application 2019 & 2032
- Table 46: South Korea Cyber Warfare Industry Volume (K Unit) Forecast, by Application 2019 & 2032
- Table 47: Southeast Asia Cyber Warfare Industry Revenue (Million) Forecast, by Application 2019 & 2032
- Table 48: Southeast Asia Cyber Warfare Industry Volume (K Unit) Forecast, by Application 2019 & 2032
- Table 49: Australia Cyber Warfare Industry Revenue (Million) Forecast, by Application 2019 & 2032
- Table 50: Australia Cyber Warfare Industry Volume (K Unit) Forecast, by Application 2019 & 2032
- Table 51: Indonesia Cyber Warfare Industry Revenue (Million) Forecast, by Application 2019 & 2032
- Table 52: Indonesia Cyber Warfare Industry Volume (K Unit) Forecast, by Application 2019 & 2032
- Table 53: Phillipes Cyber Warfare Industry Revenue (Million) Forecast, by Application 2019 & 2032
- Table 54: Phillipes Cyber Warfare Industry Volume (K Unit) Forecast, by Application 2019 & 2032
- Table 55: Singapore Cyber Warfare Industry Revenue (Million) Forecast, by Application 2019 & 2032
- Table 56: Singapore Cyber Warfare Industry Volume (K Unit) Forecast, by Application 2019 & 2032
- Table 57: Thailandc Cyber Warfare Industry Revenue (Million) Forecast, by Application 2019 & 2032
- Table 58: Thailandc Cyber Warfare Industry Volume (K Unit) Forecast, by Application 2019 & 2032
- Table 59: Rest of Asia Pacific Cyber Warfare Industry Revenue (Million) Forecast, by Application 2019 & 2032
- Table 60: Rest of Asia Pacific Cyber Warfare Industry Volume (K Unit) Forecast, by Application 2019 & 2032
- Table 61: Global Cyber Warfare Industry Revenue Million Forecast, by Country 2019 & 2032
- Table 62: Global Cyber Warfare Industry Volume K Unit Forecast, by Country 2019 & 2032
- Table 63: Brazil Cyber Warfare Industry Revenue (Million) Forecast, by Application 2019 & 2032
- Table 64: Brazil Cyber Warfare Industry Volume (K Unit) Forecast, by Application 2019 & 2032
- Table 65: Argentina Cyber Warfare Industry Revenue (Million) Forecast, by Application 2019 & 2032
- Table 66: Argentina Cyber Warfare Industry Volume (K Unit) Forecast, by Application 2019 & 2032
- Table 67: Peru Cyber Warfare Industry Revenue (Million) Forecast, by Application 2019 & 2032
- Table 68: Peru Cyber Warfare Industry Volume (K Unit) Forecast, by Application 2019 & 2032
- Table 69: Chile Cyber Warfare Industry Revenue (Million) Forecast, by Application 2019 & 2032
- Table 70: Chile Cyber Warfare Industry Volume (K Unit) Forecast, by Application 2019 & 2032
- Table 71: Colombia Cyber Warfare Industry Revenue (Million) Forecast, by Application 2019 & 2032
- Table 72: Colombia Cyber Warfare Industry Volume (K Unit) Forecast, by Application 2019 & 2032
- Table 73: Ecuador Cyber Warfare Industry Revenue (Million) Forecast, by Application 2019 & 2032
- Table 74: Ecuador Cyber Warfare Industry Volume (K Unit) Forecast, by Application 2019 & 2032
- Table 75: Venezuela Cyber Warfare Industry Revenue (Million) Forecast, by Application 2019 & 2032
- Table 76: Venezuela Cyber Warfare Industry Volume (K Unit) Forecast, by Application 2019 & 2032
- Table 77: Rest of South America Cyber Warfare Industry Revenue (Million) Forecast, by Application 2019 & 2032
- Table 78: Rest of South America Cyber Warfare Industry Volume (K Unit) Forecast, by Application 2019 & 2032
- Table 79: Global Cyber Warfare Industry Revenue Million Forecast, by Country 2019 & 2032
- Table 80: Global Cyber Warfare Industry Volume K Unit Forecast, by Country 2019 & 2032
- Table 81: United States Cyber Warfare Industry Revenue (Million) Forecast, by Application 2019 & 2032
- Table 82: United States Cyber Warfare Industry Volume (K Unit) Forecast, by Application 2019 & 2032
- Table 83: Canada Cyber Warfare Industry Revenue (Million) Forecast, by Application 2019 & 2032
- Table 84: Canada Cyber Warfare Industry Volume (K Unit) Forecast, by Application 2019 & 2032
- Table 85: Mexico Cyber Warfare Industry Revenue (Million) Forecast, by Application 2019 & 2032
- Table 86: Mexico Cyber Warfare Industry Volume (K Unit) Forecast, by Application 2019 & 2032
- Table 87: Global Cyber Warfare Industry Revenue Million Forecast, by Country 2019 & 2032
- Table 88: Global Cyber Warfare Industry Volume K Unit Forecast, by Country 2019 & 2032
- Table 89: United Arab Emirates Cyber Warfare Industry Revenue (Million) Forecast, by Application 2019 & 2032
- Table 90: United Arab Emirates Cyber Warfare Industry Volume (K Unit) Forecast, by Application 2019 & 2032
- Table 91: Saudi Arabia Cyber Warfare Industry Revenue (Million) Forecast, by Application 2019 & 2032
- Table 92: Saudi Arabia Cyber Warfare Industry Volume (K Unit) Forecast, by Application 2019 & 2032
- Table 93: South Africa Cyber Warfare Industry Revenue (Million) Forecast, by Application 2019 & 2032
- Table 94: South Africa Cyber Warfare Industry Volume (K Unit) Forecast, by Application 2019 & 2032
- Table 95: Rest of Middle East and Africa Cyber Warfare Industry Revenue (Million) Forecast, by Application 2019 & 2032
- Table 96: Rest of Middle East and Africa Cyber Warfare Industry Volume (K Unit) Forecast, by Application 2019 & 2032
- Table 97: Global Cyber Warfare Industry Revenue Million Forecast, by End-user Industry 2019 & 2032
- Table 98: Global Cyber Warfare Industry Volume K Unit Forecast, by End-user Industry 2019 & 2032
- Table 99: Global Cyber Warfare Industry Revenue Million Forecast, by Country 2019 & 2032
- Table 100: Global Cyber Warfare Industry Volume K Unit Forecast, by Country 2019 & 2032
- Table 101: Global Cyber Warfare Industry Revenue Million Forecast, by End-user Industry 2019 & 2032
- Table 102: Global Cyber Warfare Industry Volume K Unit Forecast, by End-user Industry 2019 & 2032
- Table 103: Global Cyber Warfare Industry Revenue Million Forecast, by Country 2019 & 2032
- Table 104: Global Cyber Warfare Industry Volume K Unit Forecast, by Country 2019 & 2032
- Table 105: Global Cyber Warfare Industry Revenue Million Forecast, by End-user Industry 2019 & 2032
- Table 106: Global Cyber Warfare Industry Volume K Unit Forecast, by End-user Industry 2019 & 2032
- Table 107: Global Cyber Warfare Industry Revenue Million Forecast, by Country 2019 & 2032
- Table 108: Global Cyber Warfare Industry Volume K Unit Forecast, by Country 2019 & 2032
- Table 109: Global Cyber Warfare Industry Revenue Million Forecast, by End-user Industry 2019 & 2032
- Table 110: Global Cyber Warfare Industry Volume K Unit Forecast, by End-user Industry 2019 & 2032
- Table 111: Global Cyber Warfare Industry Revenue Million Forecast, by Country 2019 & 2032
- Table 112: Global Cyber Warfare Industry Volume K Unit Forecast, by Country 2019 & 2032
- Table 113: Global Cyber Warfare Industry Revenue Million Forecast, by End-user Industry 2019 & 2032
- Table 114: Global Cyber Warfare Industry Volume K Unit Forecast, by End-user Industry 2019 & 2032
- Table 115: Global Cyber Warfare Industry Revenue Million Forecast, by Country 2019 & 2032
- Table 116: Global Cyber Warfare Industry Volume K Unit Forecast, by Country 2019 & 2032
- Table 117: Global Cyber Warfare Industry Revenue Million Forecast, by End-user Industry 2019 & 2032
- Table 118: Global Cyber Warfare Industry Volume K Unit Forecast, by End-user Industry 2019 & 2032
- Table 119: Global Cyber Warfare Industry Revenue Million Forecast, by Country 2019 & 2032
- Table 120: Global Cyber Warfare Industry Volume K Unit Forecast, by Country 2019 & 2032
Frequently Asked Questions
1. What is the projected Compound Annual Growth Rate (CAGR) of the Cyber Warfare Industry?
The projected CAGR is approximately 19.08%.
2. Which companies are prominent players in the Cyber Warfare Industry?
Key companies in the market include General Dynamic Corporation, Raytheon Technologies Corporation, Leonardo SpA, Lockheed Martin Corporation, BAE Systems PLC, Airbus S, DXC Technology Company, Booz Allen Hamilton Inc, The Boeing Company, Mandiant Inc (fireeye Inc ).
3. What are the main segments of the Cyber Warfare Industry?
The market segments include End-user Industry.
4. Can you provide details about the market size?
The market size is estimated to be USD 77.54 Million as of 2022.
5. What are some drivers contributing to market growth?
Increasing Concerns Regarding National Security; Increase in Defense Spending.
6. What are the notable trends driving market growth?
Defense Sector to be the Largest End User.
7. Are there any restraints impacting market growth?
Poor Understanding of Industrial Control Systems; Lack of Interoperability Between Products.
8. Can you provide examples of recent developments in the market?
April 2023 - Cyber security startup Safe Security raised USD 50 Million in its Series B funding round led by Sorenson Capital. The startup announced it continues to focus on innovating ahead of the market and lead with its real-time, data-driven platform for managing and mitigating cyber risk.
9. What pricing options are available for accessing the report?
Pricing options include single-user, multi-user, and enterprise licenses priced at USD 4750, USD 5250, and USD 8750 respectively.
10. Is the market size provided in terms of value or volume?
The market size is provided in terms of value, measured in Million and volume, measured in K Unit.
11. Are there any specific market keywords associated with the report?
Yes, the market keyword associated with the report is "Cyber Warfare Industry," which aids in identifying and referencing the specific market segment covered.
12. How do I determine which pricing option suits my needs best?
The pricing options vary based on user requirements and access needs. Individual users may opt for single-user licenses, while businesses requiring broader access may choose multi-user or enterprise licenses for cost-effective access to the report.
13. Are there any additional resources or data provided in the Cyber Warfare Industry report?
While the report offers comprehensive insights, it's advisable to review the specific contents or supplementary materials provided to ascertain if additional resources or data are available.
14. How can I stay updated on further developments or reports in the Cyber Warfare Industry?
To stay informed about further developments, trends, and reports in the Cyber Warfare Industry, consider subscribing to industry newsletters, following relevant companies and organizations, or regularly checking reputable industry news sources and publications.
Methodology
Step 1 - Identification of Relevant Samples Size from Population Database


Step 2 - Approaches for Defining Global Market Size (Value, Volume* & Price*)

Note*: In applicable scenarios
Step 3 - Data Sources
Primary Research
- Web Analytics
- Survey Reports
- Research Institute
- Latest Research Reports
- Opinion Leaders
Secondary Research
- Annual Reports
- White Paper
- Latest Press Release
- Industry Association
- Paid Database
- Investor Presentations

Step 4 - Data Triangulation
Involves using different sources of information in order to increase the validity of a study
These sources are likely to be stakeholders in a program - participants, other researchers, program staff, other community members, and so on.
Then we put all data in single framework & apply various statistical tools to find out the dynamic on the market.
During the analysis stage, feedback from the stakeholder groups would be compared to determine areas of agreement as well as areas of divergence
