

Key Insights
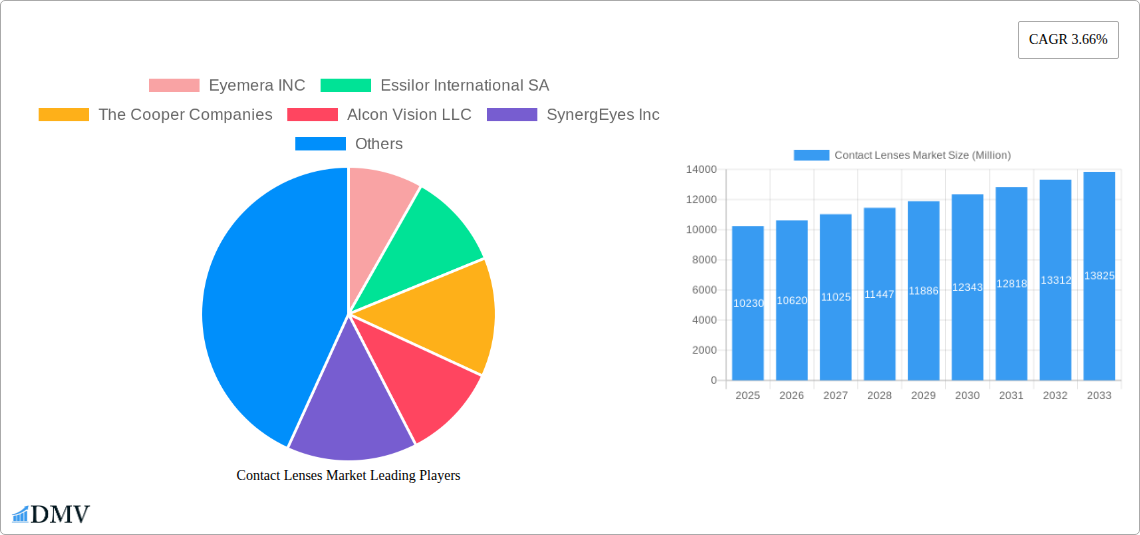
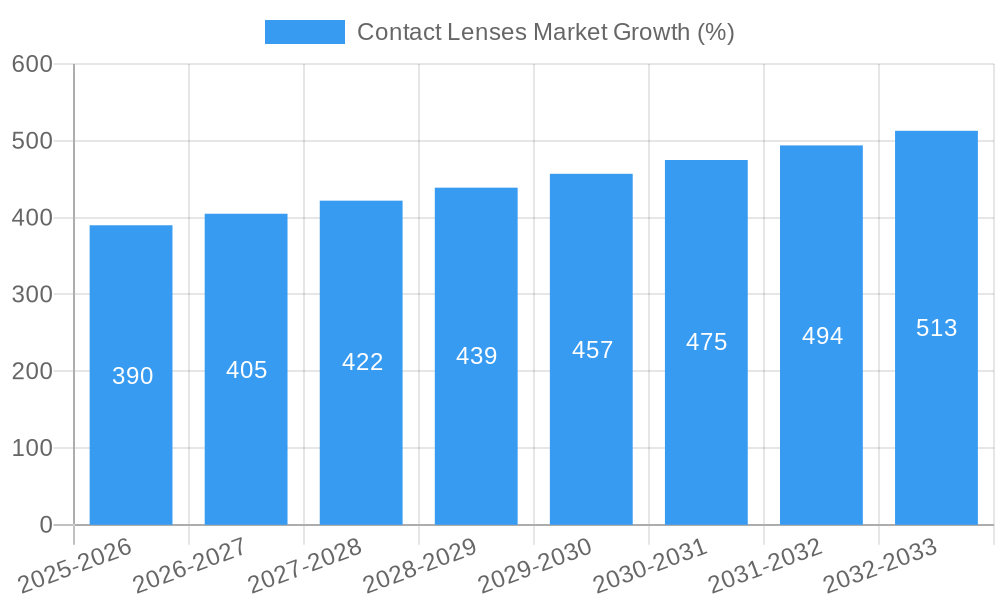
The global contact lenses market, valued at $10.23 billion in 2025, is projected to experience steady growth, driven by increasing prevalence of refractive errors like myopia and hyperopia, a rising aging population necessitating presbyopia correction, and the growing popularity of cosmetic contact lenses. The market's Compound Annual Growth Rate (CAGR) of 3.66% from 2025 to 2033 indicates a consistent expansion, although this rate might fluctuate based on factors such as technological advancements, economic conditions, and evolving consumer preferences. Key segments driving growth include disposable contact lenses, owing to their convenience and hygiene benefits, and soft contact lenses, favored for their comfort and ease of use. The toric and multifocal contact lens segments are also experiencing robust growth, fueled by the increasing demand for vision correction beyond simple spherical lenses. Geographical distribution reveals strong market presence in North America and Europe, with Asia Pacific exhibiting significant growth potential due to its expanding middle class and increasing disposable incomes. Competition among established players like Johnson & Johnson Vision Care, Alcon, CooperVision, and Essilor is intense, leading to continuous innovation in lens materials, designs, and manufacturing processes.
Technological advancements such as the development of silicone hydrogel lenses with enhanced oxygen permeability and the introduction of smart contact lenses with integrated sensors contribute to market dynamism. However, factors like potential health risks associated with contact lens use, high costs compared to other vision correction methods, and the need for consistent adherence to proper hygiene protocols pose potential restraints. Nevertheless, the continuous development of more comfortable, durable, and technologically advanced contact lenses coupled with rising awareness about eye health are anticipated to mitigate these constraints and propel market expansion throughout the forecast period. The market will likely see further segmentation based on specific lens features and functionalities, further driving growth and specialization within the industry. This includes innovative designs addressing specific vision impairments and conditions.
Contact Lenses Market: A Comprehensive Report (2019-2033)
This insightful report provides a detailed analysis of the global Contact Lenses Market, offering a comprehensive overview of its current state, future trajectory, and key players. The study period covers 2019-2033, with 2025 as the base and estimated year, and a forecast period spanning 2025-2033. The report utilizes a robust methodology, integrating historical data (2019-2024) with current market trends and expert projections to provide stakeholders with actionable intelligence. The market is valued at xx Million in 2025 and is projected to reach xx Million by 2033, exhibiting a robust Compound Annual Growth Rate (CAGR) of xx%.
Contact Lenses Market Composition & Trends
This section delves into the competitive landscape, innovative drivers, and regulatory factors shaping the Contact Lenses Market. We analyze market concentration, revealing the market share distribution amongst key players like Essilor International SA, Johnson & Johnson Vision Care Inc, Alcon Vision LLC, and CooperVision. The report also examines the impact of mergers and acquisitions (M&A), quantifying deal values where possible and assessing their influence on market dynamics. Innovation, spurred by advancements in materials science and lens design, is a significant driver, while regulatory landscapes, particularly FDA approvals in the US and CE markings in Europe, play a crucial role in product launches and market access. The report also considers substitute products, such as refractive surgery, and analyzes end-user profiles based on age, vision correction needs, and lifestyle preferences.
- Market Share Distribution: Essilor International SA holds an estimated xx% market share in 2025, followed by Johnson & Johnson Vision Care Inc at xx%, Alcon Vision LLC at xx%, and CooperVision at xx%. Other significant players hold the remaining xx%.
- M&A Activity: The report details significant M&A activity within the contact lenses sector during the study period, highlighting deal values totaling approximately xx Million. This activity reflects the consolidation of market share and the strategic pursuit of innovation.
- Regulatory Landscape: The report assesses the impact of key regulatory bodies and their guidelines on market access and product development across various regions.
Contact Lenses Market Industry Evolution
This section charts the evolution of the Contact Lenses Market, examining growth trajectories, technological advancements, and evolving consumer preferences. The market has witnessed a shift towards disposable lenses, driven by convenience and hygiene concerns. Technological innovations, such as silicone hydrogel materials and advanced lens designs (multifocal, toric), have significantly improved comfort and visual acuity. Furthermore, the growing awareness of eye health and increasing prevalence of refractive errors are major drivers of market growth. The report quantifies these trends with specific data points, analyzing growth rates in different segments and regions and providing adoption metrics for specific technologies. For instance, the disposable contact lens segment is projected to experience a CAGR of xx% during the forecast period, driven by consumer preference. The increasing adoption of silicone hydrogel materials, offering superior oxygen permeability, is another key factor contributing to the overall market growth.
Leading Regions, Countries, or Segments in Contact Lenses Market
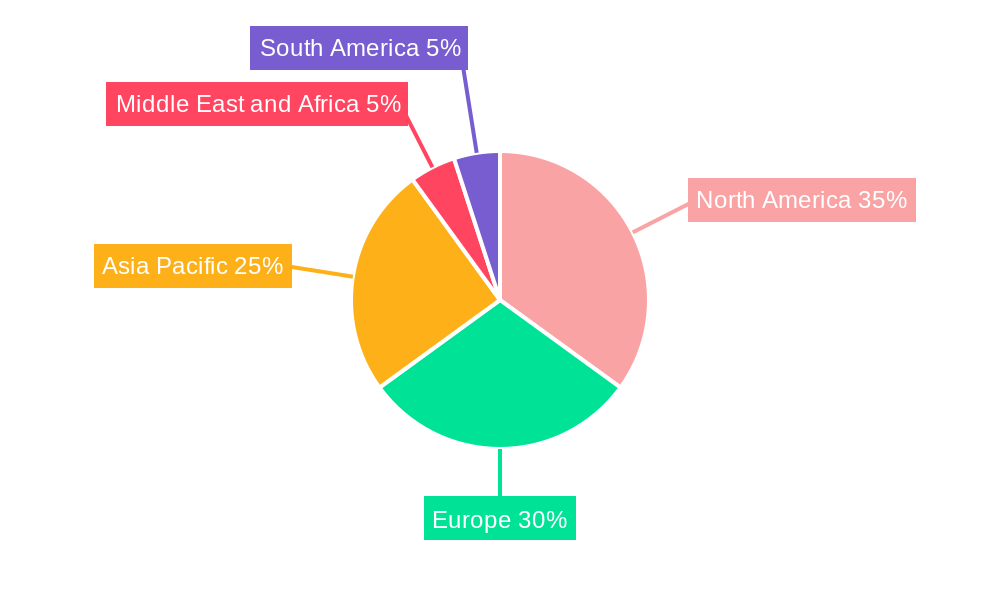
This section pinpoints the dominant regions, countries, and segments within the Contact Lenses Market. The North American market currently holds the largest share, attributed to high disposable incomes, high prevalence of refractive errors, and strong regulatory support. The Asia-Pacific region is poised for significant growth, fueled by rising disposable incomes and increasing awareness of eye health.
Key Drivers:
- North America: High per capita disposable income, strong regulatory framework, and high prevalence of vision correction needs.
- Asia-Pacific: Rapid economic growth, increasing prevalence of refractive errors, and rising adoption of advanced lens technologies.
- Europe: Established healthcare infrastructure and high awareness of eye health.
Dominant Segments:
- Usage: Corrective contact lenses dominate the market, followed by cosmetic contact lenses.
- Modality: Disposable contact lenses are the fastest-growing segment due to hygiene and convenience.
- Design: Spherical lenses still hold a majority, but multifocal and toric designs are gaining traction.
- Product Type: Soft contact lenses are the most widely used, with rigid gas permeable lenses holding a niche but significant segment.
Contact Lenses Market Product Innovations
Recent years have witnessed significant advancements in contact lens technology, focusing on enhanced comfort, improved vision correction, and extended wear capabilities. The introduction of silicone hydrogel materials has revolutionized the industry, providing superior oxygen permeability and minimizing complications associated with traditional materials. Innovations in lens designs, such as multifocal lenses for presbyopia and toric lenses for astigmatism, cater to a wider range of vision correction needs. Unique selling propositions (USPs) often include extended wear periods, enhanced breathability, and improved comfort features. Companies are also investing heavily in developing smart contact lenses with integrated health monitoring capabilities.
Propelling Factors for Contact Lenses Market Growth
Several factors drive the growth of the Contact Lenses Market. Technological advancements, particularly in materials science and lens design, lead to improved comfort, vision correction, and wearability. The growing prevalence of refractive errors, coupled with increased awareness of eye health and vision care, fuels demand. Furthermore, favourable regulatory environments in key markets and supportive reimbursement policies accelerate market expansion. The rising disposable income in developing economies also boosts market penetration.
Obstacles in the Contact Lenses Market Market
Despite strong growth prospects, the Contact Lenses Market faces challenges. Regulatory hurdles associated with product approvals and stringent safety standards can hinder market entry and innovation. Supply chain disruptions and fluctuations in raw material prices impact production costs and profitability. Intense competition amongst major players necessitates continuous innovation and aggressive marketing strategies. These challenges can have quantifiable impacts on market growth, particularly in terms of production delays and increased costs.
Future Opportunities in Contact Lenses Market
The Contact Lenses Market presents significant future opportunities. The expansion into emerging markets offers substantial growth potential, as does the development and adoption of smart contact lenses with integrated health monitoring capabilities. Further innovations in lens materials and designs will cater to unmet needs and enhance user experience. Personalized medicine approaches and tailored lens solutions based on individual patient profiles will also drive growth.
Major Players in the Contact Lenses Market Ecosystem
- Eyemera INC
- Essilor International SA
- The Cooper Companies
- Alcon Vision LLC
- SynergEyes Inc
- Menicon Co Ltd
- Zeiss Group
- Johnson & Johnson Vision Care Inc
- Seed Co Ltd
- Bausch Health Companies Inc
- Hoya Corporation
Key Developments in Contact Lenses Market Industry
- June 2022: Johnson & Johnson Vision received FDA clearance for ACUVUE OASYS MAX 1-Day and ACUVUE OASYS MAX 1-Day MULTIFOCAL, expanding its product portfolio and strengthening its market position.
- April 2022: Alcon launched Precision, a daily disposable silicone hydrogel contact lens for astigmatism in Canada, enhancing its product offerings and expanding its market reach.
Strategic Contact Lenses Market Market Forecast
The Contact Lenses Market is poised for sustained growth, driven by technological advancements, increased awareness of eye health, and rising disposable incomes globally. The continued development of innovative lens materials, designs, and functionalities will cater to unmet needs and drive market expansion. Emerging markets, particularly in Asia-Pacific, offer significant growth potential, while the integration of smart technology in contact lenses promises further innovation and new market opportunities. The market is expected to witness a significant upswing in the coming years.
Contact Lenses Market Segmentation
-
1. Product Type
- 1.1. Soft Contact Lenses
- 1.2. Hybrid Contact Lenses
- 1.3. Rigid Gas Permeable Contact Lenses
- 1.4. Other Product Types
-
2. Usage
- 2.1. Corrective Contact Lenses
- 2.2. Therapeutic Contact Lenses
- 2.3. Cosmetic Contact Lenses
- 2.4. Prosthetic Contact Lenses
-
3. Modality
- 3.1. Conventional
- 3.2. Disposable
-
4. Design
- 4.1. Spherical
- 4.2. Toric
- 4.3. Multifocal
- 4.4. Other Designs
Contact Lenses Market Segmentation By Geography
-
1. North America
- 1.1. United States
- 1.2. Canada
- 1.3. Mexico
-
2. Europe
- 2.1. United Kingdom
- 2.2. Germany
- 2.3. France
- 2.4. Italy
- 2.5. Spain
- 2.6. Rest of Europe
-
3. Asia Pacific
- 3.1. China
- 3.2. Japan
- 3.3. India
- 3.4. Australia
- 3.5. South Korea
- 3.6. Rest of Asia Pacific
-
4. Middle East and Africa
- 4.1. GCC
- 4.2. South Africa
- 4.3. Rest of Middle East and Africa
-
5. South America
- 5.1. Brazil
- 5.2. Argentina
- 5.3. Rest of South America
Contact Lenses Market REPORT HIGHLIGHTS
| Aspects | Details |
|---|---|
| Study Period | 2019-2033 |
| Base Year | 2024 |
| Estimated Year | 2025 |
| Forecast Period | 2025-2033 |
| Historical Period | 2019-2024 |
| Growth Rate | CAGR of 3.66% from 2019-2033 |
| Segmentation |
|
Table of Contents
- 1. Introduction
- 1.1. Research Scope
- 1.2. Market Segmentation
- 1.3. Research Methodology
- 1.4. Definitions and Assumptions
- 2. Executive Summary
- 2.1. Introduction
- 3. Market Dynamics
- 3.1. Introduction
- 3.2. Market Drivers
- 3.2.1. Increasing Burden of Optical Disorders; Increasing Tendency to Enhance Aesthetics
- 3.3. Market Restrains
- 3.3.1. Availability of Alternative Techniques and Complications Associated with Lenses4.3.2
- 3.4. Market Trends
- 3.4.1. Corrective Contact Lenses are Expected to Register a Significant Growth Rate over the Forecast Period
- 4. Market Factor Analysis
- 4.1. Porters Five Forces
- 4.2. Supply/Value Chain
- 4.3. PESTEL analysis
- 4.4. Market Entropy
- 4.5. Patent/Trademark Analysis
- 5. Global Contact Lenses Market Analysis, Insights and Forecast, 2019-2031
- 5.1. Market Analysis, Insights and Forecast - by Product Type
- 5.1.1. Soft Contact Lenses
- 5.1.2. Hybrid Contact Lenses
- 5.1.3. Rigid Gas Permeable Contact Lenses
- 5.1.4. Other Product Types
- 5.2. Market Analysis, Insights and Forecast - by Usage
- 5.2.1. Corrective Contact Lenses
- 5.2.2. Therapeutic Contact Lenses
- 5.2.3. Cosmetic Contact Lenses
- 5.2.4. Prosthetic Contact Lenses
- 5.3. Market Analysis, Insights and Forecast - by Modality
- 5.3.1. Conventional
- 5.3.2. Disposable
- 5.4. Market Analysis, Insights and Forecast - by Design
- 5.4.1. Spherical
- 5.4.2. Toric
- 5.4.3. Multifocal
- 5.4.4. Other Designs
- 5.5. Market Analysis, Insights and Forecast - by Region
- 5.5.1. North America
- 5.5.2. Europe
- 5.5.3. Asia Pacific
- 5.5.4. Middle East and Africa
- 5.5.5. South America
- 5.1. Market Analysis, Insights and Forecast - by Product Type
- 6. North America Contact Lenses Market Analysis, Insights and Forecast, 2019-2031
- 6.1. Market Analysis, Insights and Forecast - by Product Type
- 6.1.1. Soft Contact Lenses
- 6.1.2. Hybrid Contact Lenses
- 6.1.3. Rigid Gas Permeable Contact Lenses
- 6.1.4. Other Product Types
- 6.2. Market Analysis, Insights and Forecast - by Usage
- 6.2.1. Corrective Contact Lenses
- 6.2.2. Therapeutic Contact Lenses
- 6.2.3. Cosmetic Contact Lenses
- 6.2.4. Prosthetic Contact Lenses
- 6.3. Market Analysis, Insights and Forecast - by Modality
- 6.3.1. Conventional
- 6.3.2. Disposable
- 6.4. Market Analysis, Insights and Forecast - by Design
- 6.4.1. Spherical
- 6.4.2. Toric
- 6.4.3. Multifocal
- 6.4.4. Other Designs
- 6.1. Market Analysis, Insights and Forecast - by Product Type
- 7. Europe Contact Lenses Market Analysis, Insights and Forecast, 2019-2031
- 7.1. Market Analysis, Insights and Forecast - by Product Type
- 7.1.1. Soft Contact Lenses
- 7.1.2. Hybrid Contact Lenses
- 7.1.3. Rigid Gas Permeable Contact Lenses
- 7.1.4. Other Product Types
- 7.2. Market Analysis, Insights and Forecast - by Usage
- 7.2.1. Corrective Contact Lenses
- 7.2.2. Therapeutic Contact Lenses
- 7.2.3. Cosmetic Contact Lenses
- 7.2.4. Prosthetic Contact Lenses
- 7.3. Market Analysis, Insights and Forecast - by Modality
- 7.3.1. Conventional
- 7.3.2. Disposable
- 7.4. Market Analysis, Insights and Forecast - by Design
- 7.4.1. Spherical
- 7.4.2. Toric
- 7.4.3. Multifocal
- 7.4.4. Other Designs
- 7.1. Market Analysis, Insights and Forecast - by Product Type
- 8. Asia Pacific Contact Lenses Market Analysis, Insights and Forecast, 2019-2031
- 8.1. Market Analysis, Insights and Forecast - by Product Type
- 8.1.1. Soft Contact Lenses
- 8.1.2. Hybrid Contact Lenses
- 8.1.3. Rigid Gas Permeable Contact Lenses
- 8.1.4. Other Product Types
- 8.2. Market Analysis, Insights and Forecast - by Usage
- 8.2.1. Corrective Contact Lenses
- 8.2.2. Therapeutic Contact Lenses
- 8.2.3. Cosmetic Contact Lenses
- 8.2.4. Prosthetic Contact Lenses
- 8.3. Market Analysis, Insights and Forecast - by Modality
- 8.3.1. Conventional
- 8.3.2. Disposable
- 8.4. Market Analysis, Insights and Forecast - by Design
- 8.4.1. Spherical
- 8.4.2. Toric
- 8.4.3. Multifocal
- 8.4.4. Other Designs
- 8.1. Market Analysis, Insights and Forecast - by Product Type
- 9. Middle East and Africa Contact Lenses Market Analysis, Insights and Forecast, 2019-2031
- 9.1. Market Analysis, Insights and Forecast - by Product Type
- 9.1.1. Soft Contact Lenses
- 9.1.2. Hybrid Contact Lenses
- 9.1.3. Rigid Gas Permeable Contact Lenses
- 9.1.4. Other Product Types
- 9.2. Market Analysis, Insights and Forecast - by Usage
- 9.2.1. Corrective Contact Lenses
- 9.2.2. Therapeutic Contact Lenses
- 9.2.3. Cosmetic Contact Lenses
- 9.2.4. Prosthetic Contact Lenses
- 9.3. Market Analysis, Insights and Forecast - by Modality
- 9.3.1. Conventional
- 9.3.2. Disposable
- 9.4. Market Analysis, Insights and Forecast - by Design
- 9.4.1. Spherical
- 9.4.2. Toric
- 9.4.3. Multifocal
- 9.4.4. Other Designs
- 9.1. Market Analysis, Insights and Forecast - by Product Type
- 10. South America Contact Lenses Market Analysis, Insights and Forecast, 2019-2031
- 10.1. Market Analysis, Insights and Forecast - by Product Type
- 10.1.1. Soft Contact Lenses
- 10.1.2. Hybrid Contact Lenses
- 10.1.3. Rigid Gas Permeable Contact Lenses
- 10.1.4. Other Product Types
- 10.2. Market Analysis, Insights and Forecast - by Usage
- 10.2.1. Corrective Contact Lenses
- 10.2.2. Therapeutic Contact Lenses
- 10.2.3. Cosmetic Contact Lenses
- 10.2.4. Prosthetic Contact Lenses
- 10.3. Market Analysis, Insights and Forecast - by Modality
- 10.3.1. Conventional
- 10.3.2. Disposable
- 10.4. Market Analysis, Insights and Forecast - by Design
- 10.4.1. Spherical
- 10.4.2. Toric
- 10.4.3. Multifocal
- 10.4.4. Other Designs
- 10.1. Market Analysis, Insights and Forecast - by Product Type
- 11. North America Contact Lenses Market Analysis, Insights and Forecast, 2019-2031
- 11.1. Market Analysis, Insights and Forecast - By Country/Sub-region
- 11.1.1 United States
- 11.1.2 Canada
- 11.1.3 Mexico
- 12. Europe Contact Lenses Market Analysis, Insights and Forecast, 2019-2031
- 12.1. Market Analysis, Insights and Forecast - By Country/Sub-region
- 12.1.1 United Kingdom
- 12.1.2 Germany
- 12.1.3 France
- 12.1.4 Italy
- 12.1.5 Spain
- 12.1.6 Rest of Europe
- 13. Asia Pacific Contact Lenses Market Analysis, Insights and Forecast, 2019-2031
- 13.1. Market Analysis, Insights and Forecast - By Country/Sub-region
- 13.1.1 China
- 13.1.2 Japan
- 13.1.3 India
- 13.1.4 Australia
- 13.1.5 South Korea
- 13.1.6 Rest of Asia Pacific
- 14. Middle East and Africa Contact Lenses Market Analysis, Insights and Forecast, 2019-2031
- 14.1. Market Analysis, Insights and Forecast - By Country/Sub-region
- 14.1.1 GCC
- 14.1.2 South Africa
- 14.1.3 Rest of Middle East and Africa
- 15. South America Contact Lenses Market Analysis, Insights and Forecast, 2019-2031
- 15.1. Market Analysis, Insights and Forecast - By Country/Sub-region
- 15.1.1 Brazil
- 15.1.2 Argentina
- 15.1.3 Rest of South America
- 16. Competitive Analysis
- 16.1. Global Market Share Analysis 2024
- 16.2. Company Profiles
- 16.2.1 Eyemera INC
- 16.2.1.1. Overview
- 16.2.1.2. Products
- 16.2.1.3. SWOT Analysis
- 16.2.1.4. Recent Developments
- 16.2.1.5. Financials (Based on Availability)
- 16.2.2 Essilor International SA
- 16.2.2.1. Overview
- 16.2.2.2. Products
- 16.2.2.3. SWOT Analysis
- 16.2.2.4. Recent Developments
- 16.2.2.5. Financials (Based on Availability)
- 16.2.3 The Cooper Companies
- 16.2.3.1. Overview
- 16.2.3.2. Products
- 16.2.3.3. SWOT Analysis
- 16.2.3.4. Recent Developments
- 16.2.3.5. Financials (Based on Availability)
- 16.2.4 Alcon Vision LLC
- 16.2.4.1. Overview
- 16.2.4.2. Products
- 16.2.4.3. SWOT Analysis
- 16.2.4.4. Recent Developments
- 16.2.4.5. Financials (Based on Availability)
- 16.2.5 SynergEyes Inc
- 16.2.5.1. Overview
- 16.2.5.2. Products
- 16.2.5.3. SWOT Analysis
- 16.2.5.4. Recent Developments
- 16.2.5.5. Financials (Based on Availability)
- 16.2.6 Menicon Co Ltd
- 16.2.6.1. Overview
- 16.2.6.2. Products
- 16.2.6.3. SWOT Analysis
- 16.2.6.4. Recent Developments
- 16.2.6.5. Financials (Based on Availability)
- 16.2.7 Zeiss Group
- 16.2.7.1. Overview
- 16.2.7.2. Products
- 16.2.7.3. SWOT Analysis
- 16.2.7.4. Recent Developments
- 16.2.7.5. Financials (Based on Availability)
- 16.2.8 Johnson & Johnson Vision Care Inc
- 16.2.8.1. Overview
- 16.2.8.2. Products
- 16.2.8.3. SWOT Analysis
- 16.2.8.4. Recent Developments
- 16.2.8.5. Financials (Based on Availability)
- 16.2.9 Seed Co Ltd
- 16.2.9.1. Overview
- 16.2.9.2. Products
- 16.2.9.3. SWOT Analysis
- 16.2.9.4. Recent Developments
- 16.2.9.5. Financials (Based on Availability)
- 16.2.10 Bausch Health Companies Inc
- 16.2.10.1. Overview
- 16.2.10.2. Products
- 16.2.10.3. SWOT Analysis
- 16.2.10.4. Recent Developments
- 16.2.10.5. Financials (Based on Availability)
- 16.2.11 Hoya Corporation
- 16.2.11.1. Overview
- 16.2.11.2. Products
- 16.2.11.3. SWOT Analysis
- 16.2.11.4. Recent Developments
- 16.2.11.5. Financials (Based on Availability)
- 16.2.1 Eyemera INC
List of Figures
- Figure 1: Global Contact Lenses Market Revenue Breakdown (Million, %) by Region 2024 & 2032
- Figure 2: Global Contact Lenses Market Volume Breakdown (K Unit, %) by Region 2024 & 2032
- Figure 3: North America Contact Lenses Market Revenue (Million), by Country 2024 & 2032
- Figure 4: North America Contact Lenses Market Volume (K Unit), by Country 2024 & 2032
- Figure 5: North America Contact Lenses Market Revenue Share (%), by Country 2024 & 2032
- Figure 6: North America Contact Lenses Market Volume Share (%), by Country 2024 & 2032
- Figure 7: Europe Contact Lenses Market Revenue (Million), by Country 2024 & 2032
- Figure 8: Europe Contact Lenses Market Volume (K Unit), by Country 2024 & 2032
- Figure 9: Europe Contact Lenses Market Revenue Share (%), by Country 2024 & 2032
- Figure 10: Europe Contact Lenses Market Volume Share (%), by Country 2024 & 2032
- Figure 11: Asia Pacific Contact Lenses Market Revenue (Million), by Country 2024 & 2032
- Figure 12: Asia Pacific Contact Lenses Market Volume (K Unit), by Country 2024 & 2032
- Figure 13: Asia Pacific Contact Lenses Market Revenue Share (%), by Country 2024 & 2032
- Figure 14: Asia Pacific Contact Lenses Market Volume Share (%), by Country 2024 & 2032
- Figure 15: Middle East and Africa Contact Lenses Market Revenue (Million), by Country 2024 & 2032
- Figure 16: Middle East and Africa Contact Lenses Market Volume (K Unit), by Country 2024 & 2032
- Figure 17: Middle East and Africa Contact Lenses Market Revenue Share (%), by Country 2024 & 2032
- Figure 18: Middle East and Africa Contact Lenses Market Volume Share (%), by Country 2024 & 2032
- Figure 19: South America Contact Lenses Market Revenue (Million), by Country 2024 & 2032
- Figure 20: South America Contact Lenses Market Volume (K Unit), by Country 2024 & 2032
- Figure 21: South America Contact Lenses Market Revenue Share (%), by Country 2024 & 2032
- Figure 22: South America Contact Lenses Market Volume Share (%), by Country 2024 & 2032
- Figure 23: North America Contact Lenses Market Revenue (Million), by Product Type 2024 & 2032
- Figure 24: North America Contact Lenses Market Volume (K Unit), by Product Type 2024 & 2032
- Figure 25: North America Contact Lenses Market Revenue Share (%), by Product Type 2024 & 2032
- Figure 26: North America Contact Lenses Market Volume Share (%), by Product Type 2024 & 2032
- Figure 27: North America Contact Lenses Market Revenue (Million), by Usage 2024 & 2032
- Figure 28: North America Contact Lenses Market Volume (K Unit), by Usage 2024 & 2032
- Figure 29: North America Contact Lenses Market Revenue Share (%), by Usage 2024 & 2032
- Figure 30: North America Contact Lenses Market Volume Share (%), by Usage 2024 & 2032
- Figure 31: North America Contact Lenses Market Revenue (Million), by Modality 2024 & 2032
- Figure 32: North America Contact Lenses Market Volume (K Unit), by Modality 2024 & 2032
- Figure 33: North America Contact Lenses Market Revenue Share (%), by Modality 2024 & 2032
- Figure 34: North America Contact Lenses Market Volume Share (%), by Modality 2024 & 2032
- Figure 35: North America Contact Lenses Market Revenue (Million), by Design 2024 & 2032
- Figure 36: North America Contact Lenses Market Volume (K Unit), by Design 2024 & 2032
- Figure 37: North America Contact Lenses Market Revenue Share (%), by Design 2024 & 2032
- Figure 38: North America Contact Lenses Market Volume Share (%), by Design 2024 & 2032
- Figure 39: North America Contact Lenses Market Revenue (Million), by Country 2024 & 2032
- Figure 40: North America Contact Lenses Market Volume (K Unit), by Country 2024 & 2032
- Figure 41: North America Contact Lenses Market Revenue Share (%), by Country 2024 & 2032
- Figure 42: North America Contact Lenses Market Volume Share (%), by Country 2024 & 2032
- Figure 43: Europe Contact Lenses Market Revenue (Million), by Product Type 2024 & 2032
- Figure 44: Europe Contact Lenses Market Volume (K Unit), by Product Type 2024 & 2032
- Figure 45: Europe Contact Lenses Market Revenue Share (%), by Product Type 2024 & 2032
- Figure 46: Europe Contact Lenses Market Volume Share (%), by Product Type 2024 & 2032
- Figure 47: Europe Contact Lenses Market Revenue (Million), by Usage 2024 & 2032
- Figure 48: Europe Contact Lenses Market Volume (K Unit), by Usage 2024 & 2032
- Figure 49: Europe Contact Lenses Market Revenue Share (%), by Usage 2024 & 2032
- Figure 50: Europe Contact Lenses Market Volume Share (%), by Usage 2024 & 2032
- Figure 51: Europe Contact Lenses Market Revenue (Million), by Modality 2024 & 2032
- Figure 52: Europe Contact Lenses Market Volume (K Unit), by Modality 2024 & 2032
- Figure 53: Europe Contact Lenses Market Revenue Share (%), by Modality 2024 & 2032
- Figure 54: Europe Contact Lenses Market Volume Share (%), by Modality 2024 & 2032
- Figure 55: Europe Contact Lenses Market Revenue (Million), by Design 2024 & 2032
- Figure 56: Europe Contact Lenses Market Volume (K Unit), by Design 2024 & 2032
- Figure 57: Europe Contact Lenses Market Revenue Share (%), by Design 2024 & 2032
- Figure 58: Europe Contact Lenses Market Volume Share (%), by Design 2024 & 2032
- Figure 59: Europe Contact Lenses Market Revenue (Million), by Country 2024 & 2032
- Figure 60: Europe Contact Lenses Market Volume (K Unit), by Country 2024 & 2032
- Figure 61: Europe Contact Lenses Market Revenue Share (%), by Country 2024 & 2032
- Figure 62: Europe Contact Lenses Market Volume Share (%), by Country 2024 & 2032
- Figure 63: Asia Pacific Contact Lenses Market Revenue (Million), by Product Type 2024 & 2032
- Figure 64: Asia Pacific Contact Lenses Market Volume (K Unit), by Product Type 2024 & 2032
- Figure 65: Asia Pacific Contact Lenses Market Revenue Share (%), by Product Type 2024 & 2032
- Figure 66: Asia Pacific Contact Lenses Market Volume Share (%), by Product Type 2024 & 2032
- Figure 67: Asia Pacific Contact Lenses Market Revenue (Million), by Usage 2024 & 2032
- Figure 68: Asia Pacific Contact Lenses Market Volume (K Unit), by Usage 2024 & 2032
- Figure 69: Asia Pacific Contact Lenses Market Revenue Share (%), by Usage 2024 & 2032
- Figure 70: Asia Pacific Contact Lenses Market Volume Share (%), by Usage 2024 & 2032
- Figure 71: Asia Pacific Contact Lenses Market Revenue (Million), by Modality 2024 & 2032
- Figure 72: Asia Pacific Contact Lenses Market Volume (K Unit), by Modality 2024 & 2032
- Figure 73: Asia Pacific Contact Lenses Market Revenue Share (%), by Modality 2024 & 2032
- Figure 74: Asia Pacific Contact Lenses Market Volume Share (%), by Modality 2024 & 2032
- Figure 75: Asia Pacific Contact Lenses Market Revenue (Million), by Design 2024 & 2032
- Figure 76: Asia Pacific Contact Lenses Market Volume (K Unit), by Design 2024 & 2032
- Figure 77: Asia Pacific Contact Lenses Market Revenue Share (%), by Design 2024 & 2032
- Figure 78: Asia Pacific Contact Lenses Market Volume Share (%), by Design 2024 & 2032
- Figure 79: Asia Pacific Contact Lenses Market Revenue (Million), by Country 2024 & 2032
- Figure 80: Asia Pacific Contact Lenses Market Volume (K Unit), by Country 2024 & 2032
- Figure 81: Asia Pacific Contact Lenses Market Revenue Share (%), by Country 2024 & 2032
- Figure 82: Asia Pacific Contact Lenses Market Volume Share (%), by Country 2024 & 2032
- Figure 83: Middle East and Africa Contact Lenses Market Revenue (Million), by Product Type 2024 & 2032
- Figure 84: Middle East and Africa Contact Lenses Market Volume (K Unit), by Product Type 2024 & 2032
- Figure 85: Middle East and Africa Contact Lenses Market Revenue Share (%), by Product Type 2024 & 2032
- Figure 86: Middle East and Africa Contact Lenses Market Volume Share (%), by Product Type 2024 & 2032
- Figure 87: Middle East and Africa Contact Lenses Market Revenue (Million), by Usage 2024 & 2032
- Figure 88: Middle East and Africa Contact Lenses Market Volume (K Unit), by Usage 2024 & 2032
- Figure 89: Middle East and Africa Contact Lenses Market Revenue Share (%), by Usage 2024 & 2032
- Figure 90: Middle East and Africa Contact Lenses Market Volume Share (%), by Usage 2024 & 2032
- Figure 91: Middle East and Africa Contact Lenses Market Revenue (Million), by Modality 2024 & 2032
- Figure 92: Middle East and Africa Contact Lenses Market Volume (K Unit), by Modality 2024 & 2032
- Figure 93: Middle East and Africa Contact Lenses Market Revenue Share (%), by Modality 2024 & 2032
- Figure 94: Middle East and Africa Contact Lenses Market Volume Share (%), by Modality 2024 & 2032
- Figure 95: Middle East and Africa Contact Lenses Market Revenue (Million), by Design 2024 & 2032
- Figure 96: Middle East and Africa Contact Lenses Market Volume (K Unit), by Design 2024 & 2032
- Figure 97: Middle East and Africa Contact Lenses Market Revenue Share (%), by Design 2024 & 2032
- Figure 98: Middle East and Africa Contact Lenses Market Volume Share (%), by Design 2024 & 2032
- Figure 99: Middle East and Africa Contact Lenses Market Revenue (Million), by Country 2024 & 2032
- Figure 100: Middle East and Africa Contact Lenses Market Volume (K Unit), by Country 2024 & 2032
- Figure 101: Middle East and Africa Contact Lenses Market Revenue Share (%), by Country 2024 & 2032
- Figure 102: Middle East and Africa Contact Lenses Market Volume Share (%), by Country 2024 & 2032
- Figure 103: South America Contact Lenses Market Revenue (Million), by Product Type 2024 & 2032
- Figure 104: South America Contact Lenses Market Volume (K Unit), by Product Type 2024 & 2032
- Figure 105: South America Contact Lenses Market Revenue Share (%), by Product Type 2024 & 2032
- Figure 106: South America Contact Lenses Market Volume Share (%), by Product Type 2024 & 2032
- Figure 107: South America Contact Lenses Market Revenue (Million), by Usage 2024 & 2032
- Figure 108: South America Contact Lenses Market Volume (K Unit), by Usage 2024 & 2032
- Figure 109: South America Contact Lenses Market Revenue Share (%), by Usage 2024 & 2032
- Figure 110: South America Contact Lenses Market Volume Share (%), by Usage 2024 & 2032
- Figure 111: South America Contact Lenses Market Revenue (Million), by Modality 2024 & 2032
- Figure 112: South America Contact Lenses Market Volume (K Unit), by Modality 2024 & 2032
- Figure 113: South America Contact Lenses Market Revenue Share (%), by Modality 2024 & 2032
- Figure 114: South America Contact Lenses Market Volume Share (%), by Modality 2024 & 2032
- Figure 115: South America Contact Lenses Market Revenue (Million), by Design 2024 & 2032
- Figure 116: South America Contact Lenses Market Volume (K Unit), by Design 2024 & 2032
- Figure 117: South America Contact Lenses Market Revenue Share (%), by Design 2024 & 2032
- Figure 118: South America Contact Lenses Market Volume Share (%), by Design 2024 & 2032
- Figure 119: South America Contact Lenses Market Revenue (Million), by Country 2024 & 2032
- Figure 120: South America Contact Lenses Market Volume (K Unit), by Country 2024 & 2032
- Figure 121: South America Contact Lenses Market Revenue Share (%), by Country 2024 & 2032
- Figure 122: South America Contact Lenses Market Volume Share (%), by Country 2024 & 2032
List of Tables
- Table 1: Global Contact Lenses Market Revenue Million Forecast, by Region 2019 & 2032
- Table 2: Global Contact Lenses Market Volume K Unit Forecast, by Region 2019 & 2032
- Table 3: Global Contact Lenses Market Revenue Million Forecast, by Product Type 2019 & 2032
- Table 4: Global Contact Lenses Market Volume K Unit Forecast, by Product Type 2019 & 2032
- Table 5: Global Contact Lenses Market Revenue Million Forecast, by Usage 2019 & 2032
- Table 6: Global Contact Lenses Market Volume K Unit Forecast, by Usage 2019 & 2032
- Table 7: Global Contact Lenses Market Revenue Million Forecast, by Modality 2019 & 2032
- Table 8: Global Contact Lenses Market Volume K Unit Forecast, by Modality 2019 & 2032
- Table 9: Global Contact Lenses Market Revenue Million Forecast, by Design 2019 & 2032
- Table 10: Global Contact Lenses Market Volume K Unit Forecast, by Design 2019 & 2032
- Table 11: Global Contact Lenses Market Revenue Million Forecast, by Region 2019 & 2032
- Table 12: Global Contact Lenses Market Volume K Unit Forecast, by Region 2019 & 2032
- Table 13: Global Contact Lenses Market Revenue Million Forecast, by Country 2019 & 2032
- Table 14: Global Contact Lenses Market Volume K Unit Forecast, by Country 2019 & 2032
- Table 15: United States Contact Lenses Market Revenue (Million) Forecast, by Application 2019 & 2032
- Table 16: United States Contact Lenses Market Volume (K Unit) Forecast, by Application 2019 & 2032
- Table 17: Canada Contact Lenses Market Revenue (Million) Forecast, by Application 2019 & 2032
- Table 18: Canada Contact Lenses Market Volume (K Unit) Forecast, by Application 2019 & 2032
- Table 19: Mexico Contact Lenses Market Revenue (Million) Forecast, by Application 2019 & 2032
- Table 20: Mexico Contact Lenses Market Volume (K Unit) Forecast, by Application 2019 & 2032
- Table 21: Global Contact Lenses Market Revenue Million Forecast, by Country 2019 & 2032
- Table 22: Global Contact Lenses Market Volume K Unit Forecast, by Country 2019 & 2032
- Table 23: United Kingdom Contact Lenses Market Revenue (Million) Forecast, by Application 2019 & 2032
- Table 24: United Kingdom Contact Lenses Market Volume (K Unit) Forecast, by Application 2019 & 2032
- Table 25: Germany Contact Lenses Market Revenue (Million) Forecast, by Application 2019 & 2032
- Table 26: Germany Contact Lenses Market Volume (K Unit) Forecast, by Application 2019 & 2032
- Table 27: France Contact Lenses Market Revenue (Million) Forecast, by Application 2019 & 2032
- Table 28: France Contact Lenses Market Volume (K Unit) Forecast, by Application 2019 & 2032
- Table 29: Italy Contact Lenses Market Revenue (Million) Forecast, by Application 2019 & 2032
- Table 30: Italy Contact Lenses Market Volume (K Unit) Forecast, by Application 2019 & 2032
- Table 31: Spain Contact Lenses Market Revenue (Million) Forecast, by Application 2019 & 2032
- Table 32: Spain Contact Lenses Market Volume (K Unit) Forecast, by Application 2019 & 2032
- Table 33: Rest of Europe Contact Lenses Market Revenue (Million) Forecast, by Application 2019 & 2032
- Table 34: Rest of Europe Contact Lenses Market Volume (K Unit) Forecast, by Application 2019 & 2032
- Table 35: Global Contact Lenses Market Revenue Million Forecast, by Country 2019 & 2032
- Table 36: Global Contact Lenses Market Volume K Unit Forecast, by Country 2019 & 2032
- Table 37: China Contact Lenses Market Revenue (Million) Forecast, by Application 2019 & 2032
- Table 38: China Contact Lenses Market Volume (K Unit) Forecast, by Application 2019 & 2032
- Table 39: Japan Contact Lenses Market Revenue (Million) Forecast, by Application 2019 & 2032
- Table 40: Japan Contact Lenses Market Volume (K Unit) Forecast, by Application 2019 & 2032
- Table 41: India Contact Lenses Market Revenue (Million) Forecast, by Application 2019 & 2032
- Table 42: India Contact Lenses Market Volume (K Unit) Forecast, by Application 2019 & 2032
- Table 43: Australia Contact Lenses Market Revenue (Million) Forecast, by Application 2019 & 2032
- Table 44: Australia Contact Lenses Market Volume (K Unit) Forecast, by Application 2019 & 2032
- Table 45: South Korea Contact Lenses Market Revenue (Million) Forecast, by Application 2019 & 2032
- Table 46: South Korea Contact Lenses Market Volume (K Unit) Forecast, by Application 2019 & 2032
- Table 47: Rest of Asia Pacific Contact Lenses Market Revenue (Million) Forecast, by Application 2019 & 2032
- Table 48: Rest of Asia Pacific Contact Lenses Market Volume (K Unit) Forecast, by Application 2019 & 2032
- Table 49: Global Contact Lenses Market Revenue Million Forecast, by Country 2019 & 2032
- Table 50: Global Contact Lenses Market Volume K Unit Forecast, by Country 2019 & 2032
- Table 51: GCC Contact Lenses Market Revenue (Million) Forecast, by Application 2019 & 2032
- Table 52: GCC Contact Lenses Market Volume (K Unit) Forecast, by Application 2019 & 2032
- Table 53: South Africa Contact Lenses Market Revenue (Million) Forecast, by Application 2019 & 2032
- Table 54: South Africa Contact Lenses Market Volume (K Unit) Forecast, by Application 2019 & 2032
- Table 55: Rest of Middle East and Africa Contact Lenses Market Revenue (Million) Forecast, by Application 2019 & 2032
- Table 56: Rest of Middle East and Africa Contact Lenses Market Volume (K Unit) Forecast, by Application 2019 & 2032
- Table 57: Global Contact Lenses Market Revenue Million Forecast, by Country 2019 & 2032
- Table 58: Global Contact Lenses Market Volume K Unit Forecast, by Country 2019 & 2032
- Table 59: Brazil Contact Lenses Market Revenue (Million) Forecast, by Application 2019 & 2032
- Table 60: Brazil Contact Lenses Market Volume (K Unit) Forecast, by Application 2019 & 2032
- Table 61: Argentina Contact Lenses Market Revenue (Million) Forecast, by Application 2019 & 2032
- Table 62: Argentina Contact Lenses Market Volume (K Unit) Forecast, by Application 2019 & 2032
- Table 63: Rest of South America Contact Lenses Market Revenue (Million) Forecast, by Application 2019 & 2032
- Table 64: Rest of South America Contact Lenses Market Volume (K Unit) Forecast, by Application 2019 & 2032
- Table 65: Global Contact Lenses Market Revenue Million Forecast, by Product Type 2019 & 2032
- Table 66: Global Contact Lenses Market Volume K Unit Forecast, by Product Type 2019 & 2032
- Table 67: Global Contact Lenses Market Revenue Million Forecast, by Usage 2019 & 2032
- Table 68: Global Contact Lenses Market Volume K Unit Forecast, by Usage 2019 & 2032
- Table 69: Global Contact Lenses Market Revenue Million Forecast, by Modality 2019 & 2032
- Table 70: Global Contact Lenses Market Volume K Unit Forecast, by Modality 2019 & 2032
- Table 71: Global Contact Lenses Market Revenue Million Forecast, by Design 2019 & 2032
- Table 72: Global Contact Lenses Market Volume K Unit Forecast, by Design 2019 & 2032
- Table 73: Global Contact Lenses Market Revenue Million Forecast, by Country 2019 & 2032
- Table 74: Global Contact Lenses Market Volume K Unit Forecast, by Country 2019 & 2032
- Table 75: United States Contact Lenses Market Revenue (Million) Forecast, by Application 2019 & 2032
- Table 76: United States Contact Lenses Market Volume (K Unit) Forecast, by Application 2019 & 2032
- Table 77: Canada Contact Lenses Market Revenue (Million) Forecast, by Application 2019 & 2032
- Table 78: Canada Contact Lenses Market Volume (K Unit) Forecast, by Application 2019 & 2032
- Table 79: Mexico Contact Lenses Market Revenue (Million) Forecast, by Application 2019 & 2032
- Table 80: Mexico Contact Lenses Market Volume (K Unit) Forecast, by Application 2019 & 2032
- Table 81: Global Contact Lenses Market Revenue Million Forecast, by Product Type 2019 & 2032
- Table 82: Global Contact Lenses Market Volume K Unit Forecast, by Product Type 2019 & 2032
- Table 83: Global Contact Lenses Market Revenue Million Forecast, by Usage 2019 & 2032
- Table 84: Global Contact Lenses Market Volume K Unit Forecast, by Usage 2019 & 2032
- Table 85: Global Contact Lenses Market Revenue Million Forecast, by Modality 2019 & 2032
- Table 86: Global Contact Lenses Market Volume K Unit Forecast, by Modality 2019 & 2032
- Table 87: Global Contact Lenses Market Revenue Million Forecast, by Design 2019 & 2032
- Table 88: Global Contact Lenses Market Volume K Unit Forecast, by Design 2019 & 2032
- Table 89: Global Contact Lenses Market Revenue Million Forecast, by Country 2019 & 2032
- Table 90: Global Contact Lenses Market Volume K Unit Forecast, by Country 2019 & 2032
- Table 91: United Kingdom Contact Lenses Market Revenue (Million) Forecast, by Application 2019 & 2032
- Table 92: United Kingdom Contact Lenses Market Volume (K Unit) Forecast, by Application 2019 & 2032
- Table 93: Germany Contact Lenses Market Revenue (Million) Forecast, by Application 2019 & 2032
- Table 94: Germany Contact Lenses Market Volume (K Unit) Forecast, by Application 2019 & 2032
- Table 95: France Contact Lenses Market Revenue (Million) Forecast, by Application 2019 & 2032
- Table 96: France Contact Lenses Market Volume (K Unit) Forecast, by Application 2019 & 2032
- Table 97: Italy Contact Lenses Market Revenue (Million) Forecast, by Application 2019 & 2032
- Table 98: Italy Contact Lenses Market Volume (K Unit) Forecast, by Application 2019 & 2032
- Table 99: Spain Contact Lenses Market Revenue (Million) Forecast, by Application 2019 & 2032
- Table 100: Spain Contact Lenses Market Volume (K Unit) Forecast, by Application 2019 & 2032
- Table 101: Rest of Europe Contact Lenses Market Revenue (Million) Forecast, by Application 2019 & 2032
- Table 102: Rest of Europe Contact Lenses Market Volume (K Unit) Forecast, by Application 2019 & 2032
- Table 103: Global Contact Lenses Market Revenue Million Forecast, by Product Type 2019 & 2032
- Table 104: Global Contact Lenses Market Volume K Unit Forecast, by Product Type 2019 & 2032
- Table 105: Global Contact Lenses Market Revenue Million Forecast, by Usage 2019 & 2032
- Table 106: Global Contact Lenses Market Volume K Unit Forecast, by Usage 2019 & 2032
- Table 107: Global Contact Lenses Market Revenue Million Forecast, by Modality 2019 & 2032
- Table 108: Global Contact Lenses Market Volume K Unit Forecast, by Modality 2019 & 2032
- Table 109: Global Contact Lenses Market Revenue Million Forecast, by Design 2019 & 2032
- Table 110: Global Contact Lenses Market Volume K Unit Forecast, by Design 2019 & 2032
- Table 111: Global Contact Lenses Market Revenue Million Forecast, by Country 2019 & 2032
- Table 112: Global Contact Lenses Market Volume K Unit Forecast, by Country 2019 & 2032
- Table 113: China Contact Lenses Market Revenue (Million) Forecast, by Application 2019 & 2032
- Table 114: China Contact Lenses Market Volume (K Unit) Forecast, by Application 2019 & 2032
- Table 115: Japan Contact Lenses Market Revenue (Million) Forecast, by Application 2019 & 2032
- Table 116: Japan Contact Lenses Market Volume (K Unit) Forecast, by Application 2019 & 2032
- Table 117: India Contact Lenses Market Revenue (Million) Forecast, by Application 2019 & 2032
- Table 118: India Contact Lenses Market Volume (K Unit) Forecast, by Application 2019 & 2032
- Table 119: Australia Contact Lenses Market Revenue (Million) Forecast, by Application 2019 & 2032
- Table 120: Australia Contact Lenses Market Volume (K Unit) Forecast, by Application 2019 & 2032
- Table 121: South Korea Contact Lenses Market Revenue (Million) Forecast, by Application 2019 & 2032
- Table 122: South Korea Contact Lenses Market Volume (K Unit) Forecast, by Application 2019 & 2032
- Table 123: Rest of Asia Pacific Contact Lenses Market Revenue (Million) Forecast, by Application 2019 & 2032
- Table 124: Rest of Asia Pacific Contact Lenses Market Volume (K Unit) Forecast, by Application 2019 & 2032
- Table 125: Global Contact Lenses Market Revenue Million Forecast, by Product Type 2019 & 2032
- Table 126: Global Contact Lenses Market Volume K Unit Forecast, by Product Type 2019 & 2032
- Table 127: Global Contact Lenses Market Revenue Million Forecast, by Usage 2019 & 2032
- Table 128: Global Contact Lenses Market Volume K Unit Forecast, by Usage 2019 & 2032
- Table 129: Global Contact Lenses Market Revenue Million Forecast, by Modality 2019 & 2032
- Table 130: Global Contact Lenses Market Volume K Unit Forecast, by Modality 2019 & 2032
- Table 131: Global Contact Lenses Market Revenue Million Forecast, by Design 2019 & 2032
- Table 132: Global Contact Lenses Market Volume K Unit Forecast, by Design 2019 & 2032
- Table 133: Global Contact Lenses Market Revenue Million Forecast, by Country 2019 & 2032
- Table 134: Global Contact Lenses Market Volume K Unit Forecast, by Country 2019 & 2032
- Table 135: GCC Contact Lenses Market Revenue (Million) Forecast, by Application 2019 & 2032
- Table 136: GCC Contact Lenses Market Volume (K Unit) Forecast, by Application 2019 & 2032
- Table 137: South Africa Contact Lenses Market Revenue (Million) Forecast, by Application 2019 & 2032
- Table 138: South Africa Contact Lenses Market Volume (K Unit) Forecast, by Application 2019 & 2032
- Table 139: Rest of Middle East and Africa Contact Lenses Market Revenue (Million) Forecast, by Application 2019 & 2032
- Table 140: Rest of Middle East and Africa Contact Lenses Market Volume (K Unit) Forecast, by Application 2019 & 2032
- Table 141: Global Contact Lenses Market Revenue Million Forecast, by Product Type 2019 & 2032
- Table 142: Global Contact Lenses Market Volume K Unit Forecast, by Product Type 2019 & 2032
- Table 143: Global Contact Lenses Market Revenue Million Forecast, by Usage 2019 & 2032
- Table 144: Global Contact Lenses Market Volume K Unit Forecast, by Usage 2019 & 2032
- Table 145: Global Contact Lenses Market Revenue Million Forecast, by Modality 2019 & 2032
- Table 146: Global Contact Lenses Market Volume K Unit Forecast, by Modality 2019 & 2032
- Table 147: Global Contact Lenses Market Revenue Million Forecast, by Design 2019 & 2032
- Table 148: Global Contact Lenses Market Volume K Unit Forecast, by Design 2019 & 2032
- Table 149: Global Contact Lenses Market Revenue Million Forecast, by Country 2019 & 2032
- Table 150: Global Contact Lenses Market Volume K Unit Forecast, by Country 2019 & 2032
- Table 151: Brazil Contact Lenses Market Revenue (Million) Forecast, by Application 2019 & 2032
- Table 152: Brazil Contact Lenses Market Volume (K Unit) Forecast, by Application 2019 & 2032
- Table 153: Argentina Contact Lenses Market Revenue (Million) Forecast, by Application 2019 & 2032
- Table 154: Argentina Contact Lenses Market Volume (K Unit) Forecast, by Application 2019 & 2032
- Table 155: Rest of South America Contact Lenses Market Revenue (Million) Forecast, by Application 2019 & 2032
- Table 156: Rest of South America Contact Lenses Market Volume (K Unit) Forecast, by Application 2019 & 2032
Frequently Asked Questions
1. What is the projected Compound Annual Growth Rate (CAGR) of the Contact Lenses Market?
The projected CAGR is approximately 3.66%.
2. Which companies are prominent players in the Contact Lenses Market?
Key companies in the market include Eyemera INC, Essilor International SA, The Cooper Companies, Alcon Vision LLC, SynergEyes Inc, Menicon Co Ltd, Zeiss Group, Johnson & Johnson Vision Care Inc, Seed Co Ltd, Bausch Health Companies Inc, Hoya Corporation.
3. What are the main segments of the Contact Lenses Market?
The market segments include Product Type, Usage, Modality, Design.
4. Can you provide details about the market size?
The market size is estimated to be USD 10.23 Million as of 2022.
5. What are some drivers contributing to market growth?
Increasing Burden of Optical Disorders; Increasing Tendency to Enhance Aesthetics.
6. What are the notable trends driving market growth?
Corrective Contact Lenses are Expected to Register a Significant Growth Rate over the Forecast Period.
7. Are there any restraints impacting market growth?
Availability of Alternative Techniques and Complications Associated with Lenses4.3.2.
8. Can you provide examples of recent developments in the market?
June 2022: Johnson & Johnson Vision, a part of Johnson & Johnson MedTech, received FDA clearance for its latest contact lens innovation, ACUVUE OASYS MAX 1-Day and ACUVUE OASYS MAX 1-Day MULTIFOCAL.
9. What pricing options are available for accessing the report?
Pricing options include single-user, multi-user, and enterprise licenses priced at USD 4750, USD 5250, and USD 8750 respectively.
10. Is the market size provided in terms of value or volume?
The market size is provided in terms of value, measured in Million and volume, measured in K Unit.
11. Are there any specific market keywords associated with the report?
Yes, the market keyword associated with the report is "Contact Lenses Market," which aids in identifying and referencing the specific market segment covered.
12. How do I determine which pricing option suits my needs best?
The pricing options vary based on user requirements and access needs. Individual users may opt for single-user licenses, while businesses requiring broader access may choose multi-user or enterprise licenses for cost-effective access to the report.
13. Are there any additional resources or data provided in the Contact Lenses Market report?
While the report offers comprehensive insights, it's advisable to review the specific contents or supplementary materials provided to ascertain if additional resources or data are available.
14. How can I stay updated on further developments or reports in the Contact Lenses Market?
To stay informed about further developments, trends, and reports in the Contact Lenses Market, consider subscribing to industry newsletters, following relevant companies and organizations, or regularly checking reputable industry news sources and publications.
Methodology
Step 1 - Identification of Relevant Samples Size from Population Database


Step 2 - Approaches for Defining Global Market Size (Value, Volume* & Price*)

Note*: In applicable scenarios
Step 3 - Data Sources
Primary Research
- Web Analytics
- Survey Reports
- Research Institute
- Latest Research Reports
- Opinion Leaders
Secondary Research
- Annual Reports
- White Paper
- Latest Press Release
- Industry Association
- Paid Database
- Investor Presentations

Step 4 - Data Triangulation
Involves using different sources of information in order to increase the validity of a study
These sources are likely to be stakeholders in a program - participants, other researchers, program staff, other community members, and so on.
Then we put all data in single framework & apply various statistical tools to find out the dynamic on the market.
During the analysis stage, feedback from the stakeholder groups would be compared to determine areas of agreement as well as areas of divergence
