

Key Insights
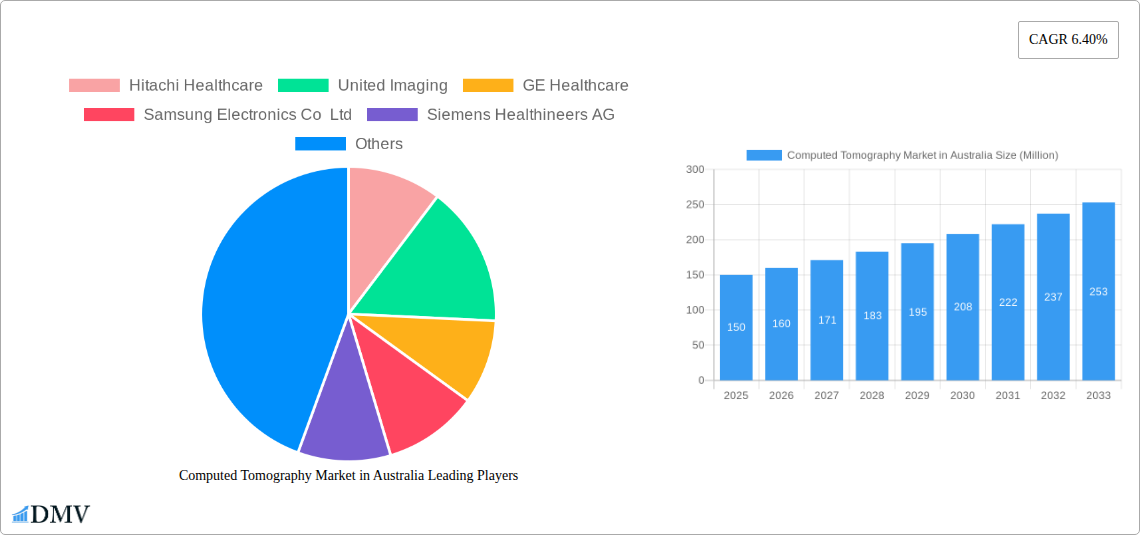
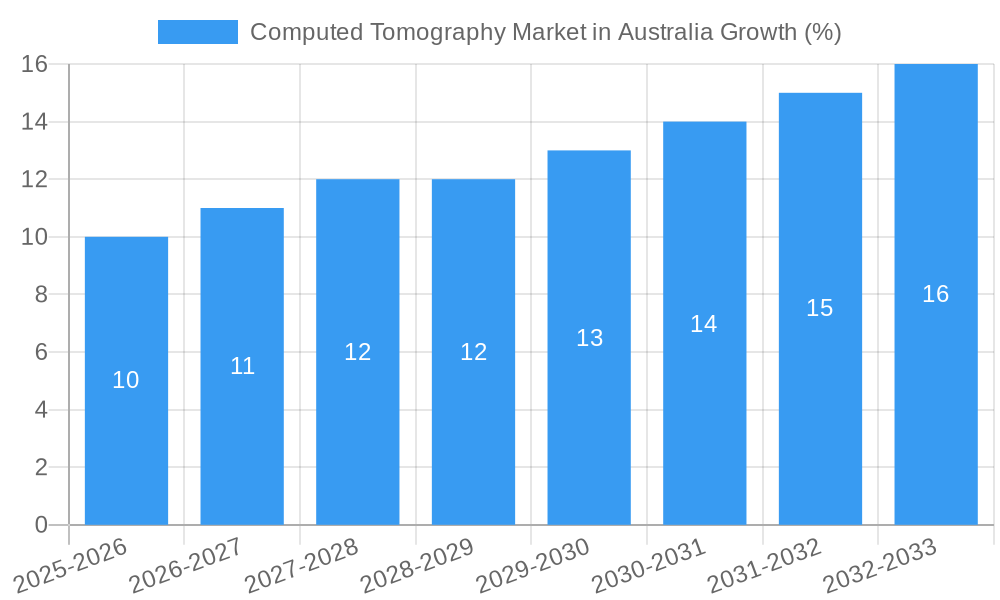
The Australian computed tomography (CT) market, valued at approximately $150 million in 2025, is projected to experience robust growth, driven by factors such as rising prevalence of chronic diseases necessitating advanced diagnostic imaging, technological advancements leading to faster scan times and improved image quality, and increasing government investments in healthcare infrastructure. The market's Compound Annual Growth Rate (CAGR) of 6.40% from 2025 to 2033 indicates a significant expansion, with the market size expected to surpass $250 million by 2033. Key segments driving this growth include oncology and cardiology applications due to the high demand for precise CT scans in cancer detection and cardiovascular disease diagnosis. Hospitals and diagnostic centers constitute the major end-users, reflecting the established infrastructure for CT scans within these facilities. While the high-slice CT segment commands a premium, the medium-slice segment is expected to witness substantial growth due to its balance between cost-effectiveness and diagnostic capabilities. Competition among key players, including Hitachi Healthcare, GE Healthcare, and Siemens Healthineers, is fostering innovation and driving down costs, making CT scans more accessible. However, market growth may be slightly restrained by the high initial investment costs associated with CT scanners and the ongoing need for skilled technicians to operate and interpret the complex image data.
The continued technological advancements in CT technology, such as multi-slice scanners and AI-powered image analysis, will further propel market expansion. Growing awareness regarding early disease detection and preventative healthcare measures among the Australian population contributes positively to the market's outlook. Furthermore, the increasing adoption of minimally invasive procedures, guided by CT imaging, supports the market's continuous growth trajectory. The increasing aging population in Australia, coupled with a higher prevalence of age-related diseases, significantly increases the demand for diagnostic imaging services, particularly CT scans. While regulatory hurdles and stringent safety standards might pose some challenges, the overall market outlook for CT scanners in Australia remains positive, indicating substantial opportunities for market participants in the coming years.
Computed Tomography (CT) Market in Australia: A Comprehensive Report (2019-2033)
This insightful report provides a detailed analysis of the Computed Tomography (CT) market in Australia, offering a comprehensive overview of market dynamics, growth drivers, challenges, and future opportunities from 2019 to 2033. The report leverages extensive market research to provide crucial data for stakeholders across the healthcare sector, including manufacturers, distributors, hospitals, and investors. With a base year of 2025 and a forecast period spanning 2025-2033, this report offers invaluable insights for strategic decision-making. The market size is expected to reach xx Million by 2033.
Computed Tomography Market in Australia Market Composition & Trends
The Australian CT market exhibits a moderately consolidated structure, with key players like GE Healthcare, Siemens Healthineers AG, Hitachi Healthcare, and Koninklijke Philips NV holding significant market share. However, the market is witnessing increased competition from emerging players like United Imaging and Samsung Electronics Co Ltd, driving innovation and price competitiveness. The market's growth is fueled by rising prevalence of chronic diseases, advancements in CT technology (e.g., multi-slice CT scanners), increasing government funding for healthcare infrastructure, and a growing emphasis on early disease detection.
Regulatory landscapes, including those governed by the Therapeutic Goods Administration (TGA), play a crucial role in shaping market access and adoption of new technologies. Substitute products, such as MRI and ultrasound, pose some competitive pressure; however, CT's advantages in speed, cost-effectiveness, and detailed imaging for certain applications maintain its dominance. M&A activities within the sector have been relatively modest in recent years, with deal values averaging approximately xx Million annually. However, increased consolidation is anticipated as larger companies seek to expand their market presence and product portfolios.
- Market Share Distribution (2024): GE Healthcare (25%), Siemens Healthineers (20%), Hitachi Healthcare (15%), Philips (12%), Others (28%)
- M&A Deal Value (2019-2024): Average xx Million annually
Computed Tomography Market in Australia Industry Evolution
The Australian CT market has exhibited steady growth over the historical period (2019-2024), with a Compound Annual Growth Rate (CAGR) of xx%. This growth is projected to continue throughout the forecast period (2025-2033), albeit at a potentially moderated rate, reaching a projected CAGR of xx%. Technological advancements, such as the development of multi-slice CT scanners with improved image quality, faster scan times, and lower radiation doses, are major drivers of this growth. Furthermore, the increasing adoption of advanced image reconstruction techniques, such as iterative reconstruction, is enhancing diagnostic accuracy and patient care.
Consumer demand is shifting towards higher-resolution imaging and minimally invasive procedures, pushing manufacturers to develop innovative CT solutions that address these needs. The growing preference for mobile CT units, as evidenced by recent initiatives like the Heart of Australia mobile clinic, highlights the evolving demand for accessible and convenient diagnostic services, especially in remote areas. Government initiatives focusing on improving healthcare infrastructure and access to advanced medical technologies further contribute to market growth. The rising prevalence of cardiovascular diseases, cancer, and musculoskeletal disorders significantly drives the demand for CT scans across various medical specialties. Adoption of CT scans has increased by an estimated xx% in the last 5 years, primarily in hospitals and diagnostic centers.
Leading Regions, Countries, or Segments in Computed Tomography Market in Australia
The Australian CT market is geographically diverse, with significant demand across major metropolitan areas and regional centers. However, growth is particularly strong in major cities like Sydney and Melbourne due to a higher concentration of hospitals, diagnostic centers, and specialized medical facilities.
By application, Oncology dominates the market, driven by the high prevalence of cancer and the critical role of CT in cancer diagnosis and staging. Neurology and Cardiovascular applications also represent significant market segments.
- Key Drivers for Oncology Segment: Increased cancer incidence rates, improved diagnostic accuracy compared to other imaging modalities, and use in radiation therapy planning.
- Key Drivers for Hospitals Segment: Increased patient volume, growing demand for advanced diagnostic capabilities, and government investment in hospital infrastructure upgrades.
- Key Drivers for High-Slice CT Segment: Enhanced image quality, improved diagnostic accuracy, and ability to perform faster scans.
The High Slice CT segment demonstrates the strongest growth, driven by the need for higher resolution images for complex diagnoses and minimally invasive procedures. Hospitals represent the largest end-user segment, followed by diagnostic imaging centers.
Computed Tomography Market in Australia Product Innovations
Recent product innovations in the Australian CT market include the introduction of dual-energy CT scanners, which enable simultaneous imaging at two different energy levels, enhancing the accuracy of material differentiation and diagnostic capabilities. Advances in iterative reconstruction algorithms improve image quality while reducing radiation dose. Furthermore, the development of more compact and portable CT scanners is expanding access to CT services, particularly in remote and underserved areas. These innovations boast unique selling propositions such as enhanced image clarity, reduced scan times, and lower radiation exposure, all contributing to improved patient outcomes and operational efficiency.
Propelling Factors for Computed Tomography Market in Australia Growth
Several factors propel the growth of the Australian CT market. Technological advancements, such as the development of multi-slice CT scanners with superior image quality and faster scan times, are a primary driver. Increased government funding for healthcare infrastructure, as evidenced by the USD 17.2 Million commitment to mobile health clinics in 2022, is also significantly contributing to market expansion. The rising prevalence of chronic diseases, such as cancer and cardiovascular diseases, increases the demand for CT scans for diagnosis and treatment planning. Finally, favorable regulatory environments facilitating the adoption of new technologies further support market growth.
Obstacles in the Computed Tomography Market in Australia Market
Despite the positive growth trajectory, the Australian CT market faces certain challenges. High costs associated with purchasing and maintaining advanced CT equipment can be a barrier to entry for smaller healthcare facilities. Supply chain disruptions, particularly impacting the availability of specialized components, can also impede market growth. Furthermore, intense competition among established players and emerging entrants creates pressure on pricing and profitability. Regulatory hurdles and stringent approval processes for new technologies can also delay market penetration. These factors combined can reduce the overall market expansion rate by an estimated xx% annually.
Future Opportunities in Computed Tomography Market in Australia
Future opportunities in the Australian CT market lie in the expansion of mobile CT services to underserved areas, leveraging technological advancements to improve access to diagnostic imaging. The increasing adoption of AI-powered image analysis tools offers potential for enhanced diagnostic accuracy and workflow efficiency. Furthermore, the growing demand for minimally invasive procedures will drive innovation in CT-guided interventions. Finally, exploring new applications of CT technology beyond traditional diagnostic imaging, such as in radiation therapy planning and treatment monitoring, present substantial growth opportunities.
Major Players in the Computed Tomography Market in Australia Ecosystem
- Hitachi Healthcare
- United Imaging
- GE Healthcare
- Samsung Electronics Co Ltd
- Siemens Healthineers AG
- Carestream Health
- Koninklijke Philips NV
- J Morita Corporation
- Neusoft Medical Systems
- Planmeca Group (Planmed OY)
Key Developments in Computed Tomography Market in Australia Industry
- May 2023: Launch of mobile radiography clinic utilizing Philips' 128-slice Incisive CT Pro scanner within the Heart of Australia truck, expanding access to lung screenings for Australian minors.
- April 2022: USD 17.2 Million funding commitment from the Federal Government to expand mobile health clinic services, including CT and X-ray imaging. This significantly boosted the accessibility of CT services across various medical specialties.
Strategic Computed Tomography Market in Australia Market Forecast
The Australian CT market is poised for continued growth, driven by technological advancements, increasing healthcare spending, and the rising prevalence of chronic diseases. Future opportunities lie in the expansion of mobile CT units, adoption of AI-powered image analysis, and exploration of new clinical applications. This positive outlook suggests a robust market expansion in the coming years, with the potential for significant growth and increased market value, ultimately contributing to improved patient care and healthcare outcomes across Australia.
Computed Tomography Market in Australia Segmentation
-
1. Type
- 1.1. Low Slice
- 1.2. Medium Slice
- 1.3. High Slice
-
2. Application
- 2.1. Oncology
- 2.2. Neurology
- 2.3. Cardiovascular
- 2.4. Musculoskeletal
- 2.5. Other Applications
-
3. End User
- 3.1. Hospitals
- 3.2. Diagnostic Centers
- 3.3. Other End Users
Computed Tomography Market in Australia Segmentation By Geography
-
1. North America
- 1.1. United States
- 1.2. Canada
- 1.3. Mexico
-
2. South America
- 2.1. Brazil
- 2.2. Argentina
- 2.3. Rest of South America
-
3. Europe
- 3.1. United Kingdom
- 3.2. Germany
- 3.3. France
- 3.4. Italy
- 3.5. Spain
- 3.6. Russia
- 3.7. Benelux
- 3.8. Nordics
- 3.9. Rest of Europe
-
4. Middle East & Africa
- 4.1. Turkey
- 4.2. Israel
- 4.3. GCC
- 4.4. North Africa
- 4.5. South Africa
- 4.6. Rest of Middle East & Africa
-
5. Asia Pacific
- 5.1. China
- 5.2. India
- 5.3. Japan
- 5.4. South Korea
- 5.5. ASEAN
- 5.6. Oceania
- 5.7. Rest of Asia Pacific
Computed Tomography Market in Australia REPORT HIGHLIGHTS
| Aspects | Details |
|---|---|
| Study Period | 2019-2033 |
| Base Year | 2024 |
| Estimated Year | 2025 |
| Forecast Period | 2025-2033 |
| Historical Period | 2019-2024 |
| Growth Rate | CAGR of 6.40% from 2019-2033 |
| Segmentation |
|
Table of Contents
- 1. Introduction
- 1.1. Research Scope
- 1.2. Market Segmentation
- 1.3. Research Methodology
- 1.4. Definitions and Assumptions
- 2. Executive Summary
- 2.1. Introduction
- 3. Market Dynamics
- 3.1. Introduction
- 3.2. Market Drivers
- 3.2.1. Increasing Prevalence of Chronic Diseases and Rising Geriatric Population; Technological Advancement and Investment in Healthcare Facilities
- 3.3. Market Restrains
- 3.3.1. Lack of Proper Reimbursement and Stringent Regulatory Approval Procedures; High Cost of Equipment
- 3.4. Market Trends
- 3.4.1. Hospitals Segment is Expected to Hold a Significant Market Share Over the Forecast Period
- 4. Market Factor Analysis
- 4.1. Porters Five Forces
- 4.2. Supply/Value Chain
- 4.3. PESTEL analysis
- 4.4. Market Entropy
- 4.5. Patent/Trademark Analysis
- 5. Global Computed Tomography Market in Australia Analysis, Insights and Forecast, 2019-2031
- 5.1. Market Analysis, Insights and Forecast - by Type
- 5.1.1. Low Slice
- 5.1.2. Medium Slice
- 5.1.3. High Slice
- 5.2. Market Analysis, Insights and Forecast - by Application
- 5.2.1. Oncology
- 5.2.2. Neurology
- 5.2.3. Cardiovascular
- 5.2.4. Musculoskeletal
- 5.2.5. Other Applications
- 5.3. Market Analysis, Insights and Forecast - by End User
- 5.3.1. Hospitals
- 5.3.2. Diagnostic Centers
- 5.3.3. Other End Users
- 5.4. Market Analysis, Insights and Forecast - by Region
- 5.4.1. North America
- 5.4.2. South America
- 5.4.3. Europe
- 5.4.4. Middle East & Africa
- 5.4.5. Asia Pacific
- 5.1. Market Analysis, Insights and Forecast - by Type
- 6. North America Computed Tomography Market in Australia Analysis, Insights and Forecast, 2019-2031
- 6.1. Market Analysis, Insights and Forecast - by Type
- 6.1.1. Low Slice
- 6.1.2. Medium Slice
- 6.1.3. High Slice
- 6.2. Market Analysis, Insights and Forecast - by Application
- 6.2.1. Oncology
- 6.2.2. Neurology
- 6.2.3. Cardiovascular
- 6.2.4. Musculoskeletal
- 6.2.5. Other Applications
- 6.3. Market Analysis, Insights and Forecast - by End User
- 6.3.1. Hospitals
- 6.3.2. Diagnostic Centers
- 6.3.3. Other End Users
- 6.1. Market Analysis, Insights and Forecast - by Type
- 7. South America Computed Tomography Market in Australia Analysis, Insights and Forecast, 2019-2031
- 7.1. Market Analysis, Insights and Forecast - by Type
- 7.1.1. Low Slice
- 7.1.2. Medium Slice
- 7.1.3. High Slice
- 7.2. Market Analysis, Insights and Forecast - by Application
- 7.2.1. Oncology
- 7.2.2. Neurology
- 7.2.3. Cardiovascular
- 7.2.4. Musculoskeletal
- 7.2.5. Other Applications
- 7.3. Market Analysis, Insights and Forecast - by End User
- 7.3.1. Hospitals
- 7.3.2. Diagnostic Centers
- 7.3.3. Other End Users
- 7.1. Market Analysis, Insights and Forecast - by Type
- 8. Europe Computed Tomography Market in Australia Analysis, Insights and Forecast, 2019-2031
- 8.1. Market Analysis, Insights and Forecast - by Type
- 8.1.1. Low Slice
- 8.1.2. Medium Slice
- 8.1.3. High Slice
- 8.2. Market Analysis, Insights and Forecast - by Application
- 8.2.1. Oncology
- 8.2.2. Neurology
- 8.2.3. Cardiovascular
- 8.2.4. Musculoskeletal
- 8.2.5. Other Applications
- 8.3. Market Analysis, Insights and Forecast - by End User
- 8.3.1. Hospitals
- 8.3.2. Diagnostic Centers
- 8.3.3. Other End Users
- 8.1. Market Analysis, Insights and Forecast - by Type
- 9. Middle East & Africa Computed Tomography Market in Australia Analysis, Insights and Forecast, 2019-2031
- 9.1. Market Analysis, Insights and Forecast - by Type
- 9.1.1. Low Slice
- 9.1.2. Medium Slice
- 9.1.3. High Slice
- 9.2. Market Analysis, Insights and Forecast - by Application
- 9.2.1. Oncology
- 9.2.2. Neurology
- 9.2.3. Cardiovascular
- 9.2.4. Musculoskeletal
- 9.2.5. Other Applications
- 9.3. Market Analysis, Insights and Forecast - by End User
- 9.3.1. Hospitals
- 9.3.2. Diagnostic Centers
- 9.3.3. Other End Users
- 9.1. Market Analysis, Insights and Forecast - by Type
- 10. Asia Pacific Computed Tomography Market in Australia Analysis, Insights and Forecast, 2019-2031
- 10.1. Market Analysis, Insights and Forecast - by Type
- 10.1.1. Low Slice
- 10.1.2. Medium Slice
- 10.1.3. High Slice
- 10.2. Market Analysis, Insights and Forecast - by Application
- 10.2.1. Oncology
- 10.2.2. Neurology
- 10.2.3. Cardiovascular
- 10.2.4. Musculoskeletal
- 10.2.5. Other Applications
- 10.3. Market Analysis, Insights and Forecast - by End User
- 10.3.1. Hospitals
- 10.3.2. Diagnostic Centers
- 10.3.3. Other End Users
- 10.1. Market Analysis, Insights and Forecast - by Type
- 11. Competitive Analysis
- 11.1. Global Market Share Analysis 2024
- 11.2. Company Profiles
- 11.2.1 Hitachi Healthcare
- 11.2.1.1. Overview
- 11.2.1.2. Products
- 11.2.1.3. SWOT Analysis
- 11.2.1.4. Recent Developments
- 11.2.1.5. Financials (Based on Availability)
- 11.2.2 United Imaging
- 11.2.2.1. Overview
- 11.2.2.2. Products
- 11.2.2.3. SWOT Analysis
- 11.2.2.4. Recent Developments
- 11.2.2.5. Financials (Based on Availability)
- 11.2.3 GE Healthcare
- 11.2.3.1. Overview
- 11.2.3.2. Products
- 11.2.3.3. SWOT Analysis
- 11.2.3.4. Recent Developments
- 11.2.3.5. Financials (Based on Availability)
- 11.2.4 Samsung Electronics Co Ltd
- 11.2.4.1. Overview
- 11.2.4.2. Products
- 11.2.4.3. SWOT Analysis
- 11.2.4.4. Recent Developments
- 11.2.4.5. Financials (Based on Availability)
- 11.2.5 Siemens Healthineers AG
- 11.2.5.1. Overview
- 11.2.5.2. Products
- 11.2.5.3. SWOT Analysis
- 11.2.5.4. Recent Developments
- 11.2.5.5. Financials (Based on Availability)
- 11.2.6 Carestream Health
- 11.2.6.1. Overview
- 11.2.6.2. Products
- 11.2.6.3. SWOT Analysis
- 11.2.6.4. Recent Developments
- 11.2.6.5. Financials (Based on Availability)
- 11.2.7 Koninklijke Philips NV
- 11.2.7.1. Overview
- 11.2.7.2. Products
- 11.2.7.3. SWOT Analysis
- 11.2.7.4. Recent Developments
- 11.2.7.5. Financials (Based on Availability)
- 11.2.8 J Morita Corporation
- 11.2.8.1. Overview
- 11.2.8.2. Products
- 11.2.8.3. SWOT Analysis
- 11.2.8.4. Recent Developments
- 11.2.8.5. Financials (Based on Availability)
- 11.2.9 Neusoft Medical Systems*List Not Exhaustive
- 11.2.9.1. Overview
- 11.2.9.2. Products
- 11.2.9.3. SWOT Analysis
- 11.2.9.4. Recent Developments
- 11.2.9.5. Financials (Based on Availability)
- 11.2.10 Planmeca Group (Planmed OY)
- 11.2.10.1. Overview
- 11.2.10.2. Products
- 11.2.10.3. SWOT Analysis
- 11.2.10.4. Recent Developments
- 11.2.10.5. Financials (Based on Availability)
- 11.2.1 Hitachi Healthcare
List of Figures
- Figure 1: Global Computed Tomography Market in Australia Revenue Breakdown (Million, %) by Region 2024 & 2032
- Figure 2: Australia Computed Tomography Market in Australia Revenue (Million), by Country 2024 & 2032
- Figure 3: Australia Computed Tomography Market in Australia Revenue Share (%), by Country 2024 & 2032
- Figure 4: North America Computed Tomography Market in Australia Revenue (Million), by Type 2024 & 2032
- Figure 5: North America Computed Tomography Market in Australia Revenue Share (%), by Type 2024 & 2032
- Figure 6: North America Computed Tomography Market in Australia Revenue (Million), by Application 2024 & 2032
- Figure 7: North America Computed Tomography Market in Australia Revenue Share (%), by Application 2024 & 2032
- Figure 8: North America Computed Tomography Market in Australia Revenue (Million), by End User 2024 & 2032
- Figure 9: North America Computed Tomography Market in Australia Revenue Share (%), by End User 2024 & 2032
- Figure 10: North America Computed Tomography Market in Australia Revenue (Million), by Country 2024 & 2032
- Figure 11: North America Computed Tomography Market in Australia Revenue Share (%), by Country 2024 & 2032
- Figure 12: South America Computed Tomography Market in Australia Revenue (Million), by Type 2024 & 2032
- Figure 13: South America Computed Tomography Market in Australia Revenue Share (%), by Type 2024 & 2032
- Figure 14: South America Computed Tomography Market in Australia Revenue (Million), by Application 2024 & 2032
- Figure 15: South America Computed Tomography Market in Australia Revenue Share (%), by Application 2024 & 2032
- Figure 16: South America Computed Tomography Market in Australia Revenue (Million), by End User 2024 & 2032
- Figure 17: South America Computed Tomography Market in Australia Revenue Share (%), by End User 2024 & 2032
- Figure 18: South America Computed Tomography Market in Australia Revenue (Million), by Country 2024 & 2032
- Figure 19: South America Computed Tomography Market in Australia Revenue Share (%), by Country 2024 & 2032
- Figure 20: Europe Computed Tomography Market in Australia Revenue (Million), by Type 2024 & 2032
- Figure 21: Europe Computed Tomography Market in Australia Revenue Share (%), by Type 2024 & 2032
- Figure 22: Europe Computed Tomography Market in Australia Revenue (Million), by Application 2024 & 2032
- Figure 23: Europe Computed Tomography Market in Australia Revenue Share (%), by Application 2024 & 2032
- Figure 24: Europe Computed Tomography Market in Australia Revenue (Million), by End User 2024 & 2032
- Figure 25: Europe Computed Tomography Market in Australia Revenue Share (%), by End User 2024 & 2032
- Figure 26: Europe Computed Tomography Market in Australia Revenue (Million), by Country 2024 & 2032
- Figure 27: Europe Computed Tomography Market in Australia Revenue Share (%), by Country 2024 & 2032
- Figure 28: Middle East & Africa Computed Tomography Market in Australia Revenue (Million), by Type 2024 & 2032
- Figure 29: Middle East & Africa Computed Tomography Market in Australia Revenue Share (%), by Type 2024 & 2032
- Figure 30: Middle East & Africa Computed Tomography Market in Australia Revenue (Million), by Application 2024 & 2032
- Figure 31: Middle East & Africa Computed Tomography Market in Australia Revenue Share (%), by Application 2024 & 2032
- Figure 32: Middle East & Africa Computed Tomography Market in Australia Revenue (Million), by End User 2024 & 2032
- Figure 33: Middle East & Africa Computed Tomography Market in Australia Revenue Share (%), by End User 2024 & 2032
- Figure 34: Middle East & Africa Computed Tomography Market in Australia Revenue (Million), by Country 2024 & 2032
- Figure 35: Middle East & Africa Computed Tomography Market in Australia Revenue Share (%), by Country 2024 & 2032
- Figure 36: Asia Pacific Computed Tomography Market in Australia Revenue (Million), by Type 2024 & 2032
- Figure 37: Asia Pacific Computed Tomography Market in Australia Revenue Share (%), by Type 2024 & 2032
- Figure 38: Asia Pacific Computed Tomography Market in Australia Revenue (Million), by Application 2024 & 2032
- Figure 39: Asia Pacific Computed Tomography Market in Australia Revenue Share (%), by Application 2024 & 2032
- Figure 40: Asia Pacific Computed Tomography Market in Australia Revenue (Million), by End User 2024 & 2032
- Figure 41: Asia Pacific Computed Tomography Market in Australia Revenue Share (%), by End User 2024 & 2032
- Figure 42: Asia Pacific Computed Tomography Market in Australia Revenue (Million), by Country 2024 & 2032
- Figure 43: Asia Pacific Computed Tomography Market in Australia Revenue Share (%), by Country 2024 & 2032
List of Tables
- Table 1: Global Computed Tomography Market in Australia Revenue Million Forecast, by Region 2019 & 2032
- Table 2: Global Computed Tomography Market in Australia Revenue Million Forecast, by Type 2019 & 2032
- Table 3: Global Computed Tomography Market in Australia Revenue Million Forecast, by Application 2019 & 2032
- Table 4: Global Computed Tomography Market in Australia Revenue Million Forecast, by End User 2019 & 2032
- Table 5: Global Computed Tomography Market in Australia Revenue Million Forecast, by Region 2019 & 2032
- Table 6: Global Computed Tomography Market in Australia Revenue Million Forecast, by Country 2019 & 2032
- Table 7: Global Computed Tomography Market in Australia Revenue Million Forecast, by Type 2019 & 2032
- Table 8: Global Computed Tomography Market in Australia Revenue Million Forecast, by Application 2019 & 2032
- Table 9: Global Computed Tomography Market in Australia Revenue Million Forecast, by End User 2019 & 2032
- Table 10: Global Computed Tomography Market in Australia Revenue Million Forecast, by Country 2019 & 2032
- Table 11: United States Computed Tomography Market in Australia Revenue (Million) Forecast, by Application 2019 & 2032
- Table 12: Canada Computed Tomography Market in Australia Revenue (Million) Forecast, by Application 2019 & 2032
- Table 13: Mexico Computed Tomography Market in Australia Revenue (Million) Forecast, by Application 2019 & 2032
- Table 14: Global Computed Tomography Market in Australia Revenue Million Forecast, by Type 2019 & 2032
- Table 15: Global Computed Tomography Market in Australia Revenue Million Forecast, by Application 2019 & 2032
- Table 16: Global Computed Tomography Market in Australia Revenue Million Forecast, by End User 2019 & 2032
- Table 17: Global Computed Tomography Market in Australia Revenue Million Forecast, by Country 2019 & 2032
- Table 18: Brazil Computed Tomography Market in Australia Revenue (Million) Forecast, by Application 2019 & 2032
- Table 19: Argentina Computed Tomography Market in Australia Revenue (Million) Forecast, by Application 2019 & 2032
- Table 20: Rest of South America Computed Tomography Market in Australia Revenue (Million) Forecast, by Application 2019 & 2032
- Table 21: Global Computed Tomography Market in Australia Revenue Million Forecast, by Type 2019 & 2032
- Table 22: Global Computed Tomography Market in Australia Revenue Million Forecast, by Application 2019 & 2032
- Table 23: Global Computed Tomography Market in Australia Revenue Million Forecast, by End User 2019 & 2032
- Table 24: Global Computed Tomography Market in Australia Revenue Million Forecast, by Country 2019 & 2032
- Table 25: United Kingdom Computed Tomography Market in Australia Revenue (Million) Forecast, by Application 2019 & 2032
- Table 26: Germany Computed Tomography Market in Australia Revenue (Million) Forecast, by Application 2019 & 2032
- Table 27: France Computed Tomography Market in Australia Revenue (Million) Forecast, by Application 2019 & 2032
- Table 28: Italy Computed Tomography Market in Australia Revenue (Million) Forecast, by Application 2019 & 2032
- Table 29: Spain Computed Tomography Market in Australia Revenue (Million) Forecast, by Application 2019 & 2032
- Table 30: Russia Computed Tomography Market in Australia Revenue (Million) Forecast, by Application 2019 & 2032
- Table 31: Benelux Computed Tomography Market in Australia Revenue (Million) Forecast, by Application 2019 & 2032
- Table 32: Nordics Computed Tomography Market in Australia Revenue (Million) Forecast, by Application 2019 & 2032
- Table 33: Rest of Europe Computed Tomography Market in Australia Revenue (Million) Forecast, by Application 2019 & 2032
- Table 34: Global Computed Tomography Market in Australia Revenue Million Forecast, by Type 2019 & 2032
- Table 35: Global Computed Tomography Market in Australia Revenue Million Forecast, by Application 2019 & 2032
- Table 36: Global Computed Tomography Market in Australia Revenue Million Forecast, by End User 2019 & 2032
- Table 37: Global Computed Tomography Market in Australia Revenue Million Forecast, by Country 2019 & 2032
- Table 38: Turkey Computed Tomography Market in Australia Revenue (Million) Forecast, by Application 2019 & 2032
- Table 39: Israel Computed Tomography Market in Australia Revenue (Million) Forecast, by Application 2019 & 2032
- Table 40: GCC Computed Tomography Market in Australia Revenue (Million) Forecast, by Application 2019 & 2032
- Table 41: North Africa Computed Tomography Market in Australia Revenue (Million) Forecast, by Application 2019 & 2032
- Table 42: South Africa Computed Tomography Market in Australia Revenue (Million) Forecast, by Application 2019 & 2032
- Table 43: Rest of Middle East & Africa Computed Tomography Market in Australia Revenue (Million) Forecast, by Application 2019 & 2032
- Table 44: Global Computed Tomography Market in Australia Revenue Million Forecast, by Type 2019 & 2032
- Table 45: Global Computed Tomography Market in Australia Revenue Million Forecast, by Application 2019 & 2032
- Table 46: Global Computed Tomography Market in Australia Revenue Million Forecast, by End User 2019 & 2032
- Table 47: Global Computed Tomography Market in Australia Revenue Million Forecast, by Country 2019 & 2032
- Table 48: China Computed Tomography Market in Australia Revenue (Million) Forecast, by Application 2019 & 2032
- Table 49: India Computed Tomography Market in Australia Revenue (Million) Forecast, by Application 2019 & 2032
- Table 50: Japan Computed Tomography Market in Australia Revenue (Million) Forecast, by Application 2019 & 2032
- Table 51: South Korea Computed Tomography Market in Australia Revenue (Million) Forecast, by Application 2019 & 2032
- Table 52: ASEAN Computed Tomography Market in Australia Revenue (Million) Forecast, by Application 2019 & 2032
- Table 53: Oceania Computed Tomography Market in Australia Revenue (Million) Forecast, by Application 2019 & 2032
- Table 54: Rest of Asia Pacific Computed Tomography Market in Australia Revenue (Million) Forecast, by Application 2019 & 2032
Frequently Asked Questions
1. What is the projected Compound Annual Growth Rate (CAGR) of the Computed Tomography Market in Australia?
The projected CAGR is approximately 6.40%.
2. Which companies are prominent players in the Computed Tomography Market in Australia?
Key companies in the market include Hitachi Healthcare, United Imaging, GE Healthcare, Samsung Electronics Co Ltd, Siemens Healthineers AG, Carestream Health, Koninklijke Philips NV, J Morita Corporation, Neusoft Medical Systems*List Not Exhaustive, Planmeca Group (Planmed OY).
3. What are the main segments of the Computed Tomography Market in Australia?
The market segments include Type, Application, End User.
4. Can you provide details about the market size?
The market size is estimated to be USD XX Million as of 2022.
5. What are some drivers contributing to market growth?
Increasing Prevalence of Chronic Diseases and Rising Geriatric Population; Technological Advancement and Investment in Healthcare Facilities.
6. What are the notable trends driving market growth?
Hospitals Segment is Expected to Hold a Significant Market Share Over the Forecast Period.
7. Are there any restraints impacting market growth?
Lack of Proper Reimbursement and Stringent Regulatory Approval Procedures; High Cost of Equipment.
8. Can you provide examples of recent developments in the market?
In May 2023, the mobile radiography clinic, after four years, reached the Heart of Australia truck, which was launched in February 2022. The truck took the Philips' 128-slice Incisive CT Pro scanner to screen the lungs of Australian minors.
9. What pricing options are available for accessing the report?
Pricing options include single-user, multi-user, and enterprise licenses priced at USD 3800, USD 4500, and USD 5800 respectively.
10. Is the market size provided in terms of value or volume?
The market size is provided in terms of value, measured in Million.
11. Are there any specific market keywords associated with the report?
Yes, the market keyword associated with the report is "Computed Tomography Market in Australia," which aids in identifying and referencing the specific market segment covered.
12. How do I determine which pricing option suits my needs best?
The pricing options vary based on user requirements and access needs. Individual users may opt for single-user licenses, while businesses requiring broader access may choose multi-user or enterprise licenses for cost-effective access to the report.
13. Are there any additional resources or data provided in the Computed Tomography Market in Australia report?
While the report offers comprehensive insights, it's advisable to review the specific contents or supplementary materials provided to ascertain if additional resources or data are available.
14. How can I stay updated on further developments or reports in the Computed Tomography Market in Australia?
To stay informed about further developments, trends, and reports in the Computed Tomography Market in Australia, consider subscribing to industry newsletters, following relevant companies and organizations, or regularly checking reputable industry news sources and publications.
Methodology
Step 1 - Identification of Relevant Samples Size from Population Database


Step 2 - Approaches for Defining Global Market Size (Value, Volume* & Price*)

Note*: In applicable scenarios
Step 3 - Data Sources
Primary Research
- Web Analytics
- Survey Reports
- Research Institute
- Latest Research Reports
- Opinion Leaders
Secondary Research
- Annual Reports
- White Paper
- Latest Press Release
- Industry Association
- Paid Database
- Investor Presentations

Step 4 - Data Triangulation
Involves using different sources of information in order to increase the validity of a study
These sources are likely to be stakeholders in a program - participants, other researchers, program staff, other community members, and so on.
Then we put all data in single framework & apply various statistical tools to find out the dynamic on the market.
During the analysis stage, feedback from the stakeholder groups would be compared to determine areas of agreement as well as areas of divergence
