

Key Insights
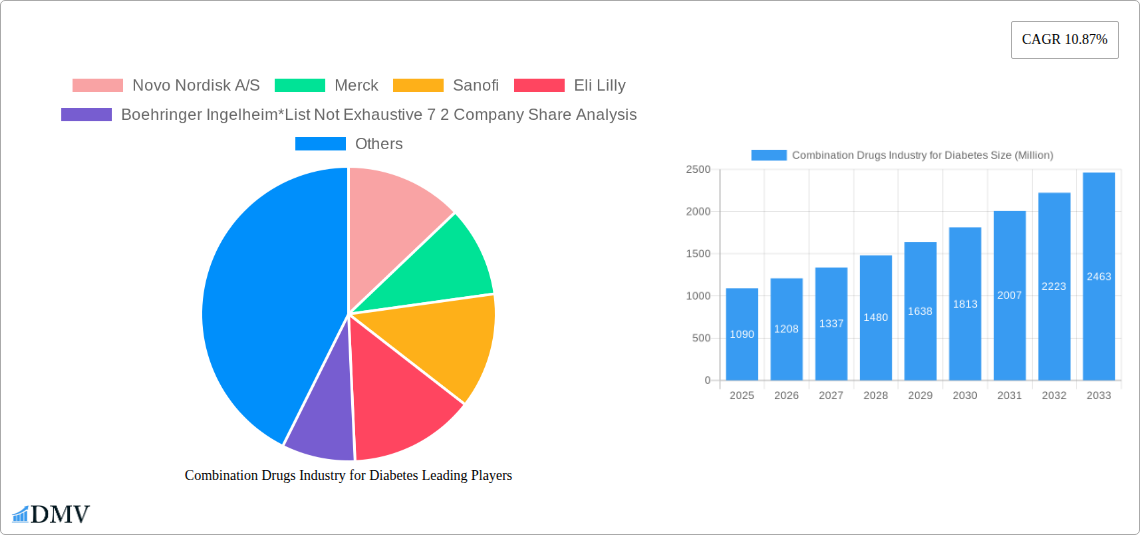
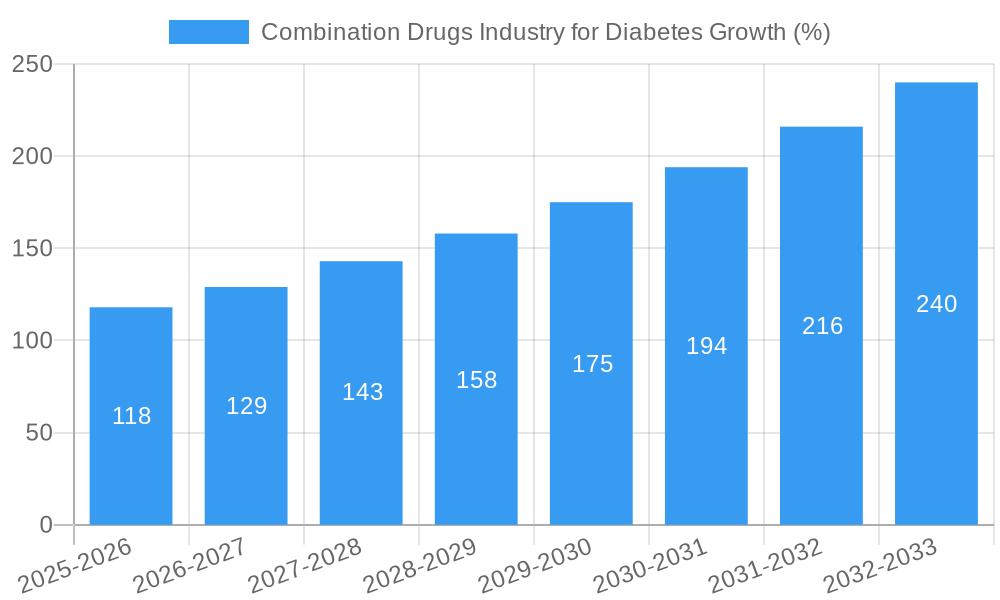
The global market for combination drugs in diabetes treatment is experiencing robust growth, projected to reach $1.09 billion in 2025 and exhibiting a Compound Annual Growth Rate (CAGR) of 10.87% from 2025 to 2033. This expansion is driven by several key factors. Increasing prevalence of type 2 diabetes, particularly in developing economies with aging populations and rising lifestyle-related diseases, fuels demand for effective and convenient combination therapies. Furthermore, the development of novel drug combinations offering superior glycemic control, reduced side effects, and improved patient adherence contributes significantly to market growth. The preference for once-daily or weekly regimens over multiple daily injections further enhances market appeal. Competitive advancements, including innovative formulations and delivery systems, are also driving the sector forward. Major players like Novo Nordisk A/S, Merck, Sanofi, Eli Lilly, and Boehringer Ingelheim are at the forefront of this innovation, continually striving to enhance treatment outcomes and capture market share. The market segmentation, although not explicitly detailed, likely involves various drug combinations targeting different aspects of diabetes management, like insulin secretagogues, GLP-1 receptor agonists, and SGLT2 inhibitors, potentially further influencing growth dynamics.
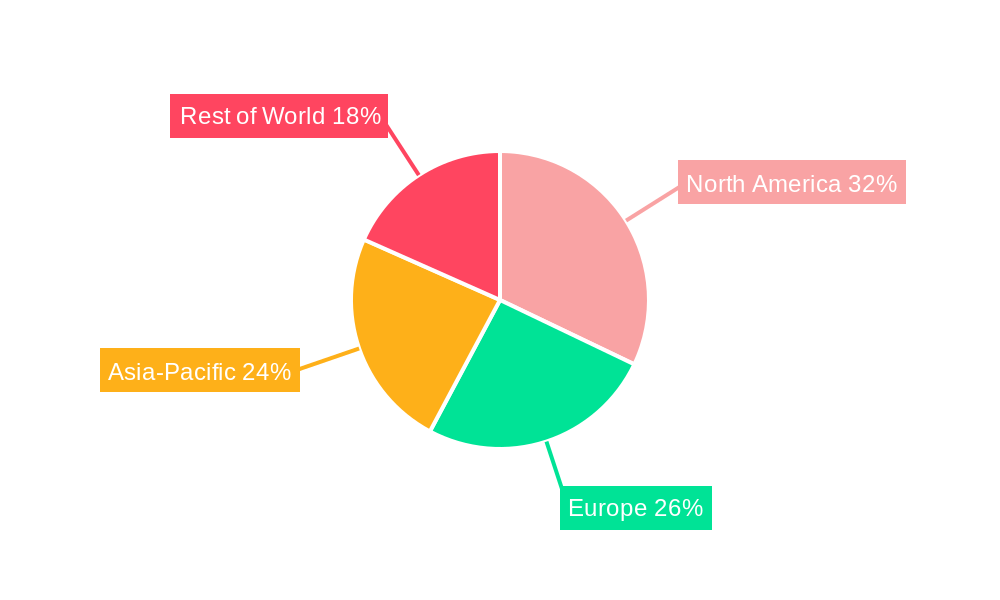
The market's growth trajectory is not without challenges. High treatment costs, particularly for newer, more effective combination therapies, remain a significant restraint, potentially limiting access for some patient populations. Moreover, the emergence of biosimilar competition could impact the pricing and profitability of established products in the coming years. Despite these constraints, the market is anticipated to maintain its upward trajectory driven by consistent drug innovation, an expanding patient pool, and favorable regulatory landscapes in key global regions. Geographical variations in market size are likely, with developed nations exhibiting higher per capita consumption, while emerging markets represent substantial growth opportunities. This dynamic interplay between market drivers and challenges will significantly shape the future competitive landscape of the combination diabetes drug market.
Combination Drugs Industry for Diabetes: A Comprehensive Market Report (2019-2033)
This insightful report provides a detailed analysis of the global Combination Drugs Industry for Diabetes, offering a comprehensive overview of market trends, competitive dynamics, and future growth prospects. The study period covers 2019-2033, with 2025 as the base and estimated year, and a forecast period of 2025-2033. The report unveils critical insights for stakeholders, investors, and industry professionals seeking to navigate this dynamic market. The market is projected to reach xx Million by 2033.
Combination Drugs Industry for Diabetes Market Composition & Trends
This section dissects the market's competitive landscape, innovation drivers, regulatory frameworks, and strategic activities. The report analyzes market concentration, revealing a moderately consolidated market with key players holding significant shares. The market share distribution in 2025 is estimated as follows: Novo Nordisk A/S (xx%), Merck (xx%), Sanofi (xx%), and Other (xx%). The report also examines the impact of M&A activities, including deal values and their influence on market dynamics. Examples of significant innovation catalysts include the development of novel drug combinations targeting specific diabetes subtypes and the ongoing research into personalized medicine approaches. Regulatory landscapes are analyzed for major regions, including the impact of approvals and pricing policies. Substitute products, their market penetration, and their impact on the Combination Drugs market are also examined. Finally, the report profiles end-users, focusing on patient demographics and treatment patterns. The analysis also encompasses future trends and developments that are expected to impact market behavior in the coming years.
Combination Drugs Industry for Diabetes Industry Evolution
This section meticulously traces the evolution of the Combination Drugs Industry for Diabetes, from its historical trajectory to its anticipated future. The report analyzes market growth trajectories from 2019 to 2024, demonstrating a Compound Annual Growth Rate (CAGR) of xx%. Technological advancements, such as the development of improved drug delivery systems and the integration of digital health technologies, are thoroughly examined. Further investigation into the evolving consumer demands within the diabetes treatment landscape, including factors such as patient preference for specific drug combinations and increasing access to information are also included. The report analyzes shifting preferences towards convenient dosing regimens, personalized treatment approaches, and cost-effectiveness. Specific data points, including adoption rates of new drug combinations and consumer feedback trends, are incorporated to provide a comprehensive understanding of the industry's dynamic evolution.
Leading Regions, Countries, or Segments in Combination Drugs Industry for Diabetes
This section identifies the leading geographical regions and segments within the Combination Drugs Industry for Diabetes market. The report pinpoints the dominant region/country, providing a detailed analysis of the factors contributing to its leading position.
- Key Drivers of Dominance:
- Favorable regulatory environment and supportive healthcare policies.
- High prevalence of diabetes and strong healthcare infrastructure.
- Significant investments in research and development.
- Growing awareness and improved access to diabetes treatment.
- Strong market penetration of combination drugs.
The report delves into the specific reasons behind this dominance, including but not limited to investment trends, regulatory support, patient demographics, and market access strategies. A detailed analysis is presented, examining factors influencing market growth, competitive intensity, and the overall market landscape within the region/country.
Combination Drugs Industry for Diabetes Product Innovations
This section highlights the latest product innovations within the combination drugs market for diabetes, focusing on novel drug combinations, advanced delivery systems, and technological advancements that enhance efficacy and patient compliance. Unique selling propositions of leading products are highlighted, along with their performance metrics and clinical trial outcomes. The emphasis is on advancements that aim to improve glycemic control, reduce side effects, and simplify treatment regimens for patients with diabetes.
Propelling Factors for Combination Drugs Industry for Diabetes Growth
Several factors are driving the growth of the combination drugs industry for diabetes. Technological advancements, such as the development of novel drug combinations with enhanced efficacy and safety profiles, are a key driver. Economic factors, including the rising prevalence of diabetes globally and increased healthcare spending, also contribute significantly. Favorable regulatory environments and supportive government policies facilitating market access for new drugs further propel market expansion.
Obstacles in the Combination Drugs Industry for Diabetes Market
The Combination Drugs Industry for Diabetes faces challenges such as stringent regulatory hurdles impacting drug approvals and increasing development costs. Supply chain disruptions impacting drug production and distribution can also cause market instability. Intense competition among pharmaceutical companies, leading to price pressures and the need for constant innovation, poses a significant challenge. These obstacles can impact market growth and profitability.
Future Opportunities in Combination Drugs Industry for Diabetes
Future growth opportunities exist in expanding into untapped markets, particularly in developing countries with rising diabetes prevalence. The development of next-generation drug combinations with improved efficacy and safety profiles presents significant opportunities. Technological advancements, such as personalized medicine and digital health solutions, offer further potential for market expansion.
Major Players in the Combination Drugs Industry for Diabetes Ecosystem
- Novo Nordisk A/S
- Merck
- Sanofi
- Eli Lilly
- Boehringer Ingelheim
- List Not Exhaustive
7 2 Company Share Analysis: Novo Nordisk A/S, Merck, Sanofi, Other
Key Developments in Combination Drugs Industry for Diabetes Industry
- July 2022: Glenmark Pharmaceuticals Limited launched sitagliptin and its fixed-dose combinations for adults with Type 2 diabetes in India, introducing 8 combinations under the brand name SITAZIT. This significantly increased market access and affordability within India.
- July 2022: The European Commission granted marketing authorization for "Sitagliptin/Metformin hydrochloride Accord," expanding market availability within the European Union. This broadened access to a key combination therapy across Europe.
Strategic Combination Drugs Industry for Diabetes Market Forecast
The Combination Drugs Industry for Diabetes is poised for substantial growth, driven by technological advancements, increasing prevalence of diabetes, and favorable regulatory environments. Future opportunities lie in personalized medicine, novel drug combinations, and expansion into emerging markets. This robust growth trajectory positions the market for significant expansion throughout the forecast period, offering substantial potential for market entrants and established players alike.
Combination Drugs Industry for Diabetes Segmentation
-
1. Oral Combination
- 1.1. Janumet (Sitagliptin and Metformin HCl)
-
2. Insulin Combination
- 2.1. NovoMix (Biphasic Insulin Aspart)
- 2.2. Ryzodeg (Insulin Degludec and Insulin Aspart)
- 2.3. Xultophy (Insulin Degludec and Liraglutide)
Combination Drugs Industry for Diabetes Segmentation By Geography
-
1. North America
- 1.1. United States
- 1.2. Canada
- 1.3. Rest of North America
-
2. Europe
- 2.1. France
- 2.2. Germany
- 2.3. Italy
- 2.4. Spain
- 2.5. United Kingdom
- 2.6. Russia
- 2.7. Rest of Europe
-
3. Latin America
- 3.1. Mexico
- 3.2. Brazil
- 3.3. Rest of Latin America
-
4. Asia Pacific
- 4.1. Australia
- 4.2. China
- 4.3. India
- 4.4. Indonesia
- 4.5. Japan
- 4.6. Malaysia
- 4.7. Philippines
- 4.8. South Korea
- 4.9. Thailand
- 4.10. Vietnam
- 4.11. Rest of Asia Pacific
-
5. Middle East and Africa
- 5.1. Saudi Arabia
- 5.2. Iran
- 5.3. Egypt
- 5.4. Oman
- 5.5. South Africa
- 5.6. Rest of Middle East and Africa
Combination Drugs Industry for Diabetes REPORT HIGHLIGHTS
| Aspects | Details |
|---|---|
| Study Period | 2019-2033 |
| Base Year | 2024 |
| Estimated Year | 2025 |
| Forecast Period | 2025-2033 |
| Historical Period | 2019-2024 |
| Growth Rate | CAGR of 10.87% from 2019-2033 |
| Segmentation |
|
Table of Contents
- 1. Introduction
- 1.1. Research Scope
- 1.2. Market Segmentation
- 1.3. Research Methodology
- 1.4. Definitions and Assumptions
- 2. Executive Summary
- 2.1. Introduction
- 3. Market Dynamics
- 3.1. Introduction
- 3.2. Market Drivers
- 3.3. Market Restrains
- 3.4. Market Trends
- 3.4.1. Janumet holds the highest market share in the Combination Anti-Diabetes Drugs Market in the current year
- 4. Market Factor Analysis
- 4.1. Porters Five Forces
- 4.2. Supply/Value Chain
- 4.3. PESTEL analysis
- 4.4. Market Entropy
- 4.5. Patent/Trademark Analysis
- 5. Global Combination Drugs Industry for Diabetes Analysis, Insights and Forecast, 2019-2031
- 5.1. Market Analysis, Insights and Forecast - by Oral Combination
- 5.1.1. Janumet (Sitagliptin and Metformin HCl)
- 5.2. Market Analysis, Insights and Forecast - by Insulin Combination
- 5.2.1. NovoMix (Biphasic Insulin Aspart)
- 5.2.2. Ryzodeg (Insulin Degludec and Insulin Aspart)
- 5.2.3. Xultophy (Insulin Degludec and Liraglutide)
- 5.3. Market Analysis, Insights and Forecast - by Region
- 5.3.1. North America
- 5.3.2. Europe
- 5.3.3. Latin America
- 5.3.4. Asia Pacific
- 5.3.5. Middle East and Africa
- 5.1. Market Analysis, Insights and Forecast - by Oral Combination
- 6. North America Combination Drugs Industry for Diabetes Analysis, Insights and Forecast, 2019-2031
- 6.1. Market Analysis, Insights and Forecast - by Oral Combination
- 6.1.1. Janumet (Sitagliptin and Metformin HCl)
- 6.2. Market Analysis, Insights and Forecast - by Insulin Combination
- 6.2.1. NovoMix (Biphasic Insulin Aspart)
- 6.2.2. Ryzodeg (Insulin Degludec and Insulin Aspart)
- 6.2.3. Xultophy (Insulin Degludec and Liraglutide)
- 6.1. Market Analysis, Insights and Forecast - by Oral Combination
- 7. Europe Combination Drugs Industry for Diabetes Analysis, Insights and Forecast, 2019-2031
- 7.1. Market Analysis, Insights and Forecast - by Oral Combination
- 7.1.1. Janumet (Sitagliptin and Metformin HCl)
- 7.2. Market Analysis, Insights and Forecast - by Insulin Combination
- 7.2.1. NovoMix (Biphasic Insulin Aspart)
- 7.2.2. Ryzodeg (Insulin Degludec and Insulin Aspart)
- 7.2.3. Xultophy (Insulin Degludec and Liraglutide)
- 7.1. Market Analysis, Insights and Forecast - by Oral Combination
- 8. Latin America Combination Drugs Industry for Diabetes Analysis, Insights and Forecast, 2019-2031
- 8.1. Market Analysis, Insights and Forecast - by Oral Combination
- 8.1.1. Janumet (Sitagliptin and Metformin HCl)
- 8.2. Market Analysis, Insights and Forecast - by Insulin Combination
- 8.2.1. NovoMix (Biphasic Insulin Aspart)
- 8.2.2. Ryzodeg (Insulin Degludec and Insulin Aspart)
- 8.2.3. Xultophy (Insulin Degludec and Liraglutide)
- 8.1. Market Analysis, Insights and Forecast - by Oral Combination
- 9. Asia Pacific Combination Drugs Industry for Diabetes Analysis, Insights and Forecast, 2019-2031
- 9.1. Market Analysis, Insights and Forecast - by Oral Combination
- 9.1.1. Janumet (Sitagliptin and Metformin HCl)
- 9.2. Market Analysis, Insights and Forecast - by Insulin Combination
- 9.2.1. NovoMix (Biphasic Insulin Aspart)
- 9.2.2. Ryzodeg (Insulin Degludec and Insulin Aspart)
- 9.2.3. Xultophy (Insulin Degludec and Liraglutide)
- 9.1. Market Analysis, Insights and Forecast - by Oral Combination
- 10. Middle East and Africa Combination Drugs Industry for Diabetes Analysis, Insights and Forecast, 2019-2031
- 10.1. Market Analysis, Insights and Forecast - by Oral Combination
- 10.1.1. Janumet (Sitagliptin and Metformin HCl)
- 10.2. Market Analysis, Insights and Forecast - by Insulin Combination
- 10.2.1. NovoMix (Biphasic Insulin Aspart)
- 10.2.2. Ryzodeg (Insulin Degludec and Insulin Aspart)
- 10.2.3. Xultophy (Insulin Degludec and Liraglutide)
- 10.1. Market Analysis, Insights and Forecast - by Oral Combination
- 11. Competitive Analysis
- 11.1. Global Market Share Analysis 2024
- 11.2. Company Profiles
- 11.2.1 Novo Nordisk A/S
- 11.2.1.1. Overview
- 11.2.1.2. Products
- 11.2.1.3. SWOT Analysis
- 11.2.1.4. Recent Developments
- 11.2.1.5. Financials (Based on Availability)
- 11.2.2 Merck
- 11.2.2.1. Overview
- 11.2.2.2. Products
- 11.2.2.3. SWOT Analysis
- 11.2.2.4. Recent Developments
- 11.2.2.5. Financials (Based on Availability)
- 11.2.3 Sanofi
- 11.2.3.1. Overview
- 11.2.3.2. Products
- 11.2.3.3. SWOT Analysis
- 11.2.3.4. Recent Developments
- 11.2.3.5. Financials (Based on Availability)
- 11.2.4 Eli Lilly
- 11.2.4.1. Overview
- 11.2.4.2. Products
- 11.2.4.3. SWOT Analysis
- 11.2.4.4. Recent Developments
- 11.2.4.5. Financials (Based on Availability)
- 11.2.5 Boehringer Ingelheim*List Not Exhaustive 7 2 Company Share Analysis
- 11.2.5.1. Overview
- 11.2.5.2. Products
- 11.2.5.3. SWOT Analysis
- 11.2.5.4. Recent Developments
- 11.2.5.5. Financials (Based on Availability)
- 11.2.6 Novo Nordisk A/S
- 11.2.6.1. Overview
- 11.2.6.2. Products
- 11.2.6.3. SWOT Analysis
- 11.2.6.4. Recent Developments
- 11.2.6.5. Financials (Based on Availability)
- 11.2.7 Merck
- 11.2.7.1. Overview
- 11.2.7.2. Products
- 11.2.7.3. SWOT Analysis
- 11.2.7.4. Recent Developments
- 11.2.7.5. Financials (Based on Availability)
- 11.2.8 Sanofi
- 11.2.8.1. Overview
- 11.2.8.2. Products
- 11.2.8.3. SWOT Analysis
- 11.2.8.4. Recent Developments
- 11.2.8.5. Financials (Based on Availability)
- 11.2.9 Other
- 11.2.9.1. Overview
- 11.2.9.2. Products
- 11.2.9.3. SWOT Analysis
- 11.2.9.4. Recent Developments
- 11.2.9.5. Financials (Based on Availability)
- 11.2.1 Novo Nordisk A/S
List of Figures
- Figure 1: Global Combination Drugs Industry for Diabetes Revenue Breakdown (Million, %) by Region 2024 & 2032
- Figure 2: Global Combination Drugs Industry for Diabetes Volume Breakdown (Billion, %) by Region 2024 & 2032
- Figure 3: North America Combination Drugs Industry for Diabetes Revenue (Million), by Oral Combination 2024 & 2032
- Figure 4: North America Combination Drugs Industry for Diabetes Volume (Billion), by Oral Combination 2024 & 2032
- Figure 5: North America Combination Drugs Industry for Diabetes Revenue Share (%), by Oral Combination 2024 & 2032
- Figure 6: North America Combination Drugs Industry for Diabetes Volume Share (%), by Oral Combination 2024 & 2032
- Figure 7: North America Combination Drugs Industry for Diabetes Revenue (Million), by Insulin Combination 2024 & 2032
- Figure 8: North America Combination Drugs Industry for Diabetes Volume (Billion), by Insulin Combination 2024 & 2032
- Figure 9: North America Combination Drugs Industry for Diabetes Revenue Share (%), by Insulin Combination 2024 & 2032
- Figure 10: North America Combination Drugs Industry for Diabetes Volume Share (%), by Insulin Combination 2024 & 2032
- Figure 11: North America Combination Drugs Industry for Diabetes Revenue (Million), by Country 2024 & 2032
- Figure 12: North America Combination Drugs Industry for Diabetes Volume (Billion), by Country 2024 & 2032
- Figure 13: North America Combination Drugs Industry for Diabetes Revenue Share (%), by Country 2024 & 2032
- Figure 14: North America Combination Drugs Industry for Diabetes Volume Share (%), by Country 2024 & 2032
- Figure 15: Europe Combination Drugs Industry for Diabetes Revenue (Million), by Oral Combination 2024 & 2032
- Figure 16: Europe Combination Drugs Industry for Diabetes Volume (Billion), by Oral Combination 2024 & 2032
- Figure 17: Europe Combination Drugs Industry for Diabetes Revenue Share (%), by Oral Combination 2024 & 2032
- Figure 18: Europe Combination Drugs Industry for Diabetes Volume Share (%), by Oral Combination 2024 & 2032
- Figure 19: Europe Combination Drugs Industry for Diabetes Revenue (Million), by Insulin Combination 2024 & 2032
- Figure 20: Europe Combination Drugs Industry for Diabetes Volume (Billion), by Insulin Combination 2024 & 2032
- Figure 21: Europe Combination Drugs Industry for Diabetes Revenue Share (%), by Insulin Combination 2024 & 2032
- Figure 22: Europe Combination Drugs Industry for Diabetes Volume Share (%), by Insulin Combination 2024 & 2032
- Figure 23: Europe Combination Drugs Industry for Diabetes Revenue (Million), by Country 2024 & 2032
- Figure 24: Europe Combination Drugs Industry for Diabetes Volume (Billion), by Country 2024 & 2032
- Figure 25: Europe Combination Drugs Industry for Diabetes Revenue Share (%), by Country 2024 & 2032
- Figure 26: Europe Combination Drugs Industry for Diabetes Volume Share (%), by Country 2024 & 2032
- Figure 27: Latin America Combination Drugs Industry for Diabetes Revenue (Million), by Oral Combination 2024 & 2032
- Figure 28: Latin America Combination Drugs Industry for Diabetes Volume (Billion), by Oral Combination 2024 & 2032
- Figure 29: Latin America Combination Drugs Industry for Diabetes Revenue Share (%), by Oral Combination 2024 & 2032
- Figure 30: Latin America Combination Drugs Industry for Diabetes Volume Share (%), by Oral Combination 2024 & 2032
- Figure 31: Latin America Combination Drugs Industry for Diabetes Revenue (Million), by Insulin Combination 2024 & 2032
- Figure 32: Latin America Combination Drugs Industry for Diabetes Volume (Billion), by Insulin Combination 2024 & 2032
- Figure 33: Latin America Combination Drugs Industry for Diabetes Revenue Share (%), by Insulin Combination 2024 & 2032
- Figure 34: Latin America Combination Drugs Industry for Diabetes Volume Share (%), by Insulin Combination 2024 & 2032
- Figure 35: Latin America Combination Drugs Industry for Diabetes Revenue (Million), by Country 2024 & 2032
- Figure 36: Latin America Combination Drugs Industry for Diabetes Volume (Billion), by Country 2024 & 2032
- Figure 37: Latin America Combination Drugs Industry for Diabetes Revenue Share (%), by Country 2024 & 2032
- Figure 38: Latin America Combination Drugs Industry for Diabetes Volume Share (%), by Country 2024 & 2032
- Figure 39: Asia Pacific Combination Drugs Industry for Diabetes Revenue (Million), by Oral Combination 2024 & 2032
- Figure 40: Asia Pacific Combination Drugs Industry for Diabetes Volume (Billion), by Oral Combination 2024 & 2032
- Figure 41: Asia Pacific Combination Drugs Industry for Diabetes Revenue Share (%), by Oral Combination 2024 & 2032
- Figure 42: Asia Pacific Combination Drugs Industry for Diabetes Volume Share (%), by Oral Combination 2024 & 2032
- Figure 43: Asia Pacific Combination Drugs Industry for Diabetes Revenue (Million), by Insulin Combination 2024 & 2032
- Figure 44: Asia Pacific Combination Drugs Industry for Diabetes Volume (Billion), by Insulin Combination 2024 & 2032
- Figure 45: Asia Pacific Combination Drugs Industry for Diabetes Revenue Share (%), by Insulin Combination 2024 & 2032
- Figure 46: Asia Pacific Combination Drugs Industry for Diabetes Volume Share (%), by Insulin Combination 2024 & 2032
- Figure 47: Asia Pacific Combination Drugs Industry for Diabetes Revenue (Million), by Country 2024 & 2032
- Figure 48: Asia Pacific Combination Drugs Industry for Diabetes Volume (Billion), by Country 2024 & 2032
- Figure 49: Asia Pacific Combination Drugs Industry for Diabetes Revenue Share (%), by Country 2024 & 2032
- Figure 50: Asia Pacific Combination Drugs Industry for Diabetes Volume Share (%), by Country 2024 & 2032
- Figure 51: Middle East and Africa Combination Drugs Industry for Diabetes Revenue (Million), by Oral Combination 2024 & 2032
- Figure 52: Middle East and Africa Combination Drugs Industry for Diabetes Volume (Billion), by Oral Combination 2024 & 2032
- Figure 53: Middle East and Africa Combination Drugs Industry for Diabetes Revenue Share (%), by Oral Combination 2024 & 2032
- Figure 54: Middle East and Africa Combination Drugs Industry for Diabetes Volume Share (%), by Oral Combination 2024 & 2032
- Figure 55: Middle East and Africa Combination Drugs Industry for Diabetes Revenue (Million), by Insulin Combination 2024 & 2032
- Figure 56: Middle East and Africa Combination Drugs Industry for Diabetes Volume (Billion), by Insulin Combination 2024 & 2032
- Figure 57: Middle East and Africa Combination Drugs Industry for Diabetes Revenue Share (%), by Insulin Combination 2024 & 2032
- Figure 58: Middle East and Africa Combination Drugs Industry for Diabetes Volume Share (%), by Insulin Combination 2024 & 2032
- Figure 59: Middle East and Africa Combination Drugs Industry for Diabetes Revenue (Million), by Country 2024 & 2032
- Figure 60: Middle East and Africa Combination Drugs Industry for Diabetes Volume (Billion), by Country 2024 & 2032
- Figure 61: Middle East and Africa Combination Drugs Industry for Diabetes Revenue Share (%), by Country 2024 & 2032
- Figure 62: Middle East and Africa Combination Drugs Industry for Diabetes Volume Share (%), by Country 2024 & 2032
List of Tables
- Table 1: Global Combination Drugs Industry for Diabetes Revenue Million Forecast, by Region 2019 & 2032
- Table 2: Global Combination Drugs Industry for Diabetes Volume Billion Forecast, by Region 2019 & 2032
- Table 3: Global Combination Drugs Industry for Diabetes Revenue Million Forecast, by Oral Combination 2019 & 2032
- Table 4: Global Combination Drugs Industry for Diabetes Volume Billion Forecast, by Oral Combination 2019 & 2032
- Table 5: Global Combination Drugs Industry for Diabetes Revenue Million Forecast, by Insulin Combination 2019 & 2032
- Table 6: Global Combination Drugs Industry for Diabetes Volume Billion Forecast, by Insulin Combination 2019 & 2032
- Table 7: Global Combination Drugs Industry for Diabetes Revenue Million Forecast, by Region 2019 & 2032
- Table 8: Global Combination Drugs Industry for Diabetes Volume Billion Forecast, by Region 2019 & 2032
- Table 9: Global Combination Drugs Industry for Diabetes Revenue Million Forecast, by Oral Combination 2019 & 2032
- Table 10: Global Combination Drugs Industry for Diabetes Volume Billion Forecast, by Oral Combination 2019 & 2032
- Table 11: Global Combination Drugs Industry for Diabetes Revenue Million Forecast, by Insulin Combination 2019 & 2032
- Table 12: Global Combination Drugs Industry for Diabetes Volume Billion Forecast, by Insulin Combination 2019 & 2032
- Table 13: Global Combination Drugs Industry for Diabetes Revenue Million Forecast, by Country 2019 & 2032
- Table 14: Global Combination Drugs Industry for Diabetes Volume Billion Forecast, by Country 2019 & 2032
- Table 15: United States Combination Drugs Industry for Diabetes Revenue (Million) Forecast, by Application 2019 & 2032
- Table 16: United States Combination Drugs Industry for Diabetes Volume (Billion) Forecast, by Application 2019 & 2032
- Table 17: Canada Combination Drugs Industry for Diabetes Revenue (Million) Forecast, by Application 2019 & 2032
- Table 18: Canada Combination Drugs Industry for Diabetes Volume (Billion) Forecast, by Application 2019 & 2032
- Table 19: Rest of North America Combination Drugs Industry for Diabetes Revenue (Million) Forecast, by Application 2019 & 2032
- Table 20: Rest of North America Combination Drugs Industry for Diabetes Volume (Billion) Forecast, by Application 2019 & 2032
- Table 21: Global Combination Drugs Industry for Diabetes Revenue Million Forecast, by Oral Combination 2019 & 2032
- Table 22: Global Combination Drugs Industry for Diabetes Volume Billion Forecast, by Oral Combination 2019 & 2032
- Table 23: Global Combination Drugs Industry for Diabetes Revenue Million Forecast, by Insulin Combination 2019 & 2032
- Table 24: Global Combination Drugs Industry for Diabetes Volume Billion Forecast, by Insulin Combination 2019 & 2032
- Table 25: Global Combination Drugs Industry for Diabetes Revenue Million Forecast, by Country 2019 & 2032
- Table 26: Global Combination Drugs Industry for Diabetes Volume Billion Forecast, by Country 2019 & 2032
- Table 27: France Combination Drugs Industry for Diabetes Revenue (Million) Forecast, by Application 2019 & 2032
- Table 28: France Combination Drugs Industry for Diabetes Volume (Billion) Forecast, by Application 2019 & 2032
- Table 29: Germany Combination Drugs Industry for Diabetes Revenue (Million) Forecast, by Application 2019 & 2032
- Table 30: Germany Combination Drugs Industry for Diabetes Volume (Billion) Forecast, by Application 2019 & 2032
- Table 31: Italy Combination Drugs Industry for Diabetes Revenue (Million) Forecast, by Application 2019 & 2032
- Table 32: Italy Combination Drugs Industry for Diabetes Volume (Billion) Forecast, by Application 2019 & 2032
- Table 33: Spain Combination Drugs Industry for Diabetes Revenue (Million) Forecast, by Application 2019 & 2032
- Table 34: Spain Combination Drugs Industry for Diabetes Volume (Billion) Forecast, by Application 2019 & 2032
- Table 35: United Kingdom Combination Drugs Industry for Diabetes Revenue (Million) Forecast, by Application 2019 & 2032
- Table 36: United Kingdom Combination Drugs Industry for Diabetes Volume (Billion) Forecast, by Application 2019 & 2032
- Table 37: Russia Combination Drugs Industry for Diabetes Revenue (Million) Forecast, by Application 2019 & 2032
- Table 38: Russia Combination Drugs Industry for Diabetes Volume (Billion) Forecast, by Application 2019 & 2032
- Table 39: Rest of Europe Combination Drugs Industry for Diabetes Revenue (Million) Forecast, by Application 2019 & 2032
- Table 40: Rest of Europe Combination Drugs Industry for Diabetes Volume (Billion) Forecast, by Application 2019 & 2032
- Table 41: Global Combination Drugs Industry for Diabetes Revenue Million Forecast, by Oral Combination 2019 & 2032
- Table 42: Global Combination Drugs Industry for Diabetes Volume Billion Forecast, by Oral Combination 2019 & 2032
- Table 43: Global Combination Drugs Industry for Diabetes Revenue Million Forecast, by Insulin Combination 2019 & 2032
- Table 44: Global Combination Drugs Industry for Diabetes Volume Billion Forecast, by Insulin Combination 2019 & 2032
- Table 45: Global Combination Drugs Industry for Diabetes Revenue Million Forecast, by Country 2019 & 2032
- Table 46: Global Combination Drugs Industry for Diabetes Volume Billion Forecast, by Country 2019 & 2032
- Table 47: Mexico Combination Drugs Industry for Diabetes Revenue (Million) Forecast, by Application 2019 & 2032
- Table 48: Mexico Combination Drugs Industry for Diabetes Volume (Billion) Forecast, by Application 2019 & 2032
- Table 49: Brazil Combination Drugs Industry for Diabetes Revenue (Million) Forecast, by Application 2019 & 2032
- Table 50: Brazil Combination Drugs Industry for Diabetes Volume (Billion) Forecast, by Application 2019 & 2032
- Table 51: Rest of Latin America Combination Drugs Industry for Diabetes Revenue (Million) Forecast, by Application 2019 & 2032
- Table 52: Rest of Latin America Combination Drugs Industry for Diabetes Volume (Billion) Forecast, by Application 2019 & 2032
- Table 53: Global Combination Drugs Industry for Diabetes Revenue Million Forecast, by Oral Combination 2019 & 2032
- Table 54: Global Combination Drugs Industry for Diabetes Volume Billion Forecast, by Oral Combination 2019 & 2032
- Table 55: Global Combination Drugs Industry for Diabetes Revenue Million Forecast, by Insulin Combination 2019 & 2032
- Table 56: Global Combination Drugs Industry for Diabetes Volume Billion Forecast, by Insulin Combination 2019 & 2032
- Table 57: Global Combination Drugs Industry for Diabetes Revenue Million Forecast, by Country 2019 & 2032
- Table 58: Global Combination Drugs Industry for Diabetes Volume Billion Forecast, by Country 2019 & 2032
- Table 59: Australia Combination Drugs Industry for Diabetes Revenue (Million) Forecast, by Application 2019 & 2032
- Table 60: Australia Combination Drugs Industry for Diabetes Volume (Billion) Forecast, by Application 2019 & 2032
- Table 61: China Combination Drugs Industry for Diabetes Revenue (Million) Forecast, by Application 2019 & 2032
- Table 62: China Combination Drugs Industry for Diabetes Volume (Billion) Forecast, by Application 2019 & 2032
- Table 63: India Combination Drugs Industry for Diabetes Revenue (Million) Forecast, by Application 2019 & 2032
- Table 64: India Combination Drugs Industry for Diabetes Volume (Billion) Forecast, by Application 2019 & 2032
- Table 65: Indonesia Combination Drugs Industry for Diabetes Revenue (Million) Forecast, by Application 2019 & 2032
- Table 66: Indonesia Combination Drugs Industry for Diabetes Volume (Billion) Forecast, by Application 2019 & 2032
- Table 67: Japan Combination Drugs Industry for Diabetes Revenue (Million) Forecast, by Application 2019 & 2032
- Table 68: Japan Combination Drugs Industry for Diabetes Volume (Billion) Forecast, by Application 2019 & 2032
- Table 69: Malaysia Combination Drugs Industry for Diabetes Revenue (Million) Forecast, by Application 2019 & 2032
- Table 70: Malaysia Combination Drugs Industry for Diabetes Volume (Billion) Forecast, by Application 2019 & 2032
- Table 71: Philippines Combination Drugs Industry for Diabetes Revenue (Million) Forecast, by Application 2019 & 2032
- Table 72: Philippines Combination Drugs Industry for Diabetes Volume (Billion) Forecast, by Application 2019 & 2032
- Table 73: South Korea Combination Drugs Industry for Diabetes Revenue (Million) Forecast, by Application 2019 & 2032
- Table 74: South Korea Combination Drugs Industry for Diabetes Volume (Billion) Forecast, by Application 2019 & 2032
- Table 75: Thailand Combination Drugs Industry for Diabetes Revenue (Million) Forecast, by Application 2019 & 2032
- Table 76: Thailand Combination Drugs Industry for Diabetes Volume (Billion) Forecast, by Application 2019 & 2032
- Table 77: Vietnam Combination Drugs Industry for Diabetes Revenue (Million) Forecast, by Application 2019 & 2032
- Table 78: Vietnam Combination Drugs Industry for Diabetes Volume (Billion) Forecast, by Application 2019 & 2032
- Table 79: Rest of Asia Pacific Combination Drugs Industry for Diabetes Revenue (Million) Forecast, by Application 2019 & 2032
- Table 80: Rest of Asia Pacific Combination Drugs Industry for Diabetes Volume (Billion) Forecast, by Application 2019 & 2032
- Table 81: Global Combination Drugs Industry for Diabetes Revenue Million Forecast, by Oral Combination 2019 & 2032
- Table 82: Global Combination Drugs Industry for Diabetes Volume Billion Forecast, by Oral Combination 2019 & 2032
- Table 83: Global Combination Drugs Industry for Diabetes Revenue Million Forecast, by Insulin Combination 2019 & 2032
- Table 84: Global Combination Drugs Industry for Diabetes Volume Billion Forecast, by Insulin Combination 2019 & 2032
- Table 85: Global Combination Drugs Industry for Diabetes Revenue Million Forecast, by Country 2019 & 2032
- Table 86: Global Combination Drugs Industry for Diabetes Volume Billion Forecast, by Country 2019 & 2032
- Table 87: Saudi Arabia Combination Drugs Industry for Diabetes Revenue (Million) Forecast, by Application 2019 & 2032
- Table 88: Saudi Arabia Combination Drugs Industry for Diabetes Volume (Billion) Forecast, by Application 2019 & 2032
- Table 89: Iran Combination Drugs Industry for Diabetes Revenue (Million) Forecast, by Application 2019 & 2032
- Table 90: Iran Combination Drugs Industry for Diabetes Volume (Billion) Forecast, by Application 2019 & 2032
- Table 91: Egypt Combination Drugs Industry for Diabetes Revenue (Million) Forecast, by Application 2019 & 2032
- Table 92: Egypt Combination Drugs Industry for Diabetes Volume (Billion) Forecast, by Application 2019 & 2032
- Table 93: Oman Combination Drugs Industry for Diabetes Revenue (Million) Forecast, by Application 2019 & 2032
- Table 94: Oman Combination Drugs Industry for Diabetes Volume (Billion) Forecast, by Application 2019 & 2032
- Table 95: South Africa Combination Drugs Industry for Diabetes Revenue (Million) Forecast, by Application 2019 & 2032
- Table 96: South Africa Combination Drugs Industry for Diabetes Volume (Billion) Forecast, by Application 2019 & 2032
- Table 97: Rest of Middle East and Africa Combination Drugs Industry for Diabetes Revenue (Million) Forecast, by Application 2019 & 2032
- Table 98: Rest of Middle East and Africa Combination Drugs Industry for Diabetes Volume (Billion) Forecast, by Application 2019 & 2032
Frequently Asked Questions
1. What is the projected Compound Annual Growth Rate (CAGR) of the Combination Drugs Industry for Diabetes?
The projected CAGR is approximately 10.87%.
2. Which companies are prominent players in the Combination Drugs Industry for Diabetes?
Key companies in the market include Novo Nordisk A/S, Merck, Sanofi, Eli Lilly, Boehringer Ingelheim*List Not Exhaustive 7 2 Company Share Analysis, Novo Nordisk A/S, Merck, Sanofi, Other.
3. What are the main segments of the Combination Drugs Industry for Diabetes?
The market segments include Oral Combination, Insulin Combination.
4. Can you provide details about the market size?
The market size is estimated to be USD 1.09 Million as of 2022.
5. What are some drivers contributing to market growth?
N/A
6. What are the notable trends driving market growth?
Janumet holds the highest market share in the Combination Anti-Diabetes Drugs Market in the current year.
7. Are there any restraints impacting market growth?
N/A
8. Can you provide examples of recent developments in the market?
July 2022: Glenmark Pharmaceuticals Limited announced that it had launched sitagliptin and its fixed-dose combinations for adults with Type 2 diabetes in India. Glenmark introduced 8 different combinations of sitagliptin-based drugs under the brand name SITAZIT and its variants at an affordable price.
9. What pricing options are available for accessing the report?
Pricing options include single-user, multi-user, and enterprise licenses priced at USD 4750, USD 5250, and USD 8750 respectively.
10. Is the market size provided in terms of value or volume?
The market size is provided in terms of value, measured in Million and volume, measured in Billion.
11. Are there any specific market keywords associated with the report?
Yes, the market keyword associated with the report is "Combination Drugs Industry for Diabetes," which aids in identifying and referencing the specific market segment covered.
12. How do I determine which pricing option suits my needs best?
The pricing options vary based on user requirements and access needs. Individual users may opt for single-user licenses, while businesses requiring broader access may choose multi-user or enterprise licenses for cost-effective access to the report.
13. Are there any additional resources or data provided in the Combination Drugs Industry for Diabetes report?
While the report offers comprehensive insights, it's advisable to review the specific contents or supplementary materials provided to ascertain if additional resources or data are available.
14. How can I stay updated on further developments or reports in the Combination Drugs Industry for Diabetes?
To stay informed about further developments, trends, and reports in the Combination Drugs Industry for Diabetes, consider subscribing to industry newsletters, following relevant companies and organizations, or regularly checking reputable industry news sources and publications.
Methodology
Step 1 - Identification of Relevant Samples Size from Population Database


Step 2 - Approaches for Defining Global Market Size (Value, Volume* & Price*)

Note*: In applicable scenarios
Step 3 - Data Sources
Primary Research
- Web Analytics
- Survey Reports
- Research Institute
- Latest Research Reports
- Opinion Leaders
Secondary Research
- Annual Reports
- White Paper
- Latest Press Release
- Industry Association
- Paid Database
- Investor Presentations

Step 4 - Data Triangulation
Involves using different sources of information in order to increase the validity of a study
These sources are likely to be stakeholders in a program - participants, other researchers, program staff, other community members, and so on.
Then we put all data in single framework & apply various statistical tools to find out the dynamic on the market.
During the analysis stage, feedback from the stakeholder groups would be compared to determine areas of agreement as well as areas of divergence
