

Key Insights
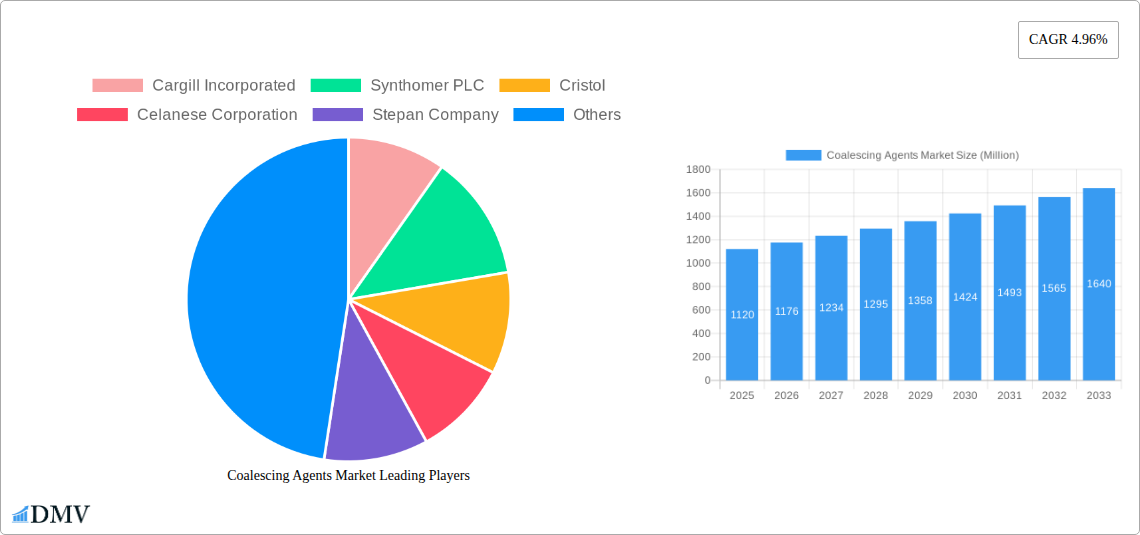
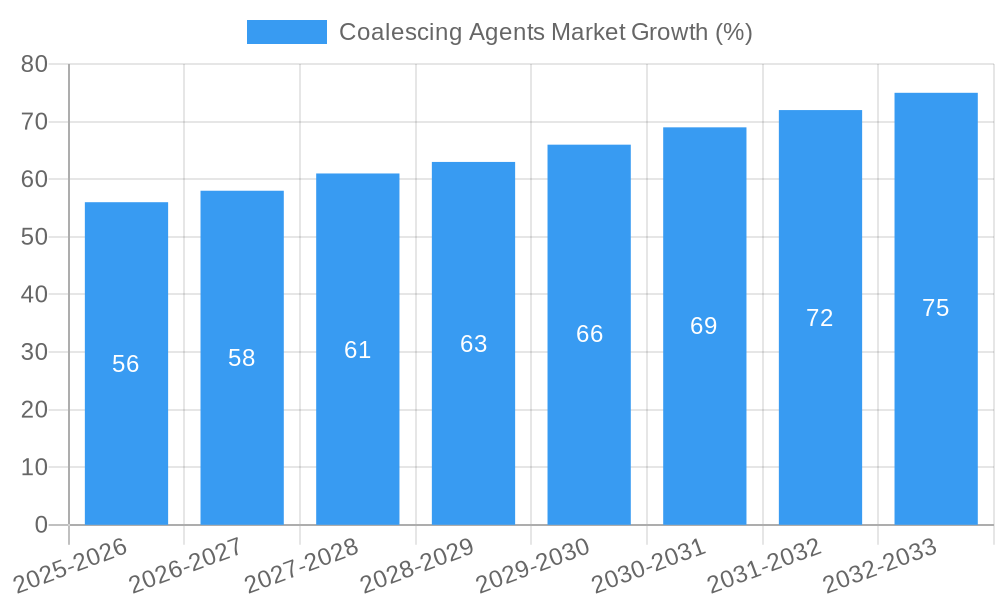
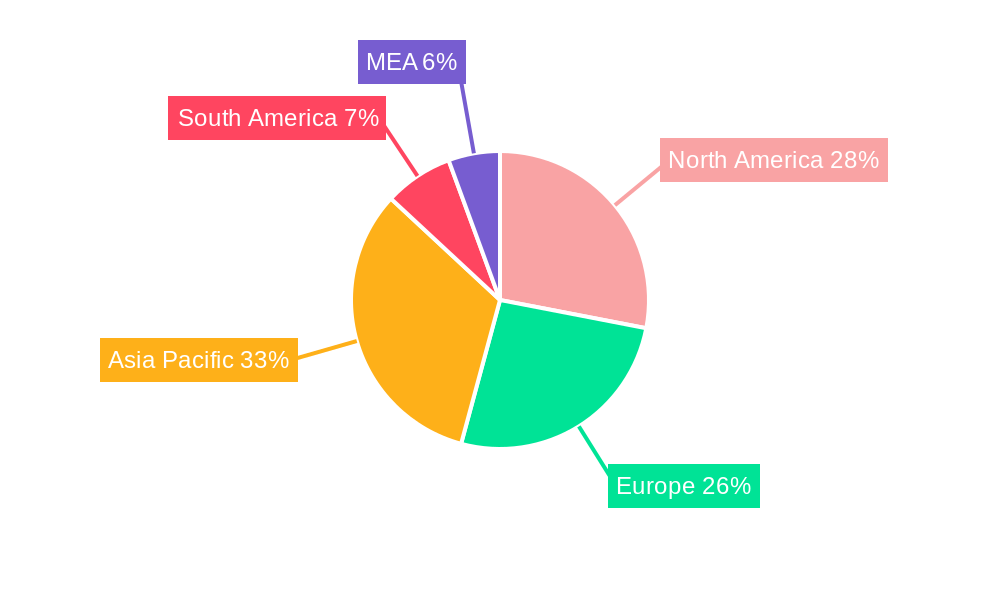
The coalescing agents market, valued at $1.12 billion in 2025, is projected to experience robust growth, driven by a compound annual growth rate (CAGR) of 4.96% from 2025 to 2033. This expansion is fueled by increasing demand across diverse sectors, notably adhesives & sealants, paints & coatings, and inks. The rising popularity of water-based formulations in these industries necessitates effective coalescing agents to enhance film formation and performance characteristics. Furthermore, growth within the personal care segment, driven by demand for improved emulsion stability and texture in cosmetics and skincare products, is contributing significantly to market expansion. The hydrophilic segment holds a substantial market share due to its versatility and widespread application across various industries. However, the hydrophobic segment is also expected to witness considerable growth, driven by specific applications requiring enhanced water resistance and durability. Geographic expansion is also a key driver, with the Asia-Pacific region, particularly China and India, emerging as significant growth markets due to rapid industrialization and rising consumption in developing economies. While specific restraints are not provided, potential challenges could include fluctuations in raw material prices, stringent environmental regulations impacting certain agent types, and the emergence of alternative technologies. Nevertheless, the overall market outlook remains positive, indicating substantial opportunities for market players in the coming years.
Major players like Cargill Incorporated, Synthomer PLC, and BASF SE are strategically positioned to capitalize on this growth through product innovation, strategic partnerships, and geographic expansion. Competitive landscape analysis reveals a mix of established players and smaller specialized companies, highlighting opportunities for both consolidation and niche market penetration. The market’s future trajectory will likely be shaped by technological advancements leading to more efficient and environmentally friendly coalescing agents, as well as continued demand growth from emerging markets and expanding applications in various industries. Market segmentation by type (hydrophilic and hydrophobic) and application (adhesives & sealants, paints & coatings, etc.) provides valuable insights into specific market dynamics and helps companies tailor their strategies for optimal market penetration.
Coalescing Agents Market: A Comprehensive Report (2019-2033)
This insightful report delivers a comprehensive analysis of the global Coalescing Agents Market, providing a detailed overview of market dynamics, growth trends, and future opportunities from 2019 to 2033. The study meticulously examines market size, segmentation, competitive landscape, and key technological advancements. This report is an invaluable resource for stakeholders, including manufacturers, distributors, investors, and researchers seeking to understand and capitalize on the evolving Coalescing Agents market landscape. The market is projected to reach xx Million by 2033, exhibiting a CAGR of xx% during the forecast period (2025-2033).
Coalescing Agents Market Market Composition & Trends
This section delves into the intricate structure of the Coalescing Agents market, analyzing its concentration, innovation drivers, regulatory environment, substitute products, and key end-user profiles. The report also examines mergers and acquisitions (M&A) activities, providing insights into deal values and their impact on market share distribution. The market exhibits a moderately consolidated structure, with the top five players holding approximately xx% of the global market share in 2025.
- Market Share Distribution (2025): Cargill Incorporated (xx%), Synthomer PLC (xx%), BASF SE (xx%), Dow (xx%), Others (xx%).
- M&A Activity (2019-2024): A total of xx M&A deals were recorded, with a combined value of approximately xx Million. Key deals included [mention specific significant M&A deals with brief descriptions].
- Innovation Catalysts: Growing demand for high-performance coatings, increasing focus on sustainable solutions, and advancements in polymer chemistry are driving innovation.
- Regulatory Landscape: Stringent environmental regulations concerning VOC emissions are influencing product development and market growth. The report details region-specific regulations impacting the market.
- Substitute Products: Competition from alternative technologies like [mention specific alternatives] is analyzed with respect to their market penetration and impact.
- End-User Profiles: Detailed analysis of end-user segments, including their specific needs and preferences in the usage of coalescing agents across various applications.
Coalescing Agents Market Industry Evolution
This section provides a detailed historical and future perspective on the Coalescing Agents market's growth trajectory, technological advancements, and evolving consumer preferences. The analysis covers the historical period (2019-2024) and projects the market's future performance until 2033. The market witnessed robust growth during 2019-2024, with a CAGR of xx%. This growth is primarily attributed to [mention specific factors contributing to past growth]. Looking ahead, the market is expected to continue its growth momentum, driven by factors such as increasing demand from the [mention specific end-use sectors], technological advancements in [mention specific technologies], and the rising adoption of [mention specific trends]. The report further provides detailed insights into these drivers, supported by relevant data points such as specific growth rates and adoption metrics for key technologies and applications.
Leading Regions, Countries, or Segments in Coalescing Agents Market
This section identifies the leading regions, countries, and segments within the Coalescing Agents market. Analysis includes a breakdown by type (Hydrophilic, Hydrophobic) and application (Adhesives & Sealants, Paints & Coatings, Inks, Personal Care, Other Applications).
Dominant Region: [Specify the dominant region – e.g., North America] accounts for approximately xx% of the global market share in 2025, driven by [explain reasons in detail, e.g., strong demand from the automotive industry, favorable regulatory environment].
Dominant Segment (Type): [Specify dominant type – e.g., Hydrophilic] holds the largest market share due to [explain reasons, e.g., wider application range, cost-effectiveness].
Dominant Segment (Application): [Specify dominant application – e.g., Paints & Coatings] dominates the market owing to [explain reasons, e.g., high volume consumption in construction and automotive sectors].
Key Drivers (by Region/Segment):
- [Region/Segment]: [List bullet points detailing key drivers, e.g., government investments in infrastructure projects, favorable economic conditions, technological advancements].
Coalescing Agents Market Product Innovations
Recent years have witnessed significant innovation in coalescing agents, focusing on improved performance characteristics, enhanced sustainability, and expanded application possibilities. New product introductions emphasize improved dispersion properties, reduced VOC content, and enhanced compatibility with various resins and polymers. These advancements are driven by growing demand for high-performance coatings and adhesives, as well as stricter environmental regulations. Specific examples include the development of [mention specific examples of innovative products].
Propelling Factors for Coalescing Agents Market Growth
Several factors contribute to the growth of the coalescing agents market. Technological advancements leading to improved performance and efficiency, coupled with the increasing demand from key end-use industries like construction and automotive, are major drivers. Moreover, favorable government policies promoting sustainable solutions and investments in infrastructure development further fuel market expansion. The rising disposable income in emerging economies also contributes to the growth.
Obstacles in the Coalescing Agents Market Market
Despite the promising growth prospects, the coalescing agents market faces certain challenges. Fluctuations in raw material prices, stringent environmental regulations leading to increased production costs, and intense competition from existing and emerging players pose significant obstacles. Supply chain disruptions, particularly prevalent in recent years, have also impacted market stability, resulting in price volatility and potential shortages.
Future Opportunities in Coalescing Agents Market
The future of the coalescing agents market appears bright. Emerging applications in areas such as [mention specific new applications] present significant opportunities. The development of bio-based and sustainable coalescing agents is anticipated to gain traction, driven by increasing environmental concerns. Furthermore, advancements in nanotechnology and other advanced material sciences are expected to unlock new possibilities, further enhancing the market's growth potential.
Major Players in the Coalescing Agents Market Ecosystem
- Cargill Incorporated
- Synthomer PLC
- Cristol
- Celanese Corporation
- Stepan Company
- Runtai Chemical Co Ltd
- BASF SE
- Arkema Group
- Rudolf GmbH
- Dow
- Eastman Chemical Company
Key Developments in Coalescing Agents Market Industry
- [Month, Year]: [Company Name] launched a new line of bio-based coalescing agents.
- [Month, Year]: [Company Name] acquired [Company Name], expanding its market presence.
- [Month, Year]: New environmental regulations implemented in [Region] impacted the market.
- [Month, Year]: Significant investment in R&D for sustainable coalescing agents. (Add further relevant developments in the same format.)
Strategic Coalescing Agents Market Market Forecast
The Coalescing Agents market is poised for continued growth, driven by increasing demand from diverse end-use sectors and ongoing product innovation. The focus on sustainability and the development of eco-friendly alternatives will shape market dynamics. Emerging applications and technological advancements will further propel market expansion, creating significant opportunities for market players. The market is projected to exhibit robust growth throughout the forecast period, with a substantial increase in market size and value.
Coalescing Agents Market Segmentation
-
1. Type
- 1.1. Hydrophilic
- 1.2. Hydrophobic
-
2. Application
- 2.1. Adhesives & Sealants
- 2.2. Paints & Coatings
- 2.3. Inks
- 2.4. Personal Care
- 2.5. Other Applications (Decoloring, Polymer, etc.)
Coalescing Agents Market Segmentation By Geography
-
1. Asia Pacific
- 1.1. China
- 1.2. India
- 1.3. Japan
- 1.4. South Korea
- 1.5. Malaysia
- 1.6. Thailand
- 1.7. Indonesia
- 1.8. Vietnam
- 1.9. Rest of Asia Pacific
-
2. North America
- 2.1. United States
- 2.2. Canada
- 2.3. Mexico
-
3. Europe
- 3.1. Germany
- 3.2. United Kingdom
- 3.3. Italy
- 3.4. France
- 3.5. Spain
- 3.6. NORDIC Countries
- 3.7. Turkey
- 3.8. Russia
- 3.9. Rest of Europe
-
4. South America
- 4.1. Brazil
- 4.2. Argentina
- 4.3. Colombia
- 4.4. Rest of South America
-
5. Middle East and Africa
- 5.1. Saudi Arabia
- 5.2. South Africa
- 5.3. Nigeria
- 5.4. Qatar
- 5.5. Egypt
- 5.6. United Arab Emirates
- 5.7. Rest of Middle East and Africa
Coalescing Agents Market REPORT HIGHLIGHTS
| Aspects | Details |
|---|---|
| Study Period | 2019-2033 |
| Base Year | 2024 |
| Estimated Year | 2025 |
| Forecast Period | 2025-2033 |
| Historical Period | 2019-2024 |
| Growth Rate | CAGR of 4.96% from 2019-2033 |
| Segmentation |
|
Table of Contents
- 1. Introduction
- 1.1. Research Scope
- 1.2. Market Segmentation
- 1.3. Research Methodology
- 1.4. Definitions and Assumptions
- 2. Executive Summary
- 2.1. Introduction
- 3. Market Dynamics
- 3.1. Introduction
- 3.2. Market Drivers
- 3.2.1. Increasing Usage in Personal Care Items; Rising Demand for Architectural and Industrial Coatings in Asia; Other Drivers
- 3.3. Market Restrains
- 3.3.1. Stringent Environmemtal Regulations; Other Restraints
- 3.4. Market Trends
- 3.4.1. Increasing Demand from Paints and Coatings Segment
- 4. Market Factor Analysis
- 4.1. Porters Five Forces
- 4.2. Supply/Value Chain
- 4.3. PESTEL analysis
- 4.4. Market Entropy
- 4.5. Patent/Trademark Analysis
- 5. Global Coalescing Agents Market Analysis, Insights and Forecast, 2019-2031
- 5.1. Market Analysis, Insights and Forecast - by Type
- 5.1.1. Hydrophilic
- 5.1.2. Hydrophobic
- 5.2. Market Analysis, Insights and Forecast - by Application
- 5.2.1. Adhesives & Sealants
- 5.2.2. Paints & Coatings
- 5.2.3. Inks
- 5.2.4. Personal Care
- 5.2.5. Other Applications (Decoloring, Polymer, etc.)
- 5.3. Market Analysis, Insights and Forecast - by Region
- 5.3.1. Asia Pacific
- 5.3.2. North America
- 5.3.3. Europe
- 5.3.4. South America
- 5.3.5. Middle East and Africa
- 5.1. Market Analysis, Insights and Forecast - by Type
- 6. Asia Pacific Coalescing Agents Market Analysis, Insights and Forecast, 2019-2031
- 6.1. Market Analysis, Insights and Forecast - by Type
- 6.1.1. Hydrophilic
- 6.1.2. Hydrophobic
- 6.2. Market Analysis, Insights and Forecast - by Application
- 6.2.1. Adhesives & Sealants
- 6.2.2. Paints & Coatings
- 6.2.3. Inks
- 6.2.4. Personal Care
- 6.2.5. Other Applications (Decoloring, Polymer, etc.)
- 6.1. Market Analysis, Insights and Forecast - by Type
- 7. North America Coalescing Agents Market Analysis, Insights and Forecast, 2019-2031
- 7.1. Market Analysis, Insights and Forecast - by Type
- 7.1.1. Hydrophilic
- 7.1.2. Hydrophobic
- 7.2. Market Analysis, Insights and Forecast - by Application
- 7.2.1. Adhesives & Sealants
- 7.2.2. Paints & Coatings
- 7.2.3. Inks
- 7.2.4. Personal Care
- 7.2.5. Other Applications (Decoloring, Polymer, etc.)
- 7.1. Market Analysis, Insights and Forecast - by Type
- 8. Europe Coalescing Agents Market Analysis, Insights and Forecast, 2019-2031
- 8.1. Market Analysis, Insights and Forecast - by Type
- 8.1.1. Hydrophilic
- 8.1.2. Hydrophobic
- 8.2. Market Analysis, Insights and Forecast - by Application
- 8.2.1. Adhesives & Sealants
- 8.2.2. Paints & Coatings
- 8.2.3. Inks
- 8.2.4. Personal Care
- 8.2.5. Other Applications (Decoloring, Polymer, etc.)
- 8.1. Market Analysis, Insights and Forecast - by Type
- 9. South America Coalescing Agents Market Analysis, Insights and Forecast, 2019-2031
- 9.1. Market Analysis, Insights and Forecast - by Type
- 9.1.1. Hydrophilic
- 9.1.2. Hydrophobic
- 9.2. Market Analysis, Insights and Forecast - by Application
- 9.2.1. Adhesives & Sealants
- 9.2.2. Paints & Coatings
- 9.2.3. Inks
- 9.2.4. Personal Care
- 9.2.5. Other Applications (Decoloring, Polymer, etc.)
- 9.1. Market Analysis, Insights and Forecast - by Type
- 10. Middle East and Africa Coalescing Agents Market Analysis, Insights and Forecast, 2019-2031
- 10.1. Market Analysis, Insights and Forecast - by Type
- 10.1.1. Hydrophilic
- 10.1.2. Hydrophobic
- 10.2. Market Analysis, Insights and Forecast - by Application
- 10.2.1. Adhesives & Sealants
- 10.2.2. Paints & Coatings
- 10.2.3. Inks
- 10.2.4. Personal Care
- 10.2.5. Other Applications (Decoloring, Polymer, etc.)
- 10.1. Market Analysis, Insights and Forecast - by Type
- 11. North America Coalescing Agents Market Analysis, Insights and Forecast, 2019-2031
- 11.1. Market Analysis, Insights and Forecast - By Country/Sub-region
- 11.1.1 United States
- 11.1.2 Canada
- 11.1.3 Mexico
- 12. Europe Coalescing Agents Market Analysis, Insights and Forecast, 2019-2031
- 12.1. Market Analysis, Insights and Forecast - By Country/Sub-region
- 12.1.1 Germany
- 12.1.2 France
- 12.1.3 Italy
- 12.1.4 United Kingdom
- 12.1.5 Netherlands
- 12.1.6 Rest of Europe
- 13. Asia Pacific Coalescing Agents Market Analysis, Insights and Forecast, 2019-2031
- 13.1. Market Analysis, Insights and Forecast - By Country/Sub-region
- 13.1.1 China
- 13.1.2 Japan
- 13.1.3 India
- 13.1.4 South Korea
- 13.1.5 Taiwan
- 13.1.6 Australia
- 13.1.7 Rest of Asia-Pacific
- 14. South America Coalescing Agents Market Analysis, Insights and Forecast, 2019-2031
- 14.1. Market Analysis, Insights and Forecast - By Country/Sub-region
- 14.1.1 Brazil
- 14.1.2 Argentina
- 14.1.3 Rest of South America
- 15. MEA Coalescing Agents Market Analysis, Insights and Forecast, 2019-2031
- 15.1. Market Analysis, Insights and Forecast - By Country/Sub-region
- 15.1.1 Middle East
- 15.1.2 Africa
- 16. Competitive Analysis
- 16.1. Global Market Share Analysis 2024
- 16.2. Company Profiles
- 16.2.1 Cargill Incorporated
- 16.2.1.1. Overview
- 16.2.1.2. Products
- 16.2.1.3. SWOT Analysis
- 16.2.1.4. Recent Developments
- 16.2.1.5. Financials (Based on Availability)
- 16.2.2 Synthomer PLC
- 16.2.2.1. Overview
- 16.2.2.2. Products
- 16.2.2.3. SWOT Analysis
- 16.2.2.4. Recent Developments
- 16.2.2.5. Financials (Based on Availability)
- 16.2.3 Cristol
- 16.2.3.1. Overview
- 16.2.3.2. Products
- 16.2.3.3. SWOT Analysis
- 16.2.3.4. Recent Developments
- 16.2.3.5. Financials (Based on Availability)
- 16.2.4 Celanese Corporation
- 16.2.4.1. Overview
- 16.2.4.2. Products
- 16.2.4.3. SWOT Analysis
- 16.2.4.4. Recent Developments
- 16.2.4.5. Financials (Based on Availability)
- 16.2.5 Stepan Company
- 16.2.5.1. Overview
- 16.2.5.2. Products
- 16.2.5.3. SWOT Analysis
- 16.2.5.4. Recent Developments
- 16.2.5.5. Financials (Based on Availability)
- 16.2.6 Runtai Chemical Co Ltd
- 16.2.6.1. Overview
- 16.2.6.2. Products
- 16.2.6.3. SWOT Analysis
- 16.2.6.4. Recent Developments
- 16.2.6.5. Financials (Based on Availability)
- 16.2.7 BASF SE
- 16.2.7.1. Overview
- 16.2.7.2. Products
- 16.2.7.3. SWOT Analysis
- 16.2.7.4. Recent Developments
- 16.2.7.5. Financials (Based on Availability)
- 16.2.8 Arkema Group
- 16.2.8.1. Overview
- 16.2.8.2. Products
- 16.2.8.3. SWOT Analysis
- 16.2.8.4. Recent Developments
- 16.2.8.5. Financials (Based on Availability)
- 16.2.9 Rudolf GmbH
- 16.2.9.1. Overview
- 16.2.9.2. Products
- 16.2.9.3. SWOT Analysis
- 16.2.9.4. Recent Developments
- 16.2.9.5. Financials (Based on Availability)
- 16.2.10 Dow
- 16.2.10.1. Overview
- 16.2.10.2. Products
- 16.2.10.3. SWOT Analysis
- 16.2.10.4. Recent Developments
- 16.2.10.5. Financials (Based on Availability)
- 16.2.11 Eastman Chemical Company
- 16.2.11.1. Overview
- 16.2.11.2. Products
- 16.2.11.3. SWOT Analysis
- 16.2.11.4. Recent Developments
- 16.2.11.5. Financials (Based on Availability)
- 16.2.1 Cargill Incorporated
List of Figures
- Figure 1: Global Coalescing Agents Market Revenue Breakdown (Million, %) by Region 2024 & 2032
- Figure 2: Global Coalescing Agents Market Volume Breakdown (K Tons, %) by Region 2024 & 2032
- Figure 3: North America Coalescing Agents Market Revenue (Million), by Country 2024 & 2032
- Figure 4: North America Coalescing Agents Market Volume (K Tons), by Country 2024 & 2032
- Figure 5: North America Coalescing Agents Market Revenue Share (%), by Country 2024 & 2032
- Figure 6: North America Coalescing Agents Market Volume Share (%), by Country 2024 & 2032
- Figure 7: Europe Coalescing Agents Market Revenue (Million), by Country 2024 & 2032
- Figure 8: Europe Coalescing Agents Market Volume (K Tons), by Country 2024 & 2032
- Figure 9: Europe Coalescing Agents Market Revenue Share (%), by Country 2024 & 2032
- Figure 10: Europe Coalescing Agents Market Volume Share (%), by Country 2024 & 2032
- Figure 11: Asia Pacific Coalescing Agents Market Revenue (Million), by Country 2024 & 2032
- Figure 12: Asia Pacific Coalescing Agents Market Volume (K Tons), by Country 2024 & 2032
- Figure 13: Asia Pacific Coalescing Agents Market Revenue Share (%), by Country 2024 & 2032
- Figure 14: Asia Pacific Coalescing Agents Market Volume Share (%), by Country 2024 & 2032
- Figure 15: South America Coalescing Agents Market Revenue (Million), by Country 2024 & 2032
- Figure 16: South America Coalescing Agents Market Volume (K Tons), by Country 2024 & 2032
- Figure 17: South America Coalescing Agents Market Revenue Share (%), by Country 2024 & 2032
- Figure 18: South America Coalescing Agents Market Volume Share (%), by Country 2024 & 2032
- Figure 19: MEA Coalescing Agents Market Revenue (Million), by Country 2024 & 2032
- Figure 20: MEA Coalescing Agents Market Volume (K Tons), by Country 2024 & 2032
- Figure 21: MEA Coalescing Agents Market Revenue Share (%), by Country 2024 & 2032
- Figure 22: MEA Coalescing Agents Market Volume Share (%), by Country 2024 & 2032
- Figure 23: Asia Pacific Coalescing Agents Market Revenue (Million), by Type 2024 & 2032
- Figure 24: Asia Pacific Coalescing Agents Market Volume (K Tons), by Type 2024 & 2032
- Figure 25: Asia Pacific Coalescing Agents Market Revenue Share (%), by Type 2024 & 2032
- Figure 26: Asia Pacific Coalescing Agents Market Volume Share (%), by Type 2024 & 2032
- Figure 27: Asia Pacific Coalescing Agents Market Revenue (Million), by Application 2024 & 2032
- Figure 28: Asia Pacific Coalescing Agents Market Volume (K Tons), by Application 2024 & 2032
- Figure 29: Asia Pacific Coalescing Agents Market Revenue Share (%), by Application 2024 & 2032
- Figure 30: Asia Pacific Coalescing Agents Market Volume Share (%), by Application 2024 & 2032
- Figure 31: Asia Pacific Coalescing Agents Market Revenue (Million), by Country 2024 & 2032
- Figure 32: Asia Pacific Coalescing Agents Market Volume (K Tons), by Country 2024 & 2032
- Figure 33: Asia Pacific Coalescing Agents Market Revenue Share (%), by Country 2024 & 2032
- Figure 34: Asia Pacific Coalescing Agents Market Volume Share (%), by Country 2024 & 2032
- Figure 35: North America Coalescing Agents Market Revenue (Million), by Type 2024 & 2032
- Figure 36: North America Coalescing Agents Market Volume (K Tons), by Type 2024 & 2032
- Figure 37: North America Coalescing Agents Market Revenue Share (%), by Type 2024 & 2032
- Figure 38: North America Coalescing Agents Market Volume Share (%), by Type 2024 & 2032
- Figure 39: North America Coalescing Agents Market Revenue (Million), by Application 2024 & 2032
- Figure 40: North America Coalescing Agents Market Volume (K Tons), by Application 2024 & 2032
- Figure 41: North America Coalescing Agents Market Revenue Share (%), by Application 2024 & 2032
- Figure 42: North America Coalescing Agents Market Volume Share (%), by Application 2024 & 2032
- Figure 43: North America Coalescing Agents Market Revenue (Million), by Country 2024 & 2032
- Figure 44: North America Coalescing Agents Market Volume (K Tons), by Country 2024 & 2032
- Figure 45: North America Coalescing Agents Market Revenue Share (%), by Country 2024 & 2032
- Figure 46: North America Coalescing Agents Market Volume Share (%), by Country 2024 & 2032
- Figure 47: Europe Coalescing Agents Market Revenue (Million), by Type 2024 & 2032
- Figure 48: Europe Coalescing Agents Market Volume (K Tons), by Type 2024 & 2032
- Figure 49: Europe Coalescing Agents Market Revenue Share (%), by Type 2024 & 2032
- Figure 50: Europe Coalescing Agents Market Volume Share (%), by Type 2024 & 2032
- Figure 51: Europe Coalescing Agents Market Revenue (Million), by Application 2024 & 2032
- Figure 52: Europe Coalescing Agents Market Volume (K Tons), by Application 2024 & 2032
- Figure 53: Europe Coalescing Agents Market Revenue Share (%), by Application 2024 & 2032
- Figure 54: Europe Coalescing Agents Market Volume Share (%), by Application 2024 & 2032
- Figure 55: Europe Coalescing Agents Market Revenue (Million), by Country 2024 & 2032
- Figure 56: Europe Coalescing Agents Market Volume (K Tons), by Country 2024 & 2032
- Figure 57: Europe Coalescing Agents Market Revenue Share (%), by Country 2024 & 2032
- Figure 58: Europe Coalescing Agents Market Volume Share (%), by Country 2024 & 2032
- Figure 59: South America Coalescing Agents Market Revenue (Million), by Type 2024 & 2032
- Figure 60: South America Coalescing Agents Market Volume (K Tons), by Type 2024 & 2032
- Figure 61: South America Coalescing Agents Market Revenue Share (%), by Type 2024 & 2032
- Figure 62: South America Coalescing Agents Market Volume Share (%), by Type 2024 & 2032
- Figure 63: South America Coalescing Agents Market Revenue (Million), by Application 2024 & 2032
- Figure 64: South America Coalescing Agents Market Volume (K Tons), by Application 2024 & 2032
- Figure 65: South America Coalescing Agents Market Revenue Share (%), by Application 2024 & 2032
- Figure 66: South America Coalescing Agents Market Volume Share (%), by Application 2024 & 2032
- Figure 67: South America Coalescing Agents Market Revenue (Million), by Country 2024 & 2032
- Figure 68: South America Coalescing Agents Market Volume (K Tons), by Country 2024 & 2032
- Figure 69: South America Coalescing Agents Market Revenue Share (%), by Country 2024 & 2032
- Figure 70: South America Coalescing Agents Market Volume Share (%), by Country 2024 & 2032
- Figure 71: Middle East and Africa Coalescing Agents Market Revenue (Million), by Type 2024 & 2032
- Figure 72: Middle East and Africa Coalescing Agents Market Volume (K Tons), by Type 2024 & 2032
- Figure 73: Middle East and Africa Coalescing Agents Market Revenue Share (%), by Type 2024 & 2032
- Figure 74: Middle East and Africa Coalescing Agents Market Volume Share (%), by Type 2024 & 2032
- Figure 75: Middle East and Africa Coalescing Agents Market Revenue (Million), by Application 2024 & 2032
- Figure 76: Middle East and Africa Coalescing Agents Market Volume (K Tons), by Application 2024 & 2032
- Figure 77: Middle East and Africa Coalescing Agents Market Revenue Share (%), by Application 2024 & 2032
- Figure 78: Middle East and Africa Coalescing Agents Market Volume Share (%), by Application 2024 & 2032
- Figure 79: Middle East and Africa Coalescing Agents Market Revenue (Million), by Country 2024 & 2032
- Figure 80: Middle East and Africa Coalescing Agents Market Volume (K Tons), by Country 2024 & 2032
- Figure 81: Middle East and Africa Coalescing Agents Market Revenue Share (%), by Country 2024 & 2032
- Figure 82: Middle East and Africa Coalescing Agents Market Volume Share (%), by Country 2024 & 2032
List of Tables
- Table 1: Global Coalescing Agents Market Revenue Million Forecast, by Region 2019 & 2032
- Table 2: Global Coalescing Agents Market Volume K Tons Forecast, by Region 2019 & 2032
- Table 3: Global Coalescing Agents Market Revenue Million Forecast, by Type 2019 & 2032
- Table 4: Global Coalescing Agents Market Volume K Tons Forecast, by Type 2019 & 2032
- Table 5: Global Coalescing Agents Market Revenue Million Forecast, by Application 2019 & 2032
- Table 6: Global Coalescing Agents Market Volume K Tons Forecast, by Application 2019 & 2032
- Table 7: Global Coalescing Agents Market Revenue Million Forecast, by Region 2019 & 2032
- Table 8: Global Coalescing Agents Market Volume K Tons Forecast, by Region 2019 & 2032
- Table 9: Global Coalescing Agents Market Revenue Million Forecast, by Country 2019 & 2032
- Table 10: Global Coalescing Agents Market Volume K Tons Forecast, by Country 2019 & 2032
- Table 11: United States Coalescing Agents Market Revenue (Million) Forecast, by Application 2019 & 2032
- Table 12: United States Coalescing Agents Market Volume (K Tons) Forecast, by Application 2019 & 2032
- Table 13: Canada Coalescing Agents Market Revenue (Million) Forecast, by Application 2019 & 2032
- Table 14: Canada Coalescing Agents Market Volume (K Tons) Forecast, by Application 2019 & 2032
- Table 15: Mexico Coalescing Agents Market Revenue (Million) Forecast, by Application 2019 & 2032
- Table 16: Mexico Coalescing Agents Market Volume (K Tons) Forecast, by Application 2019 & 2032
- Table 17: Global Coalescing Agents Market Revenue Million Forecast, by Country 2019 & 2032
- Table 18: Global Coalescing Agents Market Volume K Tons Forecast, by Country 2019 & 2032
- Table 19: Germany Coalescing Agents Market Revenue (Million) Forecast, by Application 2019 & 2032
- Table 20: Germany Coalescing Agents Market Volume (K Tons) Forecast, by Application 2019 & 2032
- Table 21: France Coalescing Agents Market Revenue (Million) Forecast, by Application 2019 & 2032
- Table 22: France Coalescing Agents Market Volume (K Tons) Forecast, by Application 2019 & 2032
- Table 23: Italy Coalescing Agents Market Revenue (Million) Forecast, by Application 2019 & 2032
- Table 24: Italy Coalescing Agents Market Volume (K Tons) Forecast, by Application 2019 & 2032
- Table 25: United Kingdom Coalescing Agents Market Revenue (Million) Forecast, by Application 2019 & 2032
- Table 26: United Kingdom Coalescing Agents Market Volume (K Tons) Forecast, by Application 2019 & 2032
- Table 27: Netherlands Coalescing Agents Market Revenue (Million) Forecast, by Application 2019 & 2032
- Table 28: Netherlands Coalescing Agents Market Volume (K Tons) Forecast, by Application 2019 & 2032
- Table 29: Rest of Europe Coalescing Agents Market Revenue (Million) Forecast, by Application 2019 & 2032
- Table 30: Rest of Europe Coalescing Agents Market Volume (K Tons) Forecast, by Application 2019 & 2032
- Table 31: Global Coalescing Agents Market Revenue Million Forecast, by Country 2019 & 2032
- Table 32: Global Coalescing Agents Market Volume K Tons Forecast, by Country 2019 & 2032
- Table 33: China Coalescing Agents Market Revenue (Million) Forecast, by Application 2019 & 2032
- Table 34: China Coalescing Agents Market Volume (K Tons) Forecast, by Application 2019 & 2032
- Table 35: Japan Coalescing Agents Market Revenue (Million) Forecast, by Application 2019 & 2032
- Table 36: Japan Coalescing Agents Market Volume (K Tons) Forecast, by Application 2019 & 2032
- Table 37: India Coalescing Agents Market Revenue (Million) Forecast, by Application 2019 & 2032
- Table 38: India Coalescing Agents Market Volume (K Tons) Forecast, by Application 2019 & 2032
- Table 39: South Korea Coalescing Agents Market Revenue (Million) Forecast, by Application 2019 & 2032
- Table 40: South Korea Coalescing Agents Market Volume (K Tons) Forecast, by Application 2019 & 2032
- Table 41: Taiwan Coalescing Agents Market Revenue (Million) Forecast, by Application 2019 & 2032
- Table 42: Taiwan Coalescing Agents Market Volume (K Tons) Forecast, by Application 2019 & 2032
- Table 43: Australia Coalescing Agents Market Revenue (Million) Forecast, by Application 2019 & 2032
- Table 44: Australia Coalescing Agents Market Volume (K Tons) Forecast, by Application 2019 & 2032
- Table 45: Rest of Asia-Pacific Coalescing Agents Market Revenue (Million) Forecast, by Application 2019 & 2032
- Table 46: Rest of Asia-Pacific Coalescing Agents Market Volume (K Tons) Forecast, by Application 2019 & 2032
- Table 47: Global Coalescing Agents Market Revenue Million Forecast, by Country 2019 & 2032
- Table 48: Global Coalescing Agents Market Volume K Tons Forecast, by Country 2019 & 2032
- Table 49: Brazil Coalescing Agents Market Revenue (Million) Forecast, by Application 2019 & 2032
- Table 50: Brazil Coalescing Agents Market Volume (K Tons) Forecast, by Application 2019 & 2032
- Table 51: Argentina Coalescing Agents Market Revenue (Million) Forecast, by Application 2019 & 2032
- Table 52: Argentina Coalescing Agents Market Volume (K Tons) Forecast, by Application 2019 & 2032
- Table 53: Rest of South America Coalescing Agents Market Revenue (Million) Forecast, by Application 2019 & 2032
- Table 54: Rest of South America Coalescing Agents Market Volume (K Tons) Forecast, by Application 2019 & 2032
- Table 55: Global Coalescing Agents Market Revenue Million Forecast, by Country 2019 & 2032
- Table 56: Global Coalescing Agents Market Volume K Tons Forecast, by Country 2019 & 2032
- Table 57: Middle East Coalescing Agents Market Revenue (Million) Forecast, by Application 2019 & 2032
- Table 58: Middle East Coalescing Agents Market Volume (K Tons) Forecast, by Application 2019 & 2032
- Table 59: Africa Coalescing Agents Market Revenue (Million) Forecast, by Application 2019 & 2032
- Table 60: Africa Coalescing Agents Market Volume (K Tons) Forecast, by Application 2019 & 2032
- Table 61: Global Coalescing Agents Market Revenue Million Forecast, by Type 2019 & 2032
- Table 62: Global Coalescing Agents Market Volume K Tons Forecast, by Type 2019 & 2032
- Table 63: Global Coalescing Agents Market Revenue Million Forecast, by Application 2019 & 2032
- Table 64: Global Coalescing Agents Market Volume K Tons Forecast, by Application 2019 & 2032
- Table 65: Global Coalescing Agents Market Revenue Million Forecast, by Country 2019 & 2032
- Table 66: Global Coalescing Agents Market Volume K Tons Forecast, by Country 2019 & 2032
- Table 67: China Coalescing Agents Market Revenue (Million) Forecast, by Application 2019 & 2032
- Table 68: China Coalescing Agents Market Volume (K Tons) Forecast, by Application 2019 & 2032
- Table 69: India Coalescing Agents Market Revenue (Million) Forecast, by Application 2019 & 2032
- Table 70: India Coalescing Agents Market Volume (K Tons) Forecast, by Application 2019 & 2032
- Table 71: Japan Coalescing Agents Market Revenue (Million) Forecast, by Application 2019 & 2032
- Table 72: Japan Coalescing Agents Market Volume (K Tons) Forecast, by Application 2019 & 2032
- Table 73: South Korea Coalescing Agents Market Revenue (Million) Forecast, by Application 2019 & 2032
- Table 74: South Korea Coalescing Agents Market Volume (K Tons) Forecast, by Application 2019 & 2032
- Table 75: Malaysia Coalescing Agents Market Revenue (Million) Forecast, by Application 2019 & 2032
- Table 76: Malaysia Coalescing Agents Market Volume (K Tons) Forecast, by Application 2019 & 2032
- Table 77: Thailand Coalescing Agents Market Revenue (Million) Forecast, by Application 2019 & 2032
- Table 78: Thailand Coalescing Agents Market Volume (K Tons) Forecast, by Application 2019 & 2032
- Table 79: Indonesia Coalescing Agents Market Revenue (Million) Forecast, by Application 2019 & 2032
- Table 80: Indonesia Coalescing Agents Market Volume (K Tons) Forecast, by Application 2019 & 2032
- Table 81: Vietnam Coalescing Agents Market Revenue (Million) Forecast, by Application 2019 & 2032
- Table 82: Vietnam Coalescing Agents Market Volume (K Tons) Forecast, by Application 2019 & 2032
- Table 83: Rest of Asia Pacific Coalescing Agents Market Revenue (Million) Forecast, by Application 2019 & 2032
- Table 84: Rest of Asia Pacific Coalescing Agents Market Volume (K Tons) Forecast, by Application 2019 & 2032
- Table 85: Global Coalescing Agents Market Revenue Million Forecast, by Type 2019 & 2032
- Table 86: Global Coalescing Agents Market Volume K Tons Forecast, by Type 2019 & 2032
- Table 87: Global Coalescing Agents Market Revenue Million Forecast, by Application 2019 & 2032
- Table 88: Global Coalescing Agents Market Volume K Tons Forecast, by Application 2019 & 2032
- Table 89: Global Coalescing Agents Market Revenue Million Forecast, by Country 2019 & 2032
- Table 90: Global Coalescing Agents Market Volume K Tons Forecast, by Country 2019 & 2032
- Table 91: United States Coalescing Agents Market Revenue (Million) Forecast, by Application 2019 & 2032
- Table 92: United States Coalescing Agents Market Volume (K Tons) Forecast, by Application 2019 & 2032
- Table 93: Canada Coalescing Agents Market Revenue (Million) Forecast, by Application 2019 & 2032
- Table 94: Canada Coalescing Agents Market Volume (K Tons) Forecast, by Application 2019 & 2032
- Table 95: Mexico Coalescing Agents Market Revenue (Million) Forecast, by Application 2019 & 2032
- Table 96: Mexico Coalescing Agents Market Volume (K Tons) Forecast, by Application 2019 & 2032
- Table 97: Global Coalescing Agents Market Revenue Million Forecast, by Type 2019 & 2032
- Table 98: Global Coalescing Agents Market Volume K Tons Forecast, by Type 2019 & 2032
- Table 99: Global Coalescing Agents Market Revenue Million Forecast, by Application 2019 & 2032
- Table 100: Global Coalescing Agents Market Volume K Tons Forecast, by Application 2019 & 2032
- Table 101: Global Coalescing Agents Market Revenue Million Forecast, by Country 2019 & 2032
- Table 102: Global Coalescing Agents Market Volume K Tons Forecast, by Country 2019 & 2032
- Table 103: Germany Coalescing Agents Market Revenue (Million) Forecast, by Application 2019 & 2032
- Table 104: Germany Coalescing Agents Market Volume (K Tons) Forecast, by Application 2019 & 2032
- Table 105: United Kingdom Coalescing Agents Market Revenue (Million) Forecast, by Application 2019 & 2032
- Table 106: United Kingdom Coalescing Agents Market Volume (K Tons) Forecast, by Application 2019 & 2032
- Table 107: Italy Coalescing Agents Market Revenue (Million) Forecast, by Application 2019 & 2032
- Table 108: Italy Coalescing Agents Market Volume (K Tons) Forecast, by Application 2019 & 2032
- Table 109: France Coalescing Agents Market Revenue (Million) Forecast, by Application 2019 & 2032
- Table 110: France Coalescing Agents Market Volume (K Tons) Forecast, by Application 2019 & 2032
- Table 111: Spain Coalescing Agents Market Revenue (Million) Forecast, by Application 2019 & 2032
- Table 112: Spain Coalescing Agents Market Volume (K Tons) Forecast, by Application 2019 & 2032
- Table 113: NORDIC Countries Coalescing Agents Market Revenue (Million) Forecast, by Application 2019 & 2032
- Table 114: NORDIC Countries Coalescing Agents Market Volume (K Tons) Forecast, by Application 2019 & 2032
- Table 115: Turkey Coalescing Agents Market Revenue (Million) Forecast, by Application 2019 & 2032
- Table 116: Turkey Coalescing Agents Market Volume (K Tons) Forecast, by Application 2019 & 2032
- Table 117: Russia Coalescing Agents Market Revenue (Million) Forecast, by Application 2019 & 2032
- Table 118: Russia Coalescing Agents Market Volume (K Tons) Forecast, by Application 2019 & 2032
- Table 119: Rest of Europe Coalescing Agents Market Revenue (Million) Forecast, by Application 2019 & 2032
- Table 120: Rest of Europe Coalescing Agents Market Volume (K Tons) Forecast, by Application 2019 & 2032
- Table 121: Global Coalescing Agents Market Revenue Million Forecast, by Type 2019 & 2032
- Table 122: Global Coalescing Agents Market Volume K Tons Forecast, by Type 2019 & 2032
- Table 123: Global Coalescing Agents Market Revenue Million Forecast, by Application 2019 & 2032
- Table 124: Global Coalescing Agents Market Volume K Tons Forecast, by Application 2019 & 2032
- Table 125: Global Coalescing Agents Market Revenue Million Forecast, by Country 2019 & 2032
- Table 126: Global Coalescing Agents Market Volume K Tons Forecast, by Country 2019 & 2032
- Table 127: Brazil Coalescing Agents Market Revenue (Million) Forecast, by Application 2019 & 2032
- Table 128: Brazil Coalescing Agents Market Volume (K Tons) Forecast, by Application 2019 & 2032
- Table 129: Argentina Coalescing Agents Market Revenue (Million) Forecast, by Application 2019 & 2032
- Table 130: Argentina Coalescing Agents Market Volume (K Tons) Forecast, by Application 2019 & 2032
- Table 131: Colombia Coalescing Agents Market Revenue (Million) Forecast, by Application 2019 & 2032
- Table 132: Colombia Coalescing Agents Market Volume (K Tons) Forecast, by Application 2019 & 2032
- Table 133: Rest of South America Coalescing Agents Market Revenue (Million) Forecast, by Application 2019 & 2032
- Table 134: Rest of South America Coalescing Agents Market Volume (K Tons) Forecast, by Application 2019 & 2032
- Table 135: Global Coalescing Agents Market Revenue Million Forecast, by Type 2019 & 2032
- Table 136: Global Coalescing Agents Market Volume K Tons Forecast, by Type 2019 & 2032
- Table 137: Global Coalescing Agents Market Revenue Million Forecast, by Application 2019 & 2032
- Table 138: Global Coalescing Agents Market Volume K Tons Forecast, by Application 2019 & 2032
- Table 139: Global Coalescing Agents Market Revenue Million Forecast, by Country 2019 & 2032
- Table 140: Global Coalescing Agents Market Volume K Tons Forecast, by Country 2019 & 2032
- Table 141: Saudi Arabia Coalescing Agents Market Revenue (Million) Forecast, by Application 2019 & 2032
- Table 142: Saudi Arabia Coalescing Agents Market Volume (K Tons) Forecast, by Application 2019 & 2032
- Table 143: South Africa Coalescing Agents Market Revenue (Million) Forecast, by Application 2019 & 2032
- Table 144: South Africa Coalescing Agents Market Volume (K Tons) Forecast, by Application 2019 & 2032
- Table 145: Nigeria Coalescing Agents Market Revenue (Million) Forecast, by Application 2019 & 2032
- Table 146: Nigeria Coalescing Agents Market Volume (K Tons) Forecast, by Application 2019 & 2032
- Table 147: Qatar Coalescing Agents Market Revenue (Million) Forecast, by Application 2019 & 2032
- Table 148: Qatar Coalescing Agents Market Volume (K Tons) Forecast, by Application 2019 & 2032
- Table 149: Egypt Coalescing Agents Market Revenue (Million) Forecast, by Application 2019 & 2032
- Table 150: Egypt Coalescing Agents Market Volume (K Tons) Forecast, by Application 2019 & 2032
- Table 151: United Arab Emirates Coalescing Agents Market Revenue (Million) Forecast, by Application 2019 & 2032
- Table 152: United Arab Emirates Coalescing Agents Market Volume (K Tons) Forecast, by Application 2019 & 2032
- Table 153: Rest of Middle East and Africa Coalescing Agents Market Revenue (Million) Forecast, by Application 2019 & 2032
- Table 154: Rest of Middle East and Africa Coalescing Agents Market Volume (K Tons) Forecast, by Application 2019 & 2032
Frequently Asked Questions
1. What is the projected Compound Annual Growth Rate (CAGR) of the Coalescing Agents Market?
The projected CAGR is approximately 4.96%.
2. Which companies are prominent players in the Coalescing Agents Market?
Key companies in the market include Cargill Incorporated, Synthomer PLC, Cristol, Celanese Corporation, Stepan Company, Runtai Chemical Co Ltd, BASF SE, Arkema Group, Rudolf GmbH, Dow, Eastman Chemical Company.
3. What are the main segments of the Coalescing Agents Market?
The market segments include Type, Application.
4. Can you provide details about the market size?
The market size is estimated to be USD 1.12 Million as of 2022.
5. What are some drivers contributing to market growth?
Increasing Usage in Personal Care Items; Rising Demand for Architectural and Industrial Coatings in Asia; Other Drivers.
6. What are the notable trends driving market growth?
Increasing Demand from Paints and Coatings Segment.
7. Are there any restraints impacting market growth?
Stringent Environmemtal Regulations; Other Restraints.
8. Can you provide examples of recent developments in the market?
N/A
9. What pricing options are available for accessing the report?
Pricing options include single-user, multi-user, and enterprise licenses priced at USD 4750, USD 5250, and USD 8750 respectively.
10. Is the market size provided in terms of value or volume?
The market size is provided in terms of value, measured in Million and volume, measured in K Tons.
11. Are there any specific market keywords associated with the report?
Yes, the market keyword associated with the report is "Coalescing Agents Market," which aids in identifying and referencing the specific market segment covered.
12. How do I determine which pricing option suits my needs best?
The pricing options vary based on user requirements and access needs. Individual users may opt for single-user licenses, while businesses requiring broader access may choose multi-user or enterprise licenses for cost-effective access to the report.
13. Are there any additional resources or data provided in the Coalescing Agents Market report?
While the report offers comprehensive insights, it's advisable to review the specific contents or supplementary materials provided to ascertain if additional resources or data are available.
14. How can I stay updated on further developments or reports in the Coalescing Agents Market?
To stay informed about further developments, trends, and reports in the Coalescing Agents Market, consider subscribing to industry newsletters, following relevant companies and organizations, or regularly checking reputable industry news sources and publications.
Methodology
Step 1 - Identification of Relevant Samples Size from Population Database


Step 2 - Approaches for Defining Global Market Size (Value, Volume* & Price*)

Note*: In applicable scenarios
Step 3 - Data Sources
Primary Research
- Web Analytics
- Survey Reports
- Research Institute
- Latest Research Reports
- Opinion Leaders
Secondary Research
- Annual Reports
- White Paper
- Latest Press Release
- Industry Association
- Paid Database
- Investor Presentations

Step 4 - Data Triangulation
Involves using different sources of information in order to increase the validity of a study
These sources are likely to be stakeholders in a program - participants, other researchers, program staff, other community members, and so on.
Then we put all data in single framework & apply various statistical tools to find out the dynamic on the market.
During the analysis stage, feedback from the stakeholder groups would be compared to determine areas of agreement as well as areas of divergence
