

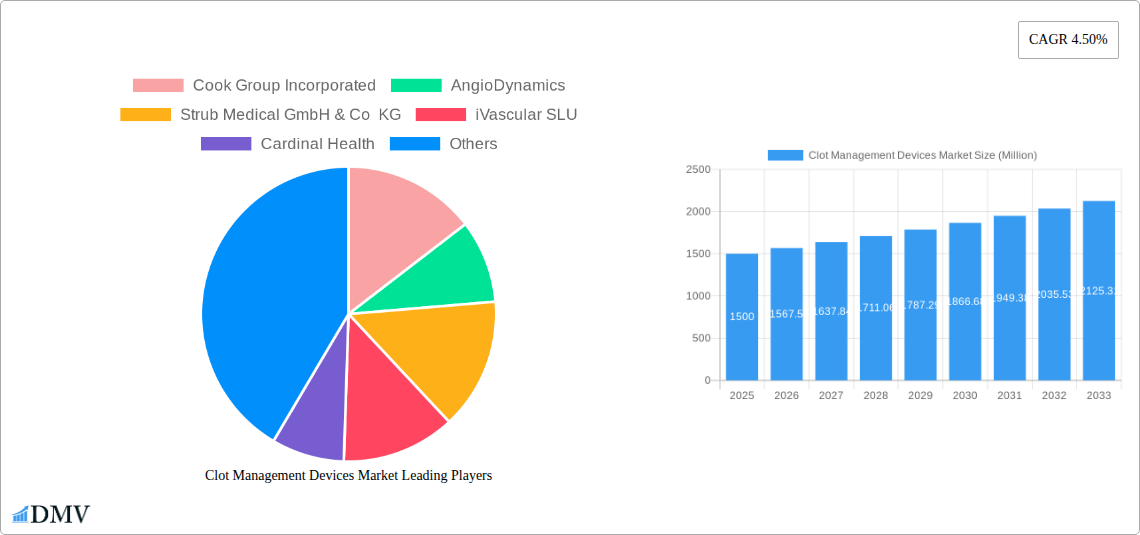
Key Insights
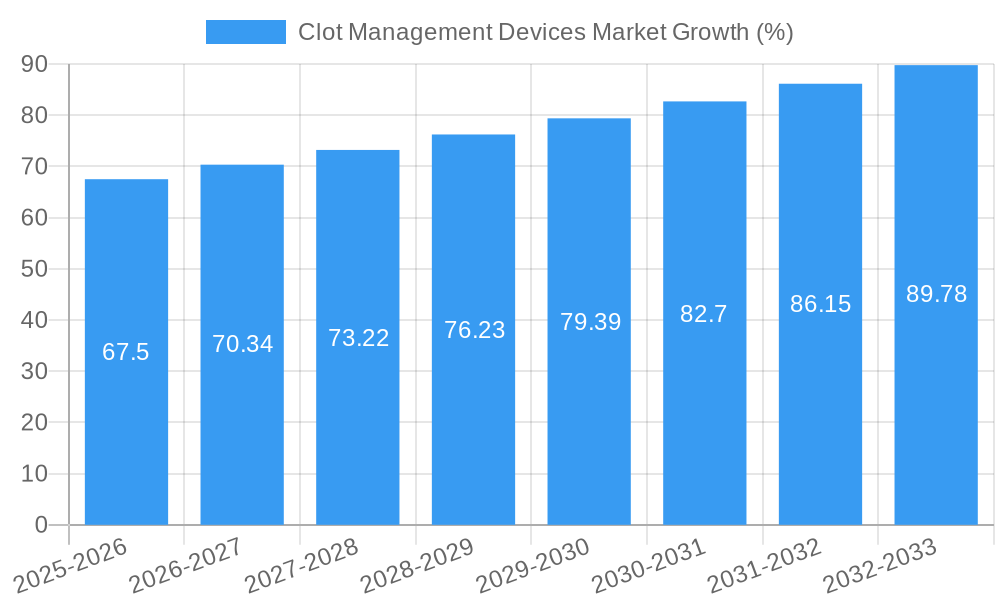
The global clot management devices market is experiencing steady growth, projected to reach a significant size by 2033. A compound annual growth rate (CAGR) of 4.50% from 2025 to 2033 indicates a consistent expansion driven by several key factors. The increasing prevalence of cardiovascular diseases, thromboembolic events, and strokes fuels demand for effective clot management solutions. Technological advancements in minimally invasive procedures, such as improved catheter designs and thrombectomy devices, contribute significantly to market growth. Furthermore, the rising geriatric population, a demographic highly susceptible to clotting disorders, further propels market expansion. The market is segmented by product type, encompassing embolectomy balloon catheters, catheter-directed thrombolysis devices, percutaneous thrombectomy devices, inferior vena cava filters, and neurovascular embolectomy devices. These segments demonstrate varying growth trajectories based on technological innovation and clinical adoption rates. Hospitals and ambulatory surgical centers represent the primary end-users, reflecting the prevalent need for sophisticated clot management interventions within these settings. Leading market players, including Cook Group Incorporated, AngioDynamics, and Medtronic Plc, are actively engaged in research and development, striving for improved device efficacy and safety profiles. Competitive dynamics, fueled by innovation and strategic partnerships, further shape market evolution.
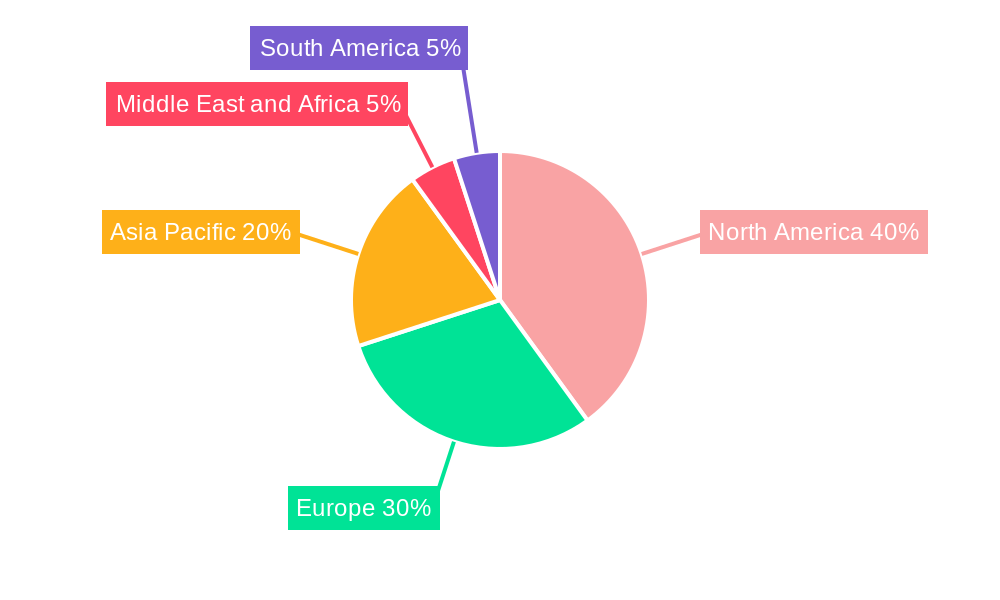
Geographical segmentation reveals diverse market performances across regions. North America and Europe currently hold significant market shares, driven by established healthcare infrastructure and high prevalence of target diseases. However, the Asia-Pacific region is projected to witness substantial growth due to increasing healthcare expenditure, rising awareness of cardiovascular diseases, and expanding medical infrastructure. Despite the positive outlook, certain restraints, such as high device costs and procedural complexities, might partially impede market growth. Nevertheless, the overall trend points towards a robust and expanding market driven by technological advancements, rising disease prevalence, and increasing healthcare investments. The market's future growth hinges on the continued innovation in device technology, affordability improvements, and expansion of advanced medical care across diverse global regions.
Clot Management Devices Market: A Comprehensive Report (2019-2033)
This insightful report provides a detailed analysis of the global Clot Management Devices market, encompassing historical data (2019-2024), the base year (2025), and a comprehensive forecast (2025-2033). Valued at xx Million in 2025, the market is poised for significant growth, driven by technological advancements and increasing prevalence of thromboembolic diseases. This report offers crucial insights for stakeholders, including manufacturers, investors, and healthcare professionals, seeking to navigate this dynamic market landscape.
Clot Management Devices Market Composition & Trends
The Clot Management Devices market is characterized by a moderately concentrated landscape, with key players such as Cook Group Incorporated, AngioDynamics, and Medtronic Plc holding significant market share. The market share distribution is dynamic, influenced by continuous product innovation and strategic mergers and acquisitions (M&A). Innovation is a key catalyst, with ongoing research and development focused on minimally invasive techniques and improved clot removal efficacy. The regulatory landscape, varying across different geographies, significantly influences market access and adoption. Substitute products, such as thrombolytic drugs, also compete for market share, impacting overall market growth. The primary end-users are hospitals and ambulatory surgical centers, with a growing segment of other end-users including specialized clinics and home healthcare providers. M&A activities have been significant, with deal values exceeding xx Million in recent years, indicating strategic consolidation within the industry.
- Market Concentration: Moderately concentrated, with top players holding xx% of market share.
- Innovation Catalysts: Minimally invasive techniques, improved clot removal efficacy, and AI-driven diagnostic tools.
- Regulatory Landscape: Stringent regulations impacting market access, varying by region.
- Substitute Products: Thrombolytic drugs and other anticoagulants.
- End-User Profile: Hospitals (xx%), Ambulatory Surgical Centers (xx%), Other End Users (xx%).
- M&A Activity: xx Million in deal values over the past five years.
Clot Management Devices Market Industry Evolution
The Clot Management Devices market has experienced consistent growth over the historical period (2019-2024), with a Compound Annual Growth Rate (CAGR) of xx%. This growth is primarily attributed to an aging population, rising prevalence of cardiovascular diseases, and increased awareness of thromboembolic disorders. Technological advancements, such as the development of advanced thrombectomy devices and improved catheter designs, have further fueled market expansion. The market is witnessing a shift towards minimally invasive procedures, driven by patient preference for reduced recovery times and improved outcomes. Consumer demand is increasingly focused on enhanced device safety, efficacy, and ease of use. Adoption of innovative technologies like catheter-directed thrombolysis and embolic protection devices is steadily increasing, contributing to the market's positive growth trajectory. Future growth will likely be influenced by factors such as the development of novel biomaterials, personalized medicine approaches, and the integration of artificial intelligence (AI) in diagnostics and treatment planning.
Leading Regions, Countries, or Segments in Clot Management Devices Market
North America currently holds the largest market share due to factors such as high healthcare expenditure, advanced medical infrastructure, and a large patient population. Within product segments, Percutaneous Thrombectomy Devices show the highest growth due to their minimally invasive nature and effectiveness in treating various types of clots. Hospitals remain the dominant end-user segment, driven by the complexity of procedures and specialized medical facilities required for clot management.
- Key Drivers:
- North America: High healthcare spending, advanced medical infrastructure, large patient pool.
- Percutaneous Thrombectomy Devices: Minimally invasive nature, high efficacy.
- Hospitals: Complex procedures and specialized facilities needed.
- Dominance Factors: High prevalence of cardiovascular diseases, robust healthcare infrastructure, and strong regulatory support in North America contribute to its leading position.
Clot Management Devices Market Product Innovations
Recent product innovations focus on improving clot removal efficiency, minimizing trauma, and enhancing patient safety. New generation devices incorporate advanced materials, improved navigation systems, and integrated imaging capabilities. These innovations are aimed at optimizing treatment outcomes, reducing procedure times, and improving overall patient experience. Unique selling propositions often highlight enhanced thrombus aspiration capabilities, improved device control, and reduced complications. Technological advancements, such as the use of microcatheters and laser-assisted thrombolysis, are steadily improving the effectiveness and safety of clot management procedures.
Propelling Factors for Clot Management Devices Market Growth
Technological advancements, particularly in minimally invasive techniques and imaging technologies, are significant growth drivers. The increasing prevalence of cardiovascular and cerebrovascular diseases fuels the demand for effective clot management solutions. Favorable regulatory environments and increasing healthcare expenditure in several regions further stimulate market growth. Moreover, rising awareness among patients and physicians about the benefits of early intervention in thromboembolic events is a crucial factor.
Obstacles in the Clot Management Devices Market
Stringent regulatory approvals for new devices can significantly delay market entry and increase development costs. Supply chain disruptions, especially related to raw materials and manufacturing components, can impact device availability and market stability. Intense competition among established players and new entrants poses a challenge for maintaining market share and achieving profitability. The high cost of these advanced devices can also limit access for certain patient populations.
Future Opportunities in Clot Management Devices Market
Emerging markets in Asia-Pacific and Latin America offer substantial growth opportunities. The development of next-generation devices incorporating advanced materials, AI-powered diagnostics, and remote monitoring capabilities presents significant potential. Personalized medicine approaches, tailored to individual patient needs, are expected to drive future market growth. The integration of telehealth and remote patient monitoring technologies will further enhance the efficiency and accessibility of clot management services.
Major Players in the Clot Management Devices Market Ecosystem
- Cook Group Incorporated
- AngioDynamics
- Strub Medical GmbH & Co KG
- iVascular SLU
- Cardinal Health
- Edward Lifesciences
- LeMaitre Vascular Inc
- Medtronic Plc
- Johnson & Johnson
- Boston Scientific Corporation
- Teleflex Incorporated
- Stryker
Key Developments in Clot Management Devices Market Industry
- April 2022: Penumbra, Inc. launched its Indigo Aspiration System with Lightning 7 and Lightning 12, securing CE Mark for commercial availability in Europe. This signifies a significant advancement in single-session blood clot removal technology.
- April 2022: Medtronic launched the PRAAN registry in India, a crucial initiative for collecting real-world data on revascularization devices used in acute ischemic stroke patients. This will provide valuable insights into clinical outcomes and inform future device development and treatment strategies.
Strategic Clot Management Devices Market Forecast
The Clot Management Devices market is projected to experience significant growth over the forecast period (2025-2033), driven by technological innovations, rising prevalence of thromboembolic diseases, and increasing healthcare spending. Emerging markets and the development of advanced treatment modalities will further fuel market expansion. The focus on minimally invasive procedures and improved patient outcomes will continue to shape the market landscape. The market's potential is substantial, promising significant returns for stakeholders involved in research, development, manufacturing, and distribution of these life-saving medical devices.
Clot Management Devices Market Segmentation
-
1. Product
- 1.1. Embolectomy Balloon Catheter
- 1.2. Catheter Directed Thrombolysis Devices
- 1.3. Percutaneous Thrombectomy Devices
- 1.4. Inferior Vena cava Filters
- 1.5. Neurovascular Embolectomy Devices
-
2. End-User
- 2.1. Hospitals
- 2.2. Ambulatory Surgical Centers
- 2.3. Other End Users
Clot Management Devices Market Segmentation By Geography
-
1. North America
- 1.1. United States
- 1.2. Canada
- 1.3. Mexico
-
2. Europe
- 2.1. Germany
- 2.2. United Kingdom
- 2.3. France
- 2.4. Italy
- 2.5. Spain
- 2.6. Rest of Europe
-
3. Asia Pacific
- 3.1. China
- 3.2. Japan
- 3.3. India
- 3.4. Australia
- 3.5. South Korea
- 3.6. Rest of Asia Pacific
-
4. Middle East and Africa
- 4.1. GCC
- 4.2. South Africa
- 4.3. Rest of Middle East and Africa
-
5. South America
- 5.1. Brazil
- 5.2. Argentina
- 5.3. Rest of South America
Clot Management Devices Market REPORT HIGHLIGHTS
| Aspects | Details |
|---|---|
| Study Period | 2019-2033 |
| Base Year | 2024 |
| Estimated Year | 2025 |
| Forecast Period | 2025-2033 |
| Historical Period | 2019-2024 |
| Growth Rate | CAGR of 4.50% from 2019-2033 |
| Segmentation |
|
Table of Contents
- 1. Introduction
- 1.1. Research Scope
- 1.2. Market Segmentation
- 1.3. Research Methodology
- 1.4. Definitions and Assumptions
- 2. Executive Summary
- 2.1. Introduction
- 3. Market Dynamics
- 3.1. Introduction
- 3.2. Market Drivers
- 3.2.1. Increasing Prevalence of Cardiovascular Diseases and Ageing Population; Growing Demand for Minimally Invasive Surgeries and Advancements in Technologies
- 3.3. Market Restrains
- 3.3.1. Stringent Regulatory Procedures; Availability of Alternative Treatments
- 3.4. Market Trends
- 3.4.1. Embolectomy Balloon Catheter Segment is Expected to Register Significant Growth
- 4. Market Factor Analysis
- 4.1. Porters Five Forces
- 4.2. Supply/Value Chain
- 4.3. PESTEL analysis
- 4.4. Market Entropy
- 4.5. Patent/Trademark Analysis
- 5. Global Clot Management Devices Market Analysis, Insights and Forecast, 2019-2031
- 5.1. Market Analysis, Insights and Forecast - by Product
- 5.1.1. Embolectomy Balloon Catheter
- 5.1.2. Catheter Directed Thrombolysis Devices
- 5.1.3. Percutaneous Thrombectomy Devices
- 5.1.4. Inferior Vena cava Filters
- 5.1.5. Neurovascular Embolectomy Devices
- 5.2. Market Analysis, Insights and Forecast - by End-User
- 5.2.1. Hospitals
- 5.2.2. Ambulatory Surgical Centers
- 5.2.3. Other End Users
- 5.3. Market Analysis, Insights and Forecast - by Region
- 5.3.1. North America
- 5.3.2. Europe
- 5.3.3. Asia Pacific
- 5.3.4. Middle East and Africa
- 5.3.5. South America
- 5.1. Market Analysis, Insights and Forecast - by Product
- 6. North America Clot Management Devices Market Analysis, Insights and Forecast, 2019-2031
- 6.1. Market Analysis, Insights and Forecast - by Product
- 6.1.1. Embolectomy Balloon Catheter
- 6.1.2. Catheter Directed Thrombolysis Devices
- 6.1.3. Percutaneous Thrombectomy Devices
- 6.1.4. Inferior Vena cava Filters
- 6.1.5. Neurovascular Embolectomy Devices
- 6.2. Market Analysis, Insights and Forecast - by End-User
- 6.2.1. Hospitals
- 6.2.2. Ambulatory Surgical Centers
- 6.2.3. Other End Users
- 6.1. Market Analysis, Insights and Forecast - by Product
- 7. Europe Clot Management Devices Market Analysis, Insights and Forecast, 2019-2031
- 7.1. Market Analysis, Insights and Forecast - by Product
- 7.1.1. Embolectomy Balloon Catheter
- 7.1.2. Catheter Directed Thrombolysis Devices
- 7.1.3. Percutaneous Thrombectomy Devices
- 7.1.4. Inferior Vena cava Filters
- 7.1.5. Neurovascular Embolectomy Devices
- 7.2. Market Analysis, Insights and Forecast - by End-User
- 7.2.1. Hospitals
- 7.2.2. Ambulatory Surgical Centers
- 7.2.3. Other End Users
- 7.1. Market Analysis, Insights and Forecast - by Product
- 8. Asia Pacific Clot Management Devices Market Analysis, Insights and Forecast, 2019-2031
- 8.1. Market Analysis, Insights and Forecast - by Product
- 8.1.1. Embolectomy Balloon Catheter
- 8.1.2. Catheter Directed Thrombolysis Devices
- 8.1.3. Percutaneous Thrombectomy Devices
- 8.1.4. Inferior Vena cava Filters
- 8.1.5. Neurovascular Embolectomy Devices
- 8.2. Market Analysis, Insights and Forecast - by End-User
- 8.2.1. Hospitals
- 8.2.2. Ambulatory Surgical Centers
- 8.2.3. Other End Users
- 8.1. Market Analysis, Insights and Forecast - by Product
- 9. Middle East and Africa Clot Management Devices Market Analysis, Insights and Forecast, 2019-2031
- 9.1. Market Analysis, Insights and Forecast - by Product
- 9.1.1. Embolectomy Balloon Catheter
- 9.1.2. Catheter Directed Thrombolysis Devices
- 9.1.3. Percutaneous Thrombectomy Devices
- 9.1.4. Inferior Vena cava Filters
- 9.1.5. Neurovascular Embolectomy Devices
- 9.2. Market Analysis, Insights and Forecast - by End-User
- 9.2.1. Hospitals
- 9.2.2. Ambulatory Surgical Centers
- 9.2.3. Other End Users
- 9.1. Market Analysis, Insights and Forecast - by Product
- 10. South America Clot Management Devices Market Analysis, Insights and Forecast, 2019-2031
- 10.1. Market Analysis, Insights and Forecast - by Product
- 10.1.1. Embolectomy Balloon Catheter
- 10.1.2. Catheter Directed Thrombolysis Devices
- 10.1.3. Percutaneous Thrombectomy Devices
- 10.1.4. Inferior Vena cava Filters
- 10.1.5. Neurovascular Embolectomy Devices
- 10.2. Market Analysis, Insights and Forecast - by End-User
- 10.2.1. Hospitals
- 10.2.2. Ambulatory Surgical Centers
- 10.2.3. Other End Users
- 10.1. Market Analysis, Insights and Forecast - by Product
- 11. North America Clot Management Devices Market Analysis, Insights and Forecast, 2019-2031
- 11.1. Market Analysis, Insights and Forecast - By Country/Sub-region
- 11.1.1. undefined
- 12. Europe Clot Management Devices Market Analysis, Insights and Forecast, 2019-2031
- 12.1. Market Analysis, Insights and Forecast - By Country/Sub-region
- 12.1.1. undefined
- 13. Asia Pacific Clot Management Devices Market Analysis, Insights and Forecast, 2019-2031
- 13.1. Market Analysis, Insights and Forecast - By Country/Sub-region
- 13.1.1. undefined
- 14. Middle East and Africa Clot Management Devices Market Analysis, Insights and Forecast, 2019-2031
- 14.1. Market Analysis, Insights and Forecast - By Country/Sub-region
- 14.1.1. undefined
- 15. South America Clot Management Devices Market Analysis, Insights and Forecast, 2019-2031
- 15.1. Market Analysis, Insights and Forecast - By Country/Sub-region
- 15.1.1. undefined
- 16. Competitive Analysis
- 16.1. Global Market Share Analysis 2024
- 16.2. Company Profiles
- 16.2.1 Cook Group Incorporated
- 16.2.1.1. Overview
- 16.2.1.2. Products
- 16.2.1.3. SWOT Analysis
- 16.2.1.4. Recent Developments
- 16.2.1.5. Financials (Based on Availability)
- 16.2.2 AngioDynamics
- 16.2.2.1. Overview
- 16.2.2.2. Products
- 16.2.2.3. SWOT Analysis
- 16.2.2.4. Recent Developments
- 16.2.2.5. Financials (Based on Availability)
- 16.2.3 Strub Medical GmbH & Co KG
- 16.2.3.1. Overview
- 16.2.3.2. Products
- 16.2.3.3. SWOT Analysis
- 16.2.3.4. Recent Developments
- 16.2.3.5. Financials (Based on Availability)
- 16.2.4 iVascular SLU
- 16.2.4.1. Overview
- 16.2.4.2. Products
- 16.2.4.3. SWOT Analysis
- 16.2.4.4. Recent Developments
- 16.2.4.5. Financials (Based on Availability)
- 16.2.5 Cardinal Health
- 16.2.5.1. Overview
- 16.2.5.2. Products
- 16.2.5.3. SWOT Analysis
- 16.2.5.4. Recent Developments
- 16.2.5.5. Financials (Based on Availability)
- 16.2.6 Edward Lifesciences
- 16.2.6.1. Overview
- 16.2.6.2. Products
- 16.2.6.3. SWOT Analysis
- 16.2.6.4. Recent Developments
- 16.2.6.5. Financials (Based on Availability)
- 16.2.7 LeMaitre Vascular Inc
- 16.2.7.1. Overview
- 16.2.7.2. Products
- 16.2.7.3. SWOT Analysis
- 16.2.7.4. Recent Developments
- 16.2.7.5. Financials (Based on Availability)
- 16.2.8 Medtronic Plc
- 16.2.8.1. Overview
- 16.2.8.2. Products
- 16.2.8.3. SWOT Analysis
- 16.2.8.4. Recent Developments
- 16.2.8.5. Financials (Based on Availability)
- 16.2.9 Johnson & Johnson
- 16.2.9.1. Overview
- 16.2.9.2. Products
- 16.2.9.3. SWOT Analysis
- 16.2.9.4. Recent Developments
- 16.2.9.5. Financials (Based on Availability)
- 16.2.10 Boston Scientific Corporation
- 16.2.10.1. Overview
- 16.2.10.2. Products
- 16.2.10.3. SWOT Analysis
- 16.2.10.4. Recent Developments
- 16.2.10.5. Financials (Based on Availability)
- 16.2.11 Teleflex Incorporated
- 16.2.11.1. Overview
- 16.2.11.2. Products
- 16.2.11.3. SWOT Analysis
- 16.2.11.4. Recent Developments
- 16.2.11.5. Financials (Based on Availability)
- 16.2.12 Stryker
- 16.2.12.1. Overview
- 16.2.12.2. Products
- 16.2.12.3. SWOT Analysis
- 16.2.12.4. Recent Developments
- 16.2.12.5. Financials (Based on Availability)
- 16.2.1 Cook Group Incorporated
List of Figures
- Figure 1: Global Clot Management Devices Market Revenue Breakdown (Million, %) by Region 2024 & 2032
- Figure 2: Global Clot Management Devices Market Volume Breakdown (K Unit, %) by Region 2024 & 2032
- Figure 3: North America Clot Management Devices Market Revenue (Million), by Country 2024 & 2032
- Figure 4: North America Clot Management Devices Market Volume (K Unit), by Country 2024 & 2032
- Figure 5: North America Clot Management Devices Market Revenue Share (%), by Country 2024 & 2032
- Figure 6: North America Clot Management Devices Market Volume Share (%), by Country 2024 & 2032
- Figure 7: Europe Clot Management Devices Market Revenue (Million), by Country 2024 & 2032
- Figure 8: Europe Clot Management Devices Market Volume (K Unit), by Country 2024 & 2032
- Figure 9: Europe Clot Management Devices Market Revenue Share (%), by Country 2024 & 2032
- Figure 10: Europe Clot Management Devices Market Volume Share (%), by Country 2024 & 2032
- Figure 11: Asia Pacific Clot Management Devices Market Revenue (Million), by Country 2024 & 2032
- Figure 12: Asia Pacific Clot Management Devices Market Volume (K Unit), by Country 2024 & 2032
- Figure 13: Asia Pacific Clot Management Devices Market Revenue Share (%), by Country 2024 & 2032
- Figure 14: Asia Pacific Clot Management Devices Market Volume Share (%), by Country 2024 & 2032
- Figure 15: Middle East and Africa Clot Management Devices Market Revenue (Million), by Country 2024 & 2032
- Figure 16: Middle East and Africa Clot Management Devices Market Volume (K Unit), by Country 2024 & 2032
- Figure 17: Middle East and Africa Clot Management Devices Market Revenue Share (%), by Country 2024 & 2032
- Figure 18: Middle East and Africa Clot Management Devices Market Volume Share (%), by Country 2024 & 2032
- Figure 19: South America Clot Management Devices Market Revenue (Million), by Country 2024 & 2032
- Figure 20: South America Clot Management Devices Market Volume (K Unit), by Country 2024 & 2032
- Figure 21: South America Clot Management Devices Market Revenue Share (%), by Country 2024 & 2032
- Figure 22: South America Clot Management Devices Market Volume Share (%), by Country 2024 & 2032
- Figure 23: North America Clot Management Devices Market Revenue (Million), by Product 2024 & 2032
- Figure 24: North America Clot Management Devices Market Volume (K Unit), by Product 2024 & 2032
- Figure 25: North America Clot Management Devices Market Revenue Share (%), by Product 2024 & 2032
- Figure 26: North America Clot Management Devices Market Volume Share (%), by Product 2024 & 2032
- Figure 27: North America Clot Management Devices Market Revenue (Million), by End-User 2024 & 2032
- Figure 28: North America Clot Management Devices Market Volume (K Unit), by End-User 2024 & 2032
- Figure 29: North America Clot Management Devices Market Revenue Share (%), by End-User 2024 & 2032
- Figure 30: North America Clot Management Devices Market Volume Share (%), by End-User 2024 & 2032
- Figure 31: North America Clot Management Devices Market Revenue (Million), by Country 2024 & 2032
- Figure 32: North America Clot Management Devices Market Volume (K Unit), by Country 2024 & 2032
- Figure 33: North America Clot Management Devices Market Revenue Share (%), by Country 2024 & 2032
- Figure 34: North America Clot Management Devices Market Volume Share (%), by Country 2024 & 2032
- Figure 35: Europe Clot Management Devices Market Revenue (Million), by Product 2024 & 2032
- Figure 36: Europe Clot Management Devices Market Volume (K Unit), by Product 2024 & 2032
- Figure 37: Europe Clot Management Devices Market Revenue Share (%), by Product 2024 & 2032
- Figure 38: Europe Clot Management Devices Market Volume Share (%), by Product 2024 & 2032
- Figure 39: Europe Clot Management Devices Market Revenue (Million), by End-User 2024 & 2032
- Figure 40: Europe Clot Management Devices Market Volume (K Unit), by End-User 2024 & 2032
- Figure 41: Europe Clot Management Devices Market Revenue Share (%), by End-User 2024 & 2032
- Figure 42: Europe Clot Management Devices Market Volume Share (%), by End-User 2024 & 2032
- Figure 43: Europe Clot Management Devices Market Revenue (Million), by Country 2024 & 2032
- Figure 44: Europe Clot Management Devices Market Volume (K Unit), by Country 2024 & 2032
- Figure 45: Europe Clot Management Devices Market Revenue Share (%), by Country 2024 & 2032
- Figure 46: Europe Clot Management Devices Market Volume Share (%), by Country 2024 & 2032
- Figure 47: Asia Pacific Clot Management Devices Market Revenue (Million), by Product 2024 & 2032
- Figure 48: Asia Pacific Clot Management Devices Market Volume (K Unit), by Product 2024 & 2032
- Figure 49: Asia Pacific Clot Management Devices Market Revenue Share (%), by Product 2024 & 2032
- Figure 50: Asia Pacific Clot Management Devices Market Volume Share (%), by Product 2024 & 2032
- Figure 51: Asia Pacific Clot Management Devices Market Revenue (Million), by End-User 2024 & 2032
- Figure 52: Asia Pacific Clot Management Devices Market Volume (K Unit), by End-User 2024 & 2032
- Figure 53: Asia Pacific Clot Management Devices Market Revenue Share (%), by End-User 2024 & 2032
- Figure 54: Asia Pacific Clot Management Devices Market Volume Share (%), by End-User 2024 & 2032
- Figure 55: Asia Pacific Clot Management Devices Market Revenue (Million), by Country 2024 & 2032
- Figure 56: Asia Pacific Clot Management Devices Market Volume (K Unit), by Country 2024 & 2032
- Figure 57: Asia Pacific Clot Management Devices Market Revenue Share (%), by Country 2024 & 2032
- Figure 58: Asia Pacific Clot Management Devices Market Volume Share (%), by Country 2024 & 2032
- Figure 59: Middle East and Africa Clot Management Devices Market Revenue (Million), by Product 2024 & 2032
- Figure 60: Middle East and Africa Clot Management Devices Market Volume (K Unit), by Product 2024 & 2032
- Figure 61: Middle East and Africa Clot Management Devices Market Revenue Share (%), by Product 2024 & 2032
- Figure 62: Middle East and Africa Clot Management Devices Market Volume Share (%), by Product 2024 & 2032
- Figure 63: Middle East and Africa Clot Management Devices Market Revenue (Million), by End-User 2024 & 2032
- Figure 64: Middle East and Africa Clot Management Devices Market Volume (K Unit), by End-User 2024 & 2032
- Figure 65: Middle East and Africa Clot Management Devices Market Revenue Share (%), by End-User 2024 & 2032
- Figure 66: Middle East and Africa Clot Management Devices Market Volume Share (%), by End-User 2024 & 2032
- Figure 67: Middle East and Africa Clot Management Devices Market Revenue (Million), by Country 2024 & 2032
- Figure 68: Middle East and Africa Clot Management Devices Market Volume (K Unit), by Country 2024 & 2032
- Figure 69: Middle East and Africa Clot Management Devices Market Revenue Share (%), by Country 2024 & 2032
- Figure 70: Middle East and Africa Clot Management Devices Market Volume Share (%), by Country 2024 & 2032
- Figure 71: South America Clot Management Devices Market Revenue (Million), by Product 2024 & 2032
- Figure 72: South America Clot Management Devices Market Volume (K Unit), by Product 2024 & 2032
- Figure 73: South America Clot Management Devices Market Revenue Share (%), by Product 2024 & 2032
- Figure 74: South America Clot Management Devices Market Volume Share (%), by Product 2024 & 2032
- Figure 75: South America Clot Management Devices Market Revenue (Million), by End-User 2024 & 2032
- Figure 76: South America Clot Management Devices Market Volume (K Unit), by End-User 2024 & 2032
- Figure 77: South America Clot Management Devices Market Revenue Share (%), by End-User 2024 & 2032
- Figure 78: South America Clot Management Devices Market Volume Share (%), by End-User 2024 & 2032
- Figure 79: South America Clot Management Devices Market Revenue (Million), by Country 2024 & 2032
- Figure 80: South America Clot Management Devices Market Volume (K Unit), by Country 2024 & 2032
- Figure 81: South America Clot Management Devices Market Revenue Share (%), by Country 2024 & 2032
- Figure 82: South America Clot Management Devices Market Volume Share (%), by Country 2024 & 2032
List of Tables
- Table 1: Global Clot Management Devices Market Revenue Million Forecast, by Region 2019 & 2032
- Table 2: Global Clot Management Devices Market Volume K Unit Forecast, by Region 2019 & 2032
- Table 3: Global Clot Management Devices Market Revenue Million Forecast, by Product 2019 & 2032
- Table 4: Global Clot Management Devices Market Volume K Unit Forecast, by Product 2019 & 2032
- Table 5: Global Clot Management Devices Market Revenue Million Forecast, by End-User 2019 & 2032
- Table 6: Global Clot Management Devices Market Volume K Unit Forecast, by End-User 2019 & 2032
- Table 7: Global Clot Management Devices Market Revenue Million Forecast, by Region 2019 & 2032
- Table 8: Global Clot Management Devices Market Volume K Unit Forecast, by Region 2019 & 2032
- Table 9: Global Clot Management Devices Market Revenue Million Forecast, by Country 2019 & 2032
- Table 10: Global Clot Management Devices Market Volume K Unit Forecast, by Country 2019 & 2032
- Table 11: Global Clot Management Devices Market Revenue Million Forecast, by Country 2019 & 2032
- Table 12: Global Clot Management Devices Market Volume K Unit Forecast, by Country 2019 & 2032
- Table 13: Global Clot Management Devices Market Revenue Million Forecast, by Country 2019 & 2032
- Table 14: Global Clot Management Devices Market Volume K Unit Forecast, by Country 2019 & 2032
- Table 15: Global Clot Management Devices Market Revenue Million Forecast, by Country 2019 & 2032
- Table 16: Global Clot Management Devices Market Volume K Unit Forecast, by Country 2019 & 2032
- Table 17: Global Clot Management Devices Market Revenue Million Forecast, by Country 2019 & 2032
- Table 18: Global Clot Management Devices Market Volume K Unit Forecast, by Country 2019 & 2032
- Table 19: Global Clot Management Devices Market Revenue Million Forecast, by Product 2019 & 2032
- Table 20: Global Clot Management Devices Market Volume K Unit Forecast, by Product 2019 & 2032
- Table 21: Global Clot Management Devices Market Revenue Million Forecast, by End-User 2019 & 2032
- Table 22: Global Clot Management Devices Market Volume K Unit Forecast, by End-User 2019 & 2032
- Table 23: Global Clot Management Devices Market Revenue Million Forecast, by Country 2019 & 2032
- Table 24: Global Clot Management Devices Market Volume K Unit Forecast, by Country 2019 & 2032
- Table 25: United States Clot Management Devices Market Revenue (Million) Forecast, by Application 2019 & 2032
- Table 26: United States Clot Management Devices Market Volume (K Unit) Forecast, by Application 2019 & 2032
- Table 27: Canada Clot Management Devices Market Revenue (Million) Forecast, by Application 2019 & 2032
- Table 28: Canada Clot Management Devices Market Volume (K Unit) Forecast, by Application 2019 & 2032
- Table 29: Mexico Clot Management Devices Market Revenue (Million) Forecast, by Application 2019 & 2032
- Table 30: Mexico Clot Management Devices Market Volume (K Unit) Forecast, by Application 2019 & 2032
- Table 31: Global Clot Management Devices Market Revenue Million Forecast, by Product 2019 & 2032
- Table 32: Global Clot Management Devices Market Volume K Unit Forecast, by Product 2019 & 2032
- Table 33: Global Clot Management Devices Market Revenue Million Forecast, by End-User 2019 & 2032
- Table 34: Global Clot Management Devices Market Volume K Unit Forecast, by End-User 2019 & 2032
- Table 35: Global Clot Management Devices Market Revenue Million Forecast, by Country 2019 & 2032
- Table 36: Global Clot Management Devices Market Volume K Unit Forecast, by Country 2019 & 2032
- Table 37: Germany Clot Management Devices Market Revenue (Million) Forecast, by Application 2019 & 2032
- Table 38: Germany Clot Management Devices Market Volume (K Unit) Forecast, by Application 2019 & 2032
- Table 39: United Kingdom Clot Management Devices Market Revenue (Million) Forecast, by Application 2019 & 2032
- Table 40: United Kingdom Clot Management Devices Market Volume (K Unit) Forecast, by Application 2019 & 2032
- Table 41: France Clot Management Devices Market Revenue (Million) Forecast, by Application 2019 & 2032
- Table 42: France Clot Management Devices Market Volume (K Unit) Forecast, by Application 2019 & 2032
- Table 43: Italy Clot Management Devices Market Revenue (Million) Forecast, by Application 2019 & 2032
- Table 44: Italy Clot Management Devices Market Volume (K Unit) Forecast, by Application 2019 & 2032
- Table 45: Spain Clot Management Devices Market Revenue (Million) Forecast, by Application 2019 & 2032
- Table 46: Spain Clot Management Devices Market Volume (K Unit) Forecast, by Application 2019 & 2032
- Table 47: Rest of Europe Clot Management Devices Market Revenue (Million) Forecast, by Application 2019 & 2032
- Table 48: Rest of Europe Clot Management Devices Market Volume (K Unit) Forecast, by Application 2019 & 2032
- Table 49: Global Clot Management Devices Market Revenue Million Forecast, by Product 2019 & 2032
- Table 50: Global Clot Management Devices Market Volume K Unit Forecast, by Product 2019 & 2032
- Table 51: Global Clot Management Devices Market Revenue Million Forecast, by End-User 2019 & 2032
- Table 52: Global Clot Management Devices Market Volume K Unit Forecast, by End-User 2019 & 2032
- Table 53: Global Clot Management Devices Market Revenue Million Forecast, by Country 2019 & 2032
- Table 54: Global Clot Management Devices Market Volume K Unit Forecast, by Country 2019 & 2032
- Table 55: China Clot Management Devices Market Revenue (Million) Forecast, by Application 2019 & 2032
- Table 56: China Clot Management Devices Market Volume (K Unit) Forecast, by Application 2019 & 2032
- Table 57: Japan Clot Management Devices Market Revenue (Million) Forecast, by Application 2019 & 2032
- Table 58: Japan Clot Management Devices Market Volume (K Unit) Forecast, by Application 2019 & 2032
- Table 59: India Clot Management Devices Market Revenue (Million) Forecast, by Application 2019 & 2032
- Table 60: India Clot Management Devices Market Volume (K Unit) Forecast, by Application 2019 & 2032
- Table 61: Australia Clot Management Devices Market Revenue (Million) Forecast, by Application 2019 & 2032
- Table 62: Australia Clot Management Devices Market Volume (K Unit) Forecast, by Application 2019 & 2032
- Table 63: South Korea Clot Management Devices Market Revenue (Million) Forecast, by Application 2019 & 2032
- Table 64: South Korea Clot Management Devices Market Volume (K Unit) Forecast, by Application 2019 & 2032
- Table 65: Rest of Asia Pacific Clot Management Devices Market Revenue (Million) Forecast, by Application 2019 & 2032
- Table 66: Rest of Asia Pacific Clot Management Devices Market Volume (K Unit) Forecast, by Application 2019 & 2032
- Table 67: Global Clot Management Devices Market Revenue Million Forecast, by Product 2019 & 2032
- Table 68: Global Clot Management Devices Market Volume K Unit Forecast, by Product 2019 & 2032
- Table 69: Global Clot Management Devices Market Revenue Million Forecast, by End-User 2019 & 2032
- Table 70: Global Clot Management Devices Market Volume K Unit Forecast, by End-User 2019 & 2032
- Table 71: Global Clot Management Devices Market Revenue Million Forecast, by Country 2019 & 2032
- Table 72: Global Clot Management Devices Market Volume K Unit Forecast, by Country 2019 & 2032
- Table 73: GCC Clot Management Devices Market Revenue (Million) Forecast, by Application 2019 & 2032
- Table 74: GCC Clot Management Devices Market Volume (K Unit) Forecast, by Application 2019 & 2032
- Table 75: South Africa Clot Management Devices Market Revenue (Million) Forecast, by Application 2019 & 2032
- Table 76: South Africa Clot Management Devices Market Volume (K Unit) Forecast, by Application 2019 & 2032
- Table 77: Rest of Middle East and Africa Clot Management Devices Market Revenue (Million) Forecast, by Application 2019 & 2032
- Table 78: Rest of Middle East and Africa Clot Management Devices Market Volume (K Unit) Forecast, by Application 2019 & 2032
- Table 79: Global Clot Management Devices Market Revenue Million Forecast, by Product 2019 & 2032
- Table 80: Global Clot Management Devices Market Volume K Unit Forecast, by Product 2019 & 2032
- Table 81: Global Clot Management Devices Market Revenue Million Forecast, by End-User 2019 & 2032
- Table 82: Global Clot Management Devices Market Volume K Unit Forecast, by End-User 2019 & 2032
- Table 83: Global Clot Management Devices Market Revenue Million Forecast, by Country 2019 & 2032
- Table 84: Global Clot Management Devices Market Volume K Unit Forecast, by Country 2019 & 2032
- Table 85: Brazil Clot Management Devices Market Revenue (Million) Forecast, by Application 2019 & 2032
- Table 86: Brazil Clot Management Devices Market Volume (K Unit) Forecast, by Application 2019 & 2032
- Table 87: Argentina Clot Management Devices Market Revenue (Million) Forecast, by Application 2019 & 2032
- Table 88: Argentina Clot Management Devices Market Volume (K Unit) Forecast, by Application 2019 & 2032
- Table 89: Rest of South America Clot Management Devices Market Revenue (Million) Forecast, by Application 2019 & 2032
- Table 90: Rest of South America Clot Management Devices Market Volume (K Unit) Forecast, by Application 2019 & 2032
Frequently Asked Questions
1. What is the projected Compound Annual Growth Rate (CAGR) of the Clot Management Devices Market?
The projected CAGR is approximately 4.50%.
2. Which companies are prominent players in the Clot Management Devices Market?
Key companies in the market include Cook Group Incorporated, AngioDynamics, Strub Medical GmbH & Co KG, iVascular SLU, Cardinal Health, Edward Lifesciences, LeMaitre Vascular Inc, Medtronic Plc, Johnson & Johnson, Boston Scientific Corporation, Teleflex Incorporated, Stryker.
3. What are the main segments of the Clot Management Devices Market?
The market segments include Product, End-User.
4. Can you provide details about the market size?
The market size is estimated to be USD XX Million as of 2022.
5. What are some drivers contributing to market growth?
Increasing Prevalence of Cardiovascular Diseases and Ageing Population; Growing Demand for Minimally Invasive Surgeries and Advancements in Technologies.
6. What are the notable trends driving market growth?
Embolectomy Balloon Catheter Segment is Expected to Register Significant Growth.
7. Are there any restraints impacting market growth?
Stringent Regulatory Procedures; Availability of Alternative Treatments.
8. Can you provide examples of recent developments in the market?
April 2022: Penumbra, Inc., a global healthcare company focused on innovative therapies, announced that its Indigo Aspiration System with Lightning 7 and Lightning 12, designed for a single session blood clot removal in peripheral arterial and venous systems, including the treatment of pulmonary embolisms. The product secured the CE Mark and is now commercially available in Europe.
9. What pricing options are available for accessing the report?
Pricing options include single-user, multi-user, and enterprise licenses priced at USD 4750, USD 5250, and USD 8750 respectively.
10. Is the market size provided in terms of value or volume?
The market size is provided in terms of value, measured in Million and volume, measured in K Unit.
11. Are there any specific market keywords associated with the report?
Yes, the market keyword associated with the report is "Clot Management Devices Market," which aids in identifying and referencing the specific market segment covered.
12. How do I determine which pricing option suits my needs best?
The pricing options vary based on user requirements and access needs. Individual users may opt for single-user licenses, while businesses requiring broader access may choose multi-user or enterprise licenses for cost-effective access to the report.
13. Are there any additional resources or data provided in the Clot Management Devices Market report?
While the report offers comprehensive insights, it's advisable to review the specific contents or supplementary materials provided to ascertain if additional resources or data are available.
14. How can I stay updated on further developments or reports in the Clot Management Devices Market?
To stay informed about further developments, trends, and reports in the Clot Management Devices Market, consider subscribing to industry newsletters, following relevant companies and organizations, or regularly checking reputable industry news sources and publications.
Methodology
Step 1 - Identification of Relevant Samples Size from Population Database


Step 2 - Approaches for Defining Global Market Size (Value, Volume* & Price*)

Note*: In applicable scenarios
Step 3 - Data Sources
Primary Research
- Web Analytics
- Survey Reports
- Research Institute
- Latest Research Reports
- Opinion Leaders
Secondary Research
- Annual Reports
- White Paper
- Latest Press Release
- Industry Association
- Paid Database
- Investor Presentations

Step 4 - Data Triangulation
Involves using different sources of information in order to increase the validity of a study
These sources are likely to be stakeholders in a program - participants, other researchers, program staff, other community members, and so on.
Then we put all data in single framework & apply various statistical tools to find out the dynamic on the market.
During the analysis stage, feedback from the stakeholder groups would be compared to determine areas of agreement as well as areas of divergence
