

Key Insights
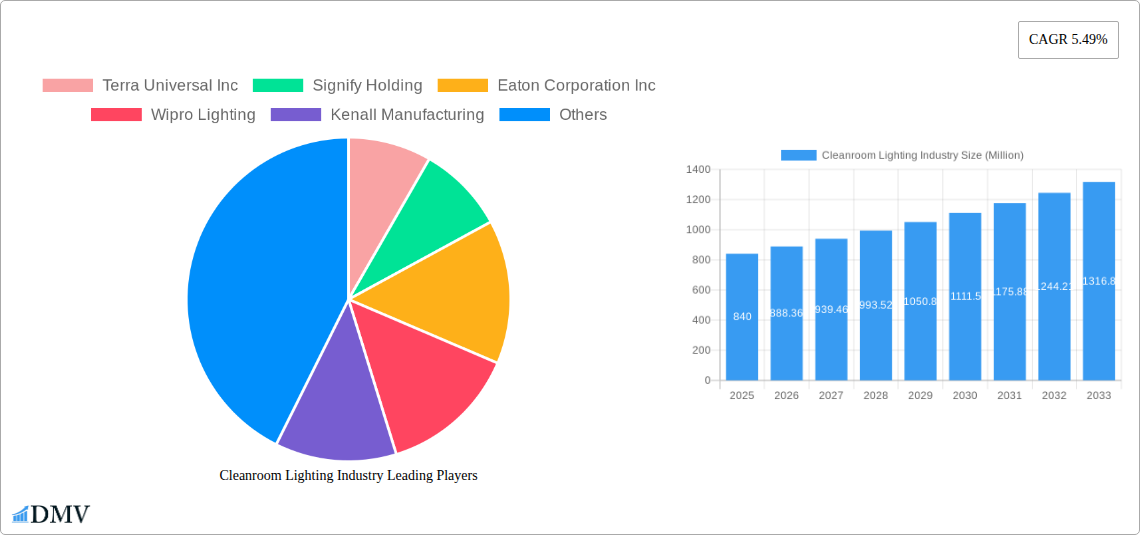
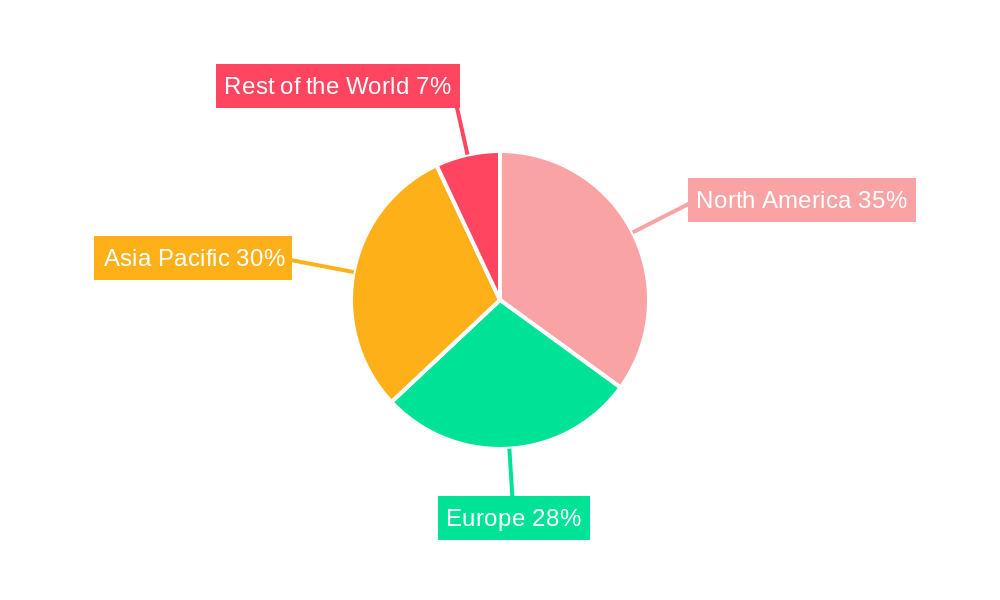
The cleanroom lighting market, valued at $840 million in 2025, is projected to experience robust growth, driven by increasing demand across various sectors. A compound annual growth rate (CAGR) of 5.49% from 2025 to 2033 signifies a significant expansion, fueled primarily by the escalating need for controlled environments in industries like healthcare and life sciences, electronics and semiconductors, and food and beverage. The rising adoption of LED lighting, offering energy efficiency and long lifespan, is a major trend shaping the market. Furthermore, the shift towards smart lighting solutions enabling remote monitoring and control adds another layer of growth potential. While initial investment costs can be a restraint, the long-term cost savings and improved operational efficiency offered by advanced cleanroom lighting systems outweigh this consideration. The market is segmented by light source (LED dominating the market share, followed by fluorescent), mounting type (recessed and surface mount), and end-user industry. Key players like Signify Holding, Eaton Corporation Inc, and Wipro Lighting are driving innovation and expanding their market presence through strategic partnerships and technological advancements. The Asia Pacific region is expected to witness faster growth compared to other regions due to increasing industrialization and rising investments in advanced manufacturing facilities. The North American market, though mature, will continue to demonstrate steady growth due to stringent regulatory requirements and focus on advanced technologies.
The competitive landscape is characterized by established players and emerging companies focusing on specialized solutions. Technological advancements in lighting technology, specifically in areas like UV-C disinfection and integrated sensors, will further enhance the market growth. The increasing focus on sustainability and energy efficiency regulations is also driving the adoption of advanced cleanroom lighting solutions. Future market growth will depend on factors such as technological innovations, evolving regulatory landscapes, and the overall economic growth in key end-user industries. The continued expansion of the pharmaceutical, biotechnology, and semiconductor industries will significantly impact the demand for high-quality cleanroom lighting systems. This demand will continue to fuel investments in research and development, pushing the boundaries of cleanroom lighting capabilities and driving the market forward.
Cleanroom Lighting Industry Market Report: 2019-2033
This comprehensive report provides a detailed analysis of the Cleanroom Lighting Industry, offering invaluable insights for stakeholders seeking to navigate this dynamic market. With a study period spanning 2019-2033, a base year of 2025, and a forecast period of 2025-2033, this report delivers a robust understanding of past performance, current trends, and future projections. The market is valued at xx Million in 2025 and is projected to reach xx Million by 2033, exhibiting a Compound Annual Growth Rate (CAGR) of xx%.
Cleanroom Lighting Industry Market Composition & Trends
This section meticulously evaluates the competitive landscape of the cleanroom lighting market, focusing on market concentration, innovation drivers, regulatory frameworks, substitute products, end-user profiles, and merger & acquisition (M&A) activities. The market is moderately concentrated, with several key players holding significant market share.
- Market Share Distribution: Signify Holding and Eaton Corporation Inc. together command approximately xx% of the global market share in 2025, while other major players like Terra Universal Inc., Wipro Lighting, and Kenall Manufacturing hold substantial, yet smaller, portions. Smaller players make up the remaining xx%.
- Innovation Catalysts: Stringent regulatory compliance standards, coupled with increasing demand for energy-efficient and technologically advanced lighting solutions, are driving innovation within the sector.
- Regulatory Landscape: Stringent regulations concerning energy efficiency and environmental impact are shaping product development and market dynamics. Compliance requirements vary across regions.
- Substitute Products: While traditional lighting technologies still exist, they are gradually being replaced by LED technology owing to its energy efficiency and long lifespan.
- End-User Profiles: Key end-user industries include Healthcare & Life Sciences, Electronics & Semiconductor, and Food & Beverage, each with specific lighting requirements and regulatory compliance standards.
- M&A Activities: The industry has witnessed several M&A activities in recent years. The total value of deals involving cleanroom lighting companies between 2019 and 2024 is estimated at xx Million. These transactions reflect strategic consolidation within the market.
Cleanroom Lighting Industry Industry Evolution
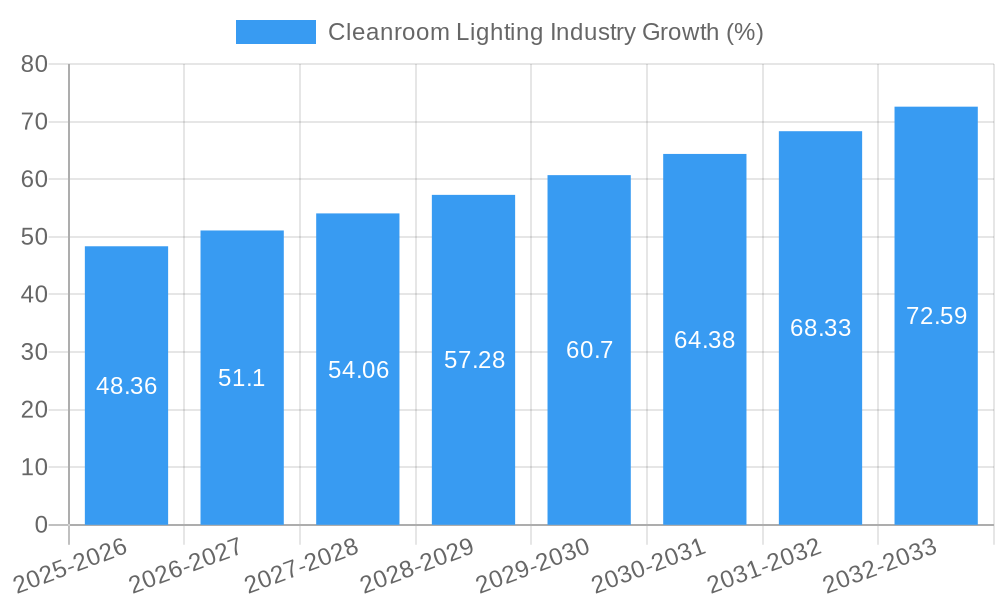
This section delves into the evolutionary trajectory of the cleanroom lighting industry, encompassing market growth trajectories, technological advancements, and the changing demands of end-users. The industry experienced a CAGR of xx% between 2019 and 2024. The market is primarily driven by the increasing adoption of LED lighting solutions across various end-user sectors, largely due to their superior energy efficiency, longer lifespan, and lower maintenance costs. The shift towards smart lighting systems is also contributing to industry growth. The adoption rate of LED cleanroom lighting systems is estimated to be at xx% in 2025, projected to increase to xx% by 2033. Further technological advancements focus on improved light quality, better control systems, and integration with smart building management systems. The demand for customizable lighting solutions is increasing, prompting vendors to offer tailored products that meet the specific needs of different cleanroom applications.
Leading Regions, Countries, or Segments in Cleanroom Lighting Industry
This section identifies the leading regions, countries, and segments within the cleanroom lighting market.
Dominant Segments:
- By Light Source: LED lighting dominates the market, capturing xx% of market share in 2025, due to its energy efficiency and longevity. Fluorescent lighting continues to hold a smaller share, estimated at xx% in 2025, but is gradually being phased out in many applications.
- By Mounting Type: Recessed mounting types currently hold a larger market share compared to surface mount options, primarily driven by their aesthetic appeal and space efficiency.
- By End-user Industry: The Healthcare & Life Sciences sector is the leading end-user industry, driven by stringent hygiene and regulatory compliance requirements. The Electronics and Semiconductor industry holds a substantial market share due to the critical role of lighting in manufacturing processes.
Key Drivers:
- Significant Investments: Continued investments in research and development (R&D) are driving innovation in cleanroom lighting technology. The global investment in cleanroom technology in 2024 reached xx Million.
- Government Regulations: Stringent environmental regulations promoting energy efficiency in various countries are propelling the adoption of energy-efficient LED lighting solutions.
- Technological Advancements: The continuous development of advanced lighting technologies, like smart lighting and IoT-enabled systems, is fostering market expansion.
The dominance of specific regions and countries is influenced by factors such as the concentration of key end-user industries, levels of economic development, and government policies. North America and Europe currently hold a significant market share.
Cleanroom Lighting Industry Product Innovations
Recent innovations in cleanroom lighting include the introduction of advanced LED lighting solutions with improved efficacy, color rendering, and durability. Smart lighting systems are gaining traction, offering features such as remote control, dimming capabilities, and energy monitoring. These innovations cater to the demand for energy efficiency, improved hygiene, and enhanced operational efficiency in cleanrooms. Unique selling propositions often involve optimized spectral output for specific applications, seamless integration with existing building management systems, and reduced maintenance costs.
Propelling Factors for Cleanroom Lighting Industry Growth
The cleanroom lighting market is propelled by several key factors: the increasing demand for energy-efficient lighting solutions driven by rising energy costs and environmental concerns; the stringent regulatory landscape pushing for better lighting quality and hygiene standards within cleanrooms; and the growing adoption of advanced lighting technologies such as LED and smart lighting systems, offering improved control, monitoring, and energy savings. The expanding global healthcare, electronics, and pharmaceutical sectors are significant contributors to the market's growth.
Obstacles in the Cleanroom Lighting Industry Market
Significant obstacles include the high initial investment cost associated with upgrading to advanced lighting systems, potential supply chain disruptions affecting the availability of crucial components, and the intense competition among established and emerging players, resulting in price pressure. Furthermore, the complexity of cleanroom designs and the need for customized lighting solutions can also present challenges. The estimated impact of these factors on market growth is a reduction of xx% in the CAGR.
Future Opportunities in Cleanroom Lighting Industry
Future opportunities lie in the growing adoption of smart lighting systems integrated with building management systems, the expansion into emerging markets with increasing industrial activity, and the development of specialized lighting solutions catering to niche applications. The rising focus on sustainability and energy efficiency presents a significant opportunity for energy-efficient cleanroom lighting solutions. Furthermore, advancements in UV-C disinfection lighting offer new avenues for growth.
Major Players in the Cleanroom Lighting Industry Ecosystem
- Terra Universal Inc
- Signify Holding
- Eaton Corporation Inc
- Wipro Lighting
- Kenall Manufacturing
- Solite Europe Ltd
- LUG Light Factory Sp z o o
- AB Fagerhult
- Crompton Greaves Consumer Electricals Ltd
- Paramount Industries
Key Developments in Cleanroom Lighting Industry Industry
- December 2022: Nicomac Taikisha Cleanrooms invested USD 15.2 Million in a new manufacturing facility, significantly boosting cleanroom infrastructure and indirectly impacting demand for cleanroom lighting solutions.
- May 2022: LOG's multi-million-dollar investment in a new ISO Class 8 cleanroom highlights the continued expansion of cleanroom facilities and the associated need for specialized lighting.
Strategic Cleanroom Lighting Industry Market Forecast
The Cleanroom Lighting Industry is poised for robust growth, fueled by technological advancements, increasing demand from various end-user sectors, and supportive regulatory policies. The adoption of energy-efficient LED lighting is expected to accelerate, while the integration of smart lighting systems will become increasingly prevalent. The market's overall growth trajectory indicates significant potential for market expansion across both established and emerging economies in the forecast period. The focus will increasingly shift toward sustainable, energy-efficient, and intelligent solutions.
Cleanroom Lighting Industry Segmentation
-
1. Light Source
- 1.1. LED
- 1.2. Fluorescent
-
2. Mounting Type
- 2.1. Recessed
- 2.2. Surface Mount
-
3. End-user Industry
- 3.1. Healthcare & Life Sciences
- 3.2. Electronics and Semiconductor
- 3.3. Food & Beverage
- 3.4. Other End-user Industries
Cleanroom Lighting Industry Segmentation By Geography
- 1. North America
- 2. Europe
- 3. Asia
- 4. Latin America
- 5. Middle East and Africa
Cleanroom Lighting Industry REPORT HIGHLIGHTS
| Aspects | Details |
|---|---|
| Study Period | 2019-2033 |
| Base Year | 2024 |
| Estimated Year | 2025 |
| Forecast Period | 2025-2033 |
| Historical Period | 2019-2024 |
| Growth Rate | CAGR of 5.49% from 2019-2033 |
| Segmentation |
|
Table of Contents
- 1. Introduction
- 1.1. Research Scope
- 1.2. Market Segmentation
- 1.3. Research Methodology
- 1.4. Definitions and Assumptions
- 2. Executive Summary
- 2.1. Introduction
- 3. Market Dynamics
- 3.1. Introduction
- 3.2. Market Drivers
- 3.2.1. Stringent Regulations in Healthcare and Food Processing Industries; Rising Demand for Sterile Manufacturing Areas in Pharmaceuticals Industry
- 3.3. Market Restrains
- 3.3.1. High Cost Associated With Cleanrooms and their Operations
- 3.4. Market Trends
- 3.4.1. Healthcare and Life Sciences Segment is Expected to Witness Significant Growth
- 4. Market Factor Analysis
- 4.1. Porters Five Forces
- 4.2. Supply/Value Chain
- 4.3. PESTEL analysis
- 4.4. Market Entropy
- 4.5. Patent/Trademark Analysis
- 5. Global Cleanroom Lighting Industry Analysis, Insights and Forecast, 2019-2031
- 5.1. Market Analysis, Insights and Forecast - by Light Source
- 5.1.1. LED
- 5.1.2. Fluorescent
- 5.2. Market Analysis, Insights and Forecast - by Mounting Type
- 5.2.1. Recessed
- 5.2.2. Surface Mount
- 5.3. Market Analysis, Insights and Forecast - by End-user Industry
- 5.3.1. Healthcare & Life Sciences
- 5.3.2. Electronics and Semiconductor
- 5.3.3. Food & Beverage
- 5.3.4. Other End-user Industries
- 5.4. Market Analysis, Insights and Forecast - by Region
- 5.4.1. North America
- 5.4.2. Europe
- 5.4.3. Asia
- 5.4.4. Latin America
- 5.4.5. Middle East and Africa
- 5.1. Market Analysis, Insights and Forecast - by Light Source
- 6. North America Cleanroom Lighting Industry Analysis, Insights and Forecast, 2019-2031
- 6.1. Market Analysis, Insights and Forecast - by Light Source
- 6.1.1. LED
- 6.1.2. Fluorescent
- 6.2. Market Analysis, Insights and Forecast - by Mounting Type
- 6.2.1. Recessed
- 6.2.2. Surface Mount
- 6.3. Market Analysis, Insights and Forecast - by End-user Industry
- 6.3.1. Healthcare & Life Sciences
- 6.3.2. Electronics and Semiconductor
- 6.3.3. Food & Beverage
- 6.3.4. Other End-user Industries
- 6.1. Market Analysis, Insights and Forecast - by Light Source
- 7. Europe Cleanroom Lighting Industry Analysis, Insights and Forecast, 2019-2031
- 7.1. Market Analysis, Insights and Forecast - by Light Source
- 7.1.1. LED
- 7.1.2. Fluorescent
- 7.2. Market Analysis, Insights and Forecast - by Mounting Type
- 7.2.1. Recessed
- 7.2.2. Surface Mount
- 7.3. Market Analysis, Insights and Forecast - by End-user Industry
- 7.3.1. Healthcare & Life Sciences
- 7.3.2. Electronics and Semiconductor
- 7.3.3. Food & Beverage
- 7.3.4. Other End-user Industries
- 7.1. Market Analysis, Insights and Forecast - by Light Source
- 8. Asia Cleanroom Lighting Industry Analysis, Insights and Forecast, 2019-2031
- 8.1. Market Analysis, Insights and Forecast - by Light Source
- 8.1.1. LED
- 8.1.2. Fluorescent
- 8.2. Market Analysis, Insights and Forecast - by Mounting Type
- 8.2.1. Recessed
- 8.2.2. Surface Mount
- 8.3. Market Analysis, Insights and Forecast - by End-user Industry
- 8.3.1. Healthcare & Life Sciences
- 8.3.2. Electronics and Semiconductor
- 8.3.3. Food & Beverage
- 8.3.4. Other End-user Industries
- 8.1. Market Analysis, Insights and Forecast - by Light Source
- 9. Latin America Cleanroom Lighting Industry Analysis, Insights and Forecast, 2019-2031
- 9.1. Market Analysis, Insights and Forecast - by Light Source
- 9.1.1. LED
- 9.1.2. Fluorescent
- 9.2. Market Analysis, Insights and Forecast - by Mounting Type
- 9.2.1. Recessed
- 9.2.2. Surface Mount
- 9.3. Market Analysis, Insights and Forecast - by End-user Industry
- 9.3.1. Healthcare & Life Sciences
- 9.3.2. Electronics and Semiconductor
- 9.3.3. Food & Beverage
- 9.3.4. Other End-user Industries
- 9.1. Market Analysis, Insights and Forecast - by Light Source
- 10. Middle East and Africa Cleanroom Lighting Industry Analysis, Insights and Forecast, 2019-2031
- 10.1. Market Analysis, Insights and Forecast - by Light Source
- 10.1.1. LED
- 10.1.2. Fluorescent
- 10.2. Market Analysis, Insights and Forecast - by Mounting Type
- 10.2.1. Recessed
- 10.2.2. Surface Mount
- 10.3. Market Analysis, Insights and Forecast - by End-user Industry
- 10.3.1. Healthcare & Life Sciences
- 10.3.2. Electronics and Semiconductor
- 10.3.3. Food & Beverage
- 10.3.4. Other End-user Industries
- 10.1. Market Analysis, Insights and Forecast - by Light Source
- 11. North America Cleanroom Lighting Industry Analysis, Insights and Forecast, 2019-2031
- 11.1. Market Analysis, Insights and Forecast - By Country/Sub-region
- 11.1.1.
- 12. Europe Cleanroom Lighting Industry Analysis, Insights and Forecast, 2019-2031
- 12.1. Market Analysis, Insights and Forecast - By Country/Sub-region
- 12.1.1.
- 13. Asia Pacific Cleanroom Lighting Industry Analysis, Insights and Forecast, 2019-2031
- 13.1. Market Analysis, Insights and Forecast - By Country/Sub-region
- 13.1.1.
- 14. Rest of the World Cleanroom Lighting Industry Analysis, Insights and Forecast, 2019-2031
- 14.1. Market Analysis, Insights and Forecast - By Country/Sub-region
- 14.1.1.
- 15. Competitive Analysis
- 15.1. Global Market Share Analysis 2024
- 15.2. Company Profiles
- 15.2.1 Terra Universal Inc
- 15.2.1.1. Overview
- 15.2.1.2. Products
- 15.2.1.3. SWOT Analysis
- 15.2.1.4. Recent Developments
- 15.2.1.5. Financials (Based on Availability)
- 15.2.2 Signify Holding
- 15.2.2.1. Overview
- 15.2.2.2. Products
- 15.2.2.3. SWOT Analysis
- 15.2.2.4. Recent Developments
- 15.2.2.5. Financials (Based on Availability)
- 15.2.3 Eaton Corporation Inc
- 15.2.3.1. Overview
- 15.2.3.2. Products
- 15.2.3.3. SWOT Analysis
- 15.2.3.4. Recent Developments
- 15.2.3.5. Financials (Based on Availability)
- 15.2.4 Wipro Lighting
- 15.2.4.1. Overview
- 15.2.4.2. Products
- 15.2.4.3. SWOT Analysis
- 15.2.4.4. Recent Developments
- 15.2.4.5. Financials (Based on Availability)
- 15.2.5 Kenall Manufacturing
- 15.2.5.1. Overview
- 15.2.5.2. Products
- 15.2.5.3. SWOT Analysis
- 15.2.5.4. Recent Developments
- 15.2.5.5. Financials (Based on Availability)
- 15.2.6 Solite Europe Ltd
- 15.2.6.1. Overview
- 15.2.6.2. Products
- 15.2.6.3. SWOT Analysis
- 15.2.6.4. Recent Developments
- 15.2.6.5. Financials (Based on Availability)
- 15.2.7 LUG Light Factory Sp z o o
- 15.2.7.1. Overview
- 15.2.7.2. Products
- 15.2.7.3. SWOT Analysis
- 15.2.7.4. Recent Developments
- 15.2.7.5. Financials (Based on Availability)
- 15.2.8 AB Fagerhult*List Not Exhaustive
- 15.2.8.1. Overview
- 15.2.8.2. Products
- 15.2.8.3. SWOT Analysis
- 15.2.8.4. Recent Developments
- 15.2.8.5. Financials (Based on Availability)
- 15.2.9 Crompton Greaves Consumer Electricals Ltd
- 15.2.9.1. Overview
- 15.2.9.2. Products
- 15.2.9.3. SWOT Analysis
- 15.2.9.4. Recent Developments
- 15.2.9.5. Financials (Based on Availability)
- 15.2.10 Paramount Industries
- 15.2.10.1. Overview
- 15.2.10.2. Products
- 15.2.10.3. SWOT Analysis
- 15.2.10.4. Recent Developments
- 15.2.10.5. Financials (Based on Availability)
- 15.2.1 Terra Universal Inc
List of Figures
- Figure 1: Global Cleanroom Lighting Industry Revenue Breakdown (Million, %) by Region 2024 & 2032
- Figure 2: North America Cleanroom Lighting Industry Revenue (Million), by Country 2024 & 2032
- Figure 3: North America Cleanroom Lighting Industry Revenue Share (%), by Country 2024 & 2032
- Figure 4: Europe Cleanroom Lighting Industry Revenue (Million), by Country 2024 & 2032
- Figure 5: Europe Cleanroom Lighting Industry Revenue Share (%), by Country 2024 & 2032
- Figure 6: Asia Pacific Cleanroom Lighting Industry Revenue (Million), by Country 2024 & 2032
- Figure 7: Asia Pacific Cleanroom Lighting Industry Revenue Share (%), by Country 2024 & 2032
- Figure 8: Rest of the World Cleanroom Lighting Industry Revenue (Million), by Country 2024 & 2032
- Figure 9: Rest of the World Cleanroom Lighting Industry Revenue Share (%), by Country 2024 & 2032
- Figure 10: North America Cleanroom Lighting Industry Revenue (Million), by Light Source 2024 & 2032
- Figure 11: North America Cleanroom Lighting Industry Revenue Share (%), by Light Source 2024 & 2032
- Figure 12: North America Cleanroom Lighting Industry Revenue (Million), by Mounting Type 2024 & 2032
- Figure 13: North America Cleanroom Lighting Industry Revenue Share (%), by Mounting Type 2024 & 2032
- Figure 14: North America Cleanroom Lighting Industry Revenue (Million), by End-user Industry 2024 & 2032
- Figure 15: North America Cleanroom Lighting Industry Revenue Share (%), by End-user Industry 2024 & 2032
- Figure 16: North America Cleanroom Lighting Industry Revenue (Million), by Country 2024 & 2032
- Figure 17: North America Cleanroom Lighting Industry Revenue Share (%), by Country 2024 & 2032
- Figure 18: Europe Cleanroom Lighting Industry Revenue (Million), by Light Source 2024 & 2032
- Figure 19: Europe Cleanroom Lighting Industry Revenue Share (%), by Light Source 2024 & 2032
- Figure 20: Europe Cleanroom Lighting Industry Revenue (Million), by Mounting Type 2024 & 2032
- Figure 21: Europe Cleanroom Lighting Industry Revenue Share (%), by Mounting Type 2024 & 2032
- Figure 22: Europe Cleanroom Lighting Industry Revenue (Million), by End-user Industry 2024 & 2032
- Figure 23: Europe Cleanroom Lighting Industry Revenue Share (%), by End-user Industry 2024 & 2032
- Figure 24: Europe Cleanroom Lighting Industry Revenue (Million), by Country 2024 & 2032
- Figure 25: Europe Cleanroom Lighting Industry Revenue Share (%), by Country 2024 & 2032
- Figure 26: Asia Cleanroom Lighting Industry Revenue (Million), by Light Source 2024 & 2032
- Figure 27: Asia Cleanroom Lighting Industry Revenue Share (%), by Light Source 2024 & 2032
- Figure 28: Asia Cleanroom Lighting Industry Revenue (Million), by Mounting Type 2024 & 2032
- Figure 29: Asia Cleanroom Lighting Industry Revenue Share (%), by Mounting Type 2024 & 2032
- Figure 30: Asia Cleanroom Lighting Industry Revenue (Million), by End-user Industry 2024 & 2032
- Figure 31: Asia Cleanroom Lighting Industry Revenue Share (%), by End-user Industry 2024 & 2032
- Figure 32: Asia Cleanroom Lighting Industry Revenue (Million), by Country 2024 & 2032
- Figure 33: Asia Cleanroom Lighting Industry Revenue Share (%), by Country 2024 & 2032
- Figure 34: Latin America Cleanroom Lighting Industry Revenue (Million), by Light Source 2024 & 2032
- Figure 35: Latin America Cleanroom Lighting Industry Revenue Share (%), by Light Source 2024 & 2032
- Figure 36: Latin America Cleanroom Lighting Industry Revenue (Million), by Mounting Type 2024 & 2032
- Figure 37: Latin America Cleanroom Lighting Industry Revenue Share (%), by Mounting Type 2024 & 2032
- Figure 38: Latin America Cleanroom Lighting Industry Revenue (Million), by End-user Industry 2024 & 2032
- Figure 39: Latin America Cleanroom Lighting Industry Revenue Share (%), by End-user Industry 2024 & 2032
- Figure 40: Latin America Cleanroom Lighting Industry Revenue (Million), by Country 2024 & 2032
- Figure 41: Latin America Cleanroom Lighting Industry Revenue Share (%), by Country 2024 & 2032
- Figure 42: Middle East and Africa Cleanroom Lighting Industry Revenue (Million), by Light Source 2024 & 2032
- Figure 43: Middle East and Africa Cleanroom Lighting Industry Revenue Share (%), by Light Source 2024 & 2032
- Figure 44: Middle East and Africa Cleanroom Lighting Industry Revenue (Million), by Mounting Type 2024 & 2032
- Figure 45: Middle East and Africa Cleanroom Lighting Industry Revenue Share (%), by Mounting Type 2024 & 2032
- Figure 46: Middle East and Africa Cleanroom Lighting Industry Revenue (Million), by End-user Industry 2024 & 2032
- Figure 47: Middle East and Africa Cleanroom Lighting Industry Revenue Share (%), by End-user Industry 2024 & 2032
- Figure 48: Middle East and Africa Cleanroom Lighting Industry Revenue (Million), by Country 2024 & 2032
- Figure 49: Middle East and Africa Cleanroom Lighting Industry Revenue Share (%), by Country 2024 & 2032
List of Tables
- Table 1: Global Cleanroom Lighting Industry Revenue Million Forecast, by Region 2019 & 2032
- Table 2: Global Cleanroom Lighting Industry Revenue Million Forecast, by Light Source 2019 & 2032
- Table 3: Global Cleanroom Lighting Industry Revenue Million Forecast, by Mounting Type 2019 & 2032
- Table 4: Global Cleanroom Lighting Industry Revenue Million Forecast, by End-user Industry 2019 & 2032
- Table 5: Global Cleanroom Lighting Industry Revenue Million Forecast, by Region 2019 & 2032
- Table 6: Global Cleanroom Lighting Industry Revenue Million Forecast, by Country 2019 & 2032
- Table 7: Cleanroom Lighting Industry Revenue (Million) Forecast, by Application 2019 & 2032
- Table 8: Global Cleanroom Lighting Industry Revenue Million Forecast, by Country 2019 & 2032
- Table 9: Cleanroom Lighting Industry Revenue (Million) Forecast, by Application 2019 & 2032
- Table 10: Global Cleanroom Lighting Industry Revenue Million Forecast, by Country 2019 & 2032
- Table 11: Cleanroom Lighting Industry Revenue (Million) Forecast, by Application 2019 & 2032
- Table 12: Global Cleanroom Lighting Industry Revenue Million Forecast, by Country 2019 & 2032
- Table 13: Cleanroom Lighting Industry Revenue (Million) Forecast, by Application 2019 & 2032
- Table 14: Global Cleanroom Lighting Industry Revenue Million Forecast, by Light Source 2019 & 2032
- Table 15: Global Cleanroom Lighting Industry Revenue Million Forecast, by Mounting Type 2019 & 2032
- Table 16: Global Cleanroom Lighting Industry Revenue Million Forecast, by End-user Industry 2019 & 2032
- Table 17: Global Cleanroom Lighting Industry Revenue Million Forecast, by Country 2019 & 2032
- Table 18: Global Cleanroom Lighting Industry Revenue Million Forecast, by Light Source 2019 & 2032
- Table 19: Global Cleanroom Lighting Industry Revenue Million Forecast, by Mounting Type 2019 & 2032
- Table 20: Global Cleanroom Lighting Industry Revenue Million Forecast, by End-user Industry 2019 & 2032
- Table 21: Global Cleanroom Lighting Industry Revenue Million Forecast, by Country 2019 & 2032
- Table 22: Global Cleanroom Lighting Industry Revenue Million Forecast, by Light Source 2019 & 2032
- Table 23: Global Cleanroom Lighting Industry Revenue Million Forecast, by Mounting Type 2019 & 2032
- Table 24: Global Cleanroom Lighting Industry Revenue Million Forecast, by End-user Industry 2019 & 2032
- Table 25: Global Cleanroom Lighting Industry Revenue Million Forecast, by Country 2019 & 2032
- Table 26: Global Cleanroom Lighting Industry Revenue Million Forecast, by Light Source 2019 & 2032
- Table 27: Global Cleanroom Lighting Industry Revenue Million Forecast, by Mounting Type 2019 & 2032
- Table 28: Global Cleanroom Lighting Industry Revenue Million Forecast, by End-user Industry 2019 & 2032
- Table 29: Global Cleanroom Lighting Industry Revenue Million Forecast, by Country 2019 & 2032
- Table 30: Global Cleanroom Lighting Industry Revenue Million Forecast, by Light Source 2019 & 2032
- Table 31: Global Cleanroom Lighting Industry Revenue Million Forecast, by Mounting Type 2019 & 2032
- Table 32: Global Cleanroom Lighting Industry Revenue Million Forecast, by End-user Industry 2019 & 2032
- Table 33: Global Cleanroom Lighting Industry Revenue Million Forecast, by Country 2019 & 2032
Frequently Asked Questions
1. What is the projected Compound Annual Growth Rate (CAGR) of the Cleanroom Lighting Industry?
The projected CAGR is approximately 5.49%.
2. Which companies are prominent players in the Cleanroom Lighting Industry?
Key companies in the market include Terra Universal Inc, Signify Holding, Eaton Corporation Inc, Wipro Lighting, Kenall Manufacturing, Solite Europe Ltd, LUG Light Factory Sp z o o, AB Fagerhult*List Not Exhaustive, Crompton Greaves Consumer Electricals Ltd, Paramount Industries.
3. What are the main segments of the Cleanroom Lighting Industry?
The market segments include Light Source, Mounting Type, End-user Industry.
4. Can you provide details about the market size?
The market size is estimated to be USD 0.84 Million as of 2022.
5. What are some drivers contributing to market growth?
Stringent Regulations in Healthcare and Food Processing Industries; Rising Demand for Sterile Manufacturing Areas in Pharmaceuticals Industry.
6. What are the notable trends driving market growth?
Healthcare and Life Sciences Segment is Expected to Witness Significant Growth.
7. Are there any restraints impacting market growth?
High Cost Associated With Cleanrooms and their Operations.
8. Can you provide examples of recent developments in the market?
December 2022: Nicomac Taikisha Cleanrooms announced an investment of INR 126.2 crore (USD 15.2 million) to set up its third manufacturing facility in Hyderabad, India. Taikisha is a significant provider of cleanrooms and HVAC systems for electronic devices, the food industry, lithium-ion battery manufacturing, and hydroponic farming. The company also manufactures and constructs cleanroom facilities for pharmaceuticals and vaccines in sterile industries.
9. What pricing options are available for accessing the report?
Pricing options include single-user, multi-user, and enterprise licenses priced at USD 4750, USD 5250, and USD 8750 respectively.
10. Is the market size provided in terms of value or volume?
The market size is provided in terms of value, measured in Million.
11. Are there any specific market keywords associated with the report?
Yes, the market keyword associated with the report is "Cleanroom Lighting Industry," which aids in identifying and referencing the specific market segment covered.
12. How do I determine which pricing option suits my needs best?
The pricing options vary based on user requirements and access needs. Individual users may opt for single-user licenses, while businesses requiring broader access may choose multi-user or enterprise licenses for cost-effective access to the report.
13. Are there any additional resources or data provided in the Cleanroom Lighting Industry report?
While the report offers comprehensive insights, it's advisable to review the specific contents or supplementary materials provided to ascertain if additional resources or data are available.
14. How can I stay updated on further developments or reports in the Cleanroom Lighting Industry?
To stay informed about further developments, trends, and reports in the Cleanroom Lighting Industry, consider subscribing to industry newsletters, following relevant companies and organizations, or regularly checking reputable industry news sources and publications.
Methodology
Step 1 - Identification of Relevant Samples Size from Population Database


Step 2 - Approaches for Defining Global Market Size (Value, Volume* & Price*)

Note*: In applicable scenarios
Step 3 - Data Sources
Primary Research
- Web Analytics
- Survey Reports
- Research Institute
- Latest Research Reports
- Opinion Leaders
Secondary Research
- Annual Reports
- White Paper
- Latest Press Release
- Industry Association
- Paid Database
- Investor Presentations

Step 4 - Data Triangulation
Involves using different sources of information in order to increase the validity of a study
These sources are likely to be stakeholders in a program - participants, other researchers, program staff, other community members, and so on.
Then we put all data in single framework & apply various statistical tools to find out the dynamic on the market.
During the analysis stage, feedback from the stakeholder groups would be compared to determine areas of agreement as well as areas of divergence
