

Key Insights
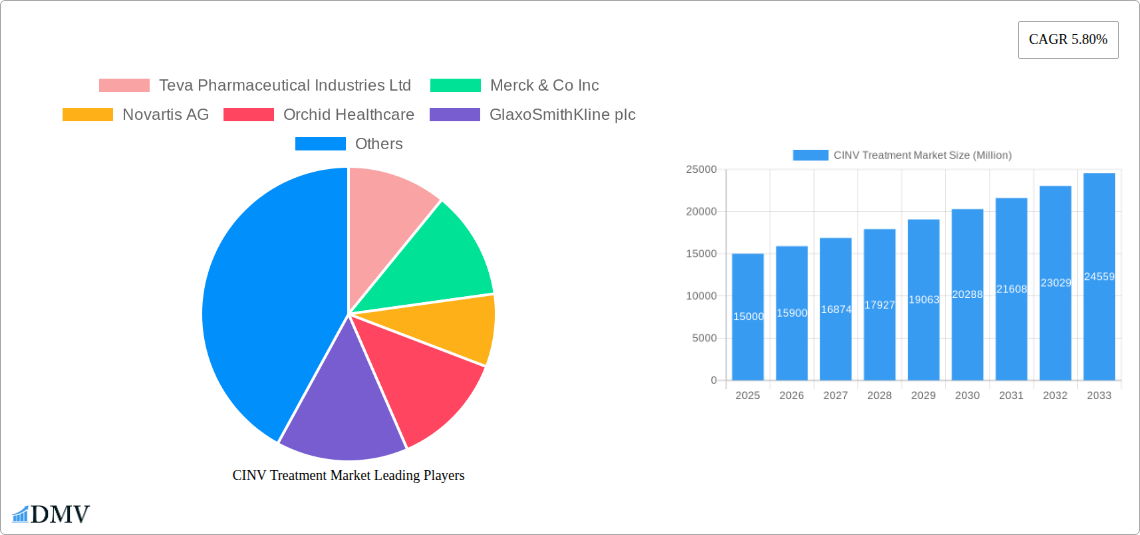
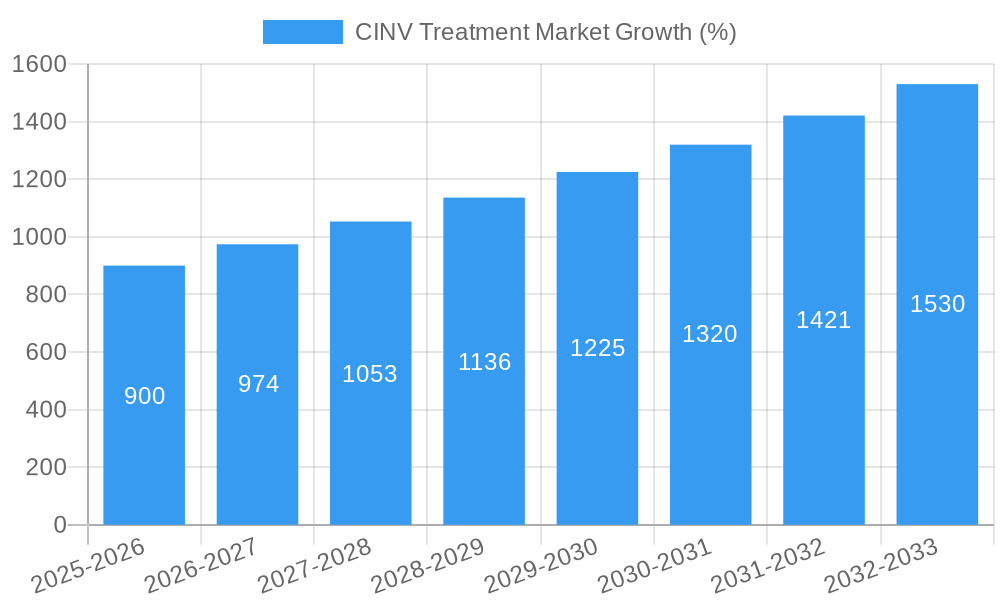
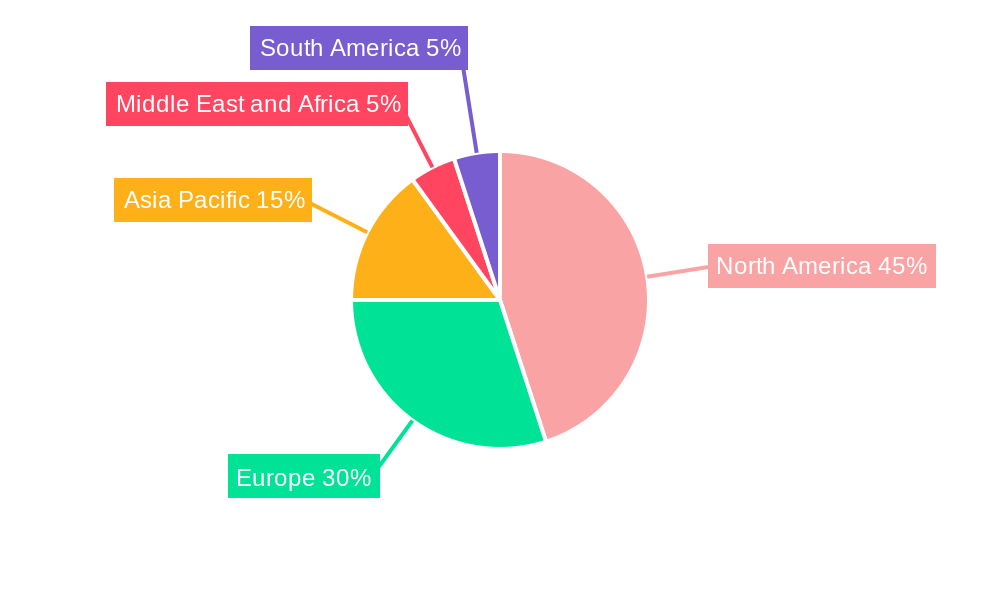
The CINV (Chemotherapy-Induced Nausea and Vomiting) Treatment Market is experiencing robust growth, projected to reach a significant market size driven by several key factors. The rising incidence of cancer globally, coupled with an aging population susceptible to cancer treatments, fuels the demand for effective CINV management. Technological advancements leading to the development of more targeted and effective antiemetic drugs, such as 5-HT3 inhibitors and NK1 receptor antagonists, are significantly contributing to market expansion. Furthermore, the increasing awareness among healthcare professionals and patients about the importance of preventing and managing CINV is driving adoption rates. The market is segmented by drug type, with 5-HT3 inhibitors and NK1 inhibitors holding substantial market share due to their established efficacy and widespread use. Hospitals and specialty clinics are major end-users, reflecting the complex nature of CINV management often requiring specialized medical expertise. While regional variations exist, North America and Europe currently dominate the market owing to higher healthcare expenditure and advanced healthcare infrastructure. However, the Asia-Pacific region exhibits promising growth potential due to rising cancer prevalence and increasing healthcare investments. Competitive dynamics within the market are intense, with major pharmaceutical companies like Teva Pharmaceutical Industries, Merck & Co., and Novartis AG leading the innovation and market share. The forecast period of 2025-2033 promises continued expansion, propelled by ongoing research into novel antiemetic therapies and the expansion of cancer treatment globally.
Despite the positive growth outlook, the market faces certain challenges. High treatment costs associated with advanced antiemetic drugs can limit accessibility, particularly in low- and middle-income countries. The emergence of drug resistance and the need for personalized treatment strategies are also ongoing concerns. Further research and development efforts are needed to address these challenges and ensure that CINV management remains accessible and effective for all patients undergoing cancer treatment. This involves a focus on developing cost-effective treatment options and exploring newer therapeutic modalities tailored to individual patient needs and cancer types. Regulatory hurdles and the complexities of clinical trials also pose a challenge to the introduction of new drugs to the market. Nonetheless, the overall outlook remains positive, with continued growth projected throughout the forecast period driven by the persistent and growing need for effective CINV management.
CINV Treatment Market: A Comprehensive Report (2019-2033)
This insightful report provides a detailed analysis of the CINV Treatment Market, offering a comprehensive overview of its current state, future trajectory, and key players. Covering the period from 2019 to 2033, with a base year of 2025 and a forecast period spanning 2025-2033, this report is an essential resource for stakeholders seeking to understand and capitalize on opportunities within this dynamic market. The global CINV treatment market is estimated to be valued at $XX Million in 2025 and is projected to reach $XX Million by 2033, exhibiting a CAGR of XX% during the forecast period.
CINV Treatment Market Composition & Trends
This section delves into the intricate composition of the CINV Treatment Market, examining market concentration, innovation drivers, regulatory landscapes, substitute products, end-user profiles, and mergers and acquisitions (M&A) activities. The market is characterized by a moderately concentrated landscape, with key players holding significant market share. The distribution is as follows: Teva Pharmaceutical Industries Ltd. holds an estimated XX% market share, followed by Merck & Co Inc. with XX%, Novartis AG at XX%, and other players accounting for the remaining XX%.
Market Dynamics:
- Innovation Catalysts: Ongoing research into novel drug mechanisms and delivery systems is driving innovation.
- Regulatory Landscape: Stringent regulatory approvals impact market entry and product lifecycle.
- Substitute Products: The availability of alternative treatments influences market competition and pricing strategies.
- End-User Profiles: Hospitals and specialty clinics constitute the largest end-user segments, driven by their specialized infrastructure and expertise.
- M&A Activity: The market has witnessed several significant M&A deals, valued at approximately $XX Million in the past five years, primarily focused on expanding product portfolios and geographical reach. Examples include [insert specific M&A examples if available, otherwise state "Examples unavailable due to data limitations"].
CINV Treatment Market Industry Evolution
The CINV treatment market has experienced significant evolution over the past decade. The historical period (2019-2024) witnessed a steady growth rate, averaging XX% annually, fueled primarily by increasing cancer incidence rates and a rising prevalence of chemotherapy-induced nausea and vomiting (CINV). Technological advancements, such as the development of more targeted and effective antiemetic drugs, have significantly improved treatment outcomes. Furthermore, shifting consumer demands towards less invasive and more convenient treatment options have influenced market dynamics. The projected growth for 2025-2033 reflects continued expansion, although the pace may moderate slightly due to increasing market saturation and the emergence of generic alternatives. Specific data points, including detailed growth rates across various segments and adoption metrics, are presented in the complete report.
Leading Regions, Countries, or Segments in CINV Treatment Market
The North American region currently dominates the CINV treatment market, driven by factors such as high healthcare expenditure, advanced healthcare infrastructure, and a relatively high prevalence of cancer.
Key Drivers by Segment:
By Drug Type:
- 5-HT3 Inhibitors: High market share due to established efficacy and widespread adoption. Drivers include established clinical efficacy and existing regulatory approvals.
- NK1 Inhibitors: Growing adoption due to improved efficacy in preventing delayed-phase CINV. Drivers include increasing awareness of superior efficacy and expansion in indications.
- Others: This segment is experiencing moderate growth with innovations in targeted therapies contributing to market expansion. Drivers include emergence of novel treatment modalities and potential for improved patient outcomes.
By End-User:
- Hospitals: Largest segment due to their comprehensive treatment capabilities and concentration of oncology patients. Drivers include the need for advanced treatments and the concentration of specialized healthcare professionals.
- Specialty Clinics: Growing segment benefiting from the increasing focus on specialized cancer care. Drivers include increased demand for personalized care and expertise in managing treatment side effects.
- Others: This segment includes ambulatory care settings and home healthcare providers, demonstrating potential for growth with technological advancements enabling remote monitoring.
CINV Treatment Market Product Innovations
Recent innovations in CINV treatment have focused on developing more effective and tolerable drugs with improved pharmacokinetic profiles. These advancements include targeted therapies designed to minimize side effects and enhance efficacy, alongside improved formulations that facilitate more convenient administration. The unique selling propositions of these innovative products include reduced nausea, vomiting, and overall improved patient quality of life during and after cancer treatment. Technological advancements such as novel drug delivery systems (e.g., sustained-release formulations) are also contributing to improved patient compliance and treatment outcomes.
Propelling Factors for CINV Treatment Market Growth
Several factors are driving the growth of the CINV treatment market. The rising incidence of cancer globally is a primary driver, coupled with an increasing awareness of the importance of managing CINV to improve patients' quality of life. Technological advancements, such as the development of new and more effective antiemetic drugs, are further accelerating market growth. Finally, supportive regulatory environments and increasing healthcare spending in several regions are contributing to market expansion.
Obstacles in the CINV Treatment Market
Despite the significant growth potential, the CINV treatment market faces several obstacles. Stringent regulatory approvals pose a significant barrier to market entry for new drugs. Furthermore, supply chain disruptions can impact the availability of essential medications. Finally, intense competition among existing players creates pricing pressures and challenges for maintaining profitability.
Future Opportunities in CINV Treatment Market
The future of the CINV treatment market holds significant opportunities. The development of novel therapies targeting specific mechanisms underlying CINV holds great promise. Expanding into emerging markets with unmet medical needs presents a considerable growth avenue. Furthermore, leveraging technological advancements to improve patient adherence and monitoring could significantly enhance treatment outcomes.
Major Players in the CINV Treatment Market Ecosystem
- Teva Pharmaceutical Industries Ltd. Teva Pharmaceutical Industries Ltd.
- Merck & Co Inc. Merck & Co Inc.
- Novartis AG Novartis AG
- Orchid Healthcare
- GlaxoSmithKline plc GlaxoSmithKline plc
- Mylan Pharmaceuticals Inc.
- Helsinn Holding S A Helsinn Holding S A
- Heron Therapeutics Inc. Heron Therapeutics Inc.
- Sun Pharmaceutical Industries Ltd. Sun Pharmaceutical Industries Ltd.
- Baxter Healthcare Baxter Healthcare
Key Developments in CINV Treatment Market Industry
- 2023: Launch of a new 5-HT3 inhibitor by [Company Name, if available].
- 2022: Approval of a novel NK1 receptor antagonist by [Regulatory Body, if available].
- 2021: Merck & Co Inc. acquires [Company Name, if available] for $XX Million.
- [Insert other relevant developments with year/month and impact if available, otherwise state "Further key developments unavailable due to data limitations"]
Strategic CINV Treatment Market Forecast
The CINV treatment market is poised for continued growth, driven by factors such as the rising prevalence of cancer, advancements in drug development, and increased healthcare spending. Future opportunities lie in the development of personalized therapies targeting specific patient subpopulations and the exploration of innovative drug delivery systems. The market is expected to witness a significant expansion, with promising growth potential across various segments and geographical regions.
CINV Treatment Market Segmentation
-
1. Drug Type
- 1.1. 5-HT3 inhibitors
- 1.2. NK1 inhibitors
- 1.3. Others
-
2. End-User
- 2.1. Hospitals
- 2.2. Specialty Clinics
- 2.3. Others
CINV Treatment Market Segmentation By Geography
-
1. North America
- 1.1. United States
- 1.2. Canada
- 1.3. Mexico
-
2. Europe
- 2.1. Germany
- 2.2. United Kingdom
- 2.3. France
- 2.4. Italy
- 2.5. Spain
- 2.6. Rest of Europe
-
3. Asia Pacific
- 3.1. China
- 3.2. Japan
- 3.3. India
- 3.4. Australia
- 3.5. South Korea
- 3.6. Rest of Asia Pacific
-
4. Middle East and Africa
- 4.1. GCC
- 4.2. South Africa
- 4.3. Rest of Middle East and Africa
-
5. South America
- 5.1. Brazil
- 5.2. Argentina
- 5.3. Rest of South America
CINV Treatment Market REPORT HIGHLIGHTS
| Aspects | Details |
|---|---|
| Study Period | 2019-2033 |
| Base Year | 2024 |
| Estimated Year | 2025 |
| Forecast Period | 2025-2033 |
| Historical Period | 2019-2024 |
| Growth Rate | CAGR of 5.80% from 2019-2033 |
| Segmentation |
|
Table of Contents
- 1. Introduction
- 1.1. Research Scope
- 1.2. Market Segmentation
- 1.3. Research Methodology
- 1.4. Definitions and Assumptions
- 2. Executive Summary
- 2.1. Introduction
- 3. Market Dynamics
- 3.1. Introduction
- 3.2. Market Drivers
- 3.2.1. ; Increasing Prevalence of Cancer; Rising Research and Development Activities for Cancer Treatments
- 3.3. Market Restrains
- 3.3.1. ; Lack of Awareness of the available Drugs
- 3.4. Market Trends
- 3.4.1. Speciality Clinics Segment is expected to Grow at a Faster rate in the Forecast Period
- 4. Market Factor Analysis
- 4.1. Porters Five Forces
- 4.2. Supply/Value Chain
- 4.3. PESTEL analysis
- 4.4. Market Entropy
- 4.5. Patent/Trademark Analysis
- 5. Global CINV Treatment Market Analysis, Insights and Forecast, 2019-2031
- 5.1. Market Analysis, Insights and Forecast - by Drug Type
- 5.1.1. 5-HT3 inhibitors
- 5.1.2. NK1 inhibitors
- 5.1.3. Others
- 5.2. Market Analysis, Insights and Forecast - by End-User
- 5.2.1. Hospitals
- 5.2.2. Specialty Clinics
- 5.2.3. Others
- 5.3. Market Analysis, Insights and Forecast - by Region
- 5.3.1. North America
- 5.3.2. Europe
- 5.3.3. Asia Pacific
- 5.3.4. Middle East and Africa
- 5.3.5. South America
- 5.1. Market Analysis, Insights and Forecast - by Drug Type
- 6. North America CINV Treatment Market Analysis, Insights and Forecast, 2019-2031
- 6.1. Market Analysis, Insights and Forecast - by Drug Type
- 6.1.1. 5-HT3 inhibitors
- 6.1.2. NK1 inhibitors
- 6.1.3. Others
- 6.2. Market Analysis, Insights and Forecast - by End-User
- 6.2.1. Hospitals
- 6.2.2. Specialty Clinics
- 6.2.3. Others
- 6.1. Market Analysis, Insights and Forecast - by Drug Type
- 7. Europe CINV Treatment Market Analysis, Insights and Forecast, 2019-2031
- 7.1. Market Analysis, Insights and Forecast - by Drug Type
- 7.1.1. 5-HT3 inhibitors
- 7.1.2. NK1 inhibitors
- 7.1.3. Others
- 7.2. Market Analysis, Insights and Forecast - by End-User
- 7.2.1. Hospitals
- 7.2.2. Specialty Clinics
- 7.2.3. Others
- 7.1. Market Analysis, Insights and Forecast - by Drug Type
- 8. Asia Pacific CINV Treatment Market Analysis, Insights and Forecast, 2019-2031
- 8.1. Market Analysis, Insights and Forecast - by Drug Type
- 8.1.1. 5-HT3 inhibitors
- 8.1.2. NK1 inhibitors
- 8.1.3. Others
- 8.2. Market Analysis, Insights and Forecast - by End-User
- 8.2.1. Hospitals
- 8.2.2. Specialty Clinics
- 8.2.3. Others
- 8.1. Market Analysis, Insights and Forecast - by Drug Type
- 9. Middle East and Africa CINV Treatment Market Analysis, Insights and Forecast, 2019-2031
- 9.1. Market Analysis, Insights and Forecast - by Drug Type
- 9.1.1. 5-HT3 inhibitors
- 9.1.2. NK1 inhibitors
- 9.1.3. Others
- 9.2. Market Analysis, Insights and Forecast - by End-User
- 9.2.1. Hospitals
- 9.2.2. Specialty Clinics
- 9.2.3. Others
- 9.1. Market Analysis, Insights and Forecast - by Drug Type
- 10. South America CINV Treatment Market Analysis, Insights and Forecast, 2019-2031
- 10.1. Market Analysis, Insights and Forecast - by Drug Type
- 10.1.1. 5-HT3 inhibitors
- 10.1.2. NK1 inhibitors
- 10.1.3. Others
- 10.2. Market Analysis, Insights and Forecast - by End-User
- 10.2.1. Hospitals
- 10.2.2. Specialty Clinics
- 10.2.3. Others
- 10.1. Market Analysis, Insights and Forecast - by Drug Type
- 11. North America CINV Treatment Market Analysis, Insights and Forecast, 2019-2031
- 11.1. Market Analysis, Insights and Forecast - By Country/Sub-region
- 11.1.1 United States
- 11.1.2 Canada
- 11.1.3 Mexico
- 12. Europe CINV Treatment Market Analysis, Insights and Forecast, 2019-2031
- 12.1. Market Analysis, Insights and Forecast - By Country/Sub-region
- 12.1.1 Germany
- 12.1.2 United Kingdom
- 12.1.3 France
- 12.1.4 Italy
- 12.1.5 Spain
- 12.1.6 Rest of Europe
- 13. Asia Pacific CINV Treatment Market Analysis, Insights and Forecast, 2019-2031
- 13.1. Market Analysis, Insights and Forecast - By Country/Sub-region
- 13.1.1 China
- 13.1.2 Japan
- 13.1.3 India
- 13.1.4 Australia
- 13.1.5 South Korea
- 13.1.6 Rest of Asia Pacific
- 14. Middle East and Africa CINV Treatment Market Analysis, Insights and Forecast, 2019-2031
- 14.1. Market Analysis, Insights and Forecast - By Country/Sub-region
- 14.1.1 GCC
- 14.1.2 South Africa
- 14.1.3 Rest of Middle East and Africa
- 15. South America CINV Treatment Market Analysis, Insights and Forecast, 2019-2031
- 15.1. Market Analysis, Insights and Forecast - By Country/Sub-region
- 15.1.1 Brazil
- 15.1.2 Argentina
- 15.1.3 Rest of South America
- 16. Competitive Analysis
- 16.1. Global Market Share Analysis 2024
- 16.2. Company Profiles
- 16.2.1 Teva Pharmaceutical Industries Ltd
- 16.2.1.1. Overview
- 16.2.1.2. Products
- 16.2.1.3. SWOT Analysis
- 16.2.1.4. Recent Developments
- 16.2.1.5. Financials (Based on Availability)
- 16.2.2 Merck & Co Inc
- 16.2.2.1. Overview
- 16.2.2.2. Products
- 16.2.2.3. SWOT Analysis
- 16.2.2.4. Recent Developments
- 16.2.2.5. Financials (Based on Availability)
- 16.2.3 Novartis AG
- 16.2.3.1. Overview
- 16.2.3.2. Products
- 16.2.3.3. SWOT Analysis
- 16.2.3.4. Recent Developments
- 16.2.3.5. Financials (Based on Availability)
- 16.2.4 Orchid Healthcare
- 16.2.4.1. Overview
- 16.2.4.2. Products
- 16.2.4.3. SWOT Analysis
- 16.2.4.4. Recent Developments
- 16.2.4.5. Financials (Based on Availability)
- 16.2.5 GlaxoSmithKline plc
- 16.2.5.1. Overview
- 16.2.5.2. Products
- 16.2.5.3. SWOT Analysis
- 16.2.5.4. Recent Developments
- 16.2.5.5. Financials (Based on Availability)
- 16.2.6 Mylan Pharmaceuticals Inc
- 16.2.6.1. Overview
- 16.2.6.2. Products
- 16.2.6.3. SWOT Analysis
- 16.2.6.4. Recent Developments
- 16.2.6.5. Financials (Based on Availability)
- 16.2.7 Helsinn Holding S A
- 16.2.7.1. Overview
- 16.2.7.2. Products
- 16.2.7.3. SWOT Analysis
- 16.2.7.4. Recent Developments
- 16.2.7.5. Financials (Based on Availability)
- 16.2.8 Heron Therapeutics Inc
- 16.2.8.1. Overview
- 16.2.8.2. Products
- 16.2.8.3. SWOT Analysis
- 16.2.8.4. Recent Developments
- 16.2.8.5. Financials (Based on Availability)
- 16.2.9 Sun Pharmaceutical Industries Ltd
- 16.2.9.1. Overview
- 16.2.9.2. Products
- 16.2.9.3. SWOT Analysis
- 16.2.9.4. Recent Developments
- 16.2.9.5. Financials (Based on Availability)
- 16.2.10 Baxter Healthcare
- 16.2.10.1. Overview
- 16.2.10.2. Products
- 16.2.10.3. SWOT Analysis
- 16.2.10.4. Recent Developments
- 16.2.10.5. Financials (Based on Availability)
- 16.2.1 Teva Pharmaceutical Industries Ltd
List of Figures
- Figure 1: Global CINV Treatment Market Revenue Breakdown (Million, %) by Region 2024 & 2032
- Figure 2: Global CINV Treatment Market Volume Breakdown (K Unit, %) by Region 2024 & 2032
- Figure 3: North America CINV Treatment Market Revenue (Million), by Country 2024 & 2032
- Figure 4: North America CINV Treatment Market Volume (K Unit), by Country 2024 & 2032
- Figure 5: North America CINV Treatment Market Revenue Share (%), by Country 2024 & 2032
- Figure 6: North America CINV Treatment Market Volume Share (%), by Country 2024 & 2032
- Figure 7: Europe CINV Treatment Market Revenue (Million), by Country 2024 & 2032
- Figure 8: Europe CINV Treatment Market Volume (K Unit), by Country 2024 & 2032
- Figure 9: Europe CINV Treatment Market Revenue Share (%), by Country 2024 & 2032
- Figure 10: Europe CINV Treatment Market Volume Share (%), by Country 2024 & 2032
- Figure 11: Asia Pacific CINV Treatment Market Revenue (Million), by Country 2024 & 2032
- Figure 12: Asia Pacific CINV Treatment Market Volume (K Unit), by Country 2024 & 2032
- Figure 13: Asia Pacific CINV Treatment Market Revenue Share (%), by Country 2024 & 2032
- Figure 14: Asia Pacific CINV Treatment Market Volume Share (%), by Country 2024 & 2032
- Figure 15: Middle East and Africa CINV Treatment Market Revenue (Million), by Country 2024 & 2032
- Figure 16: Middle East and Africa CINV Treatment Market Volume (K Unit), by Country 2024 & 2032
- Figure 17: Middle East and Africa CINV Treatment Market Revenue Share (%), by Country 2024 & 2032
- Figure 18: Middle East and Africa CINV Treatment Market Volume Share (%), by Country 2024 & 2032
- Figure 19: South America CINV Treatment Market Revenue (Million), by Country 2024 & 2032
- Figure 20: South America CINV Treatment Market Volume (K Unit), by Country 2024 & 2032
- Figure 21: South America CINV Treatment Market Revenue Share (%), by Country 2024 & 2032
- Figure 22: South America CINV Treatment Market Volume Share (%), by Country 2024 & 2032
- Figure 23: North America CINV Treatment Market Revenue (Million), by Drug Type 2024 & 2032
- Figure 24: North America CINV Treatment Market Volume (K Unit), by Drug Type 2024 & 2032
- Figure 25: North America CINV Treatment Market Revenue Share (%), by Drug Type 2024 & 2032
- Figure 26: North America CINV Treatment Market Volume Share (%), by Drug Type 2024 & 2032
- Figure 27: North America CINV Treatment Market Revenue (Million), by End-User 2024 & 2032
- Figure 28: North America CINV Treatment Market Volume (K Unit), by End-User 2024 & 2032
- Figure 29: North America CINV Treatment Market Revenue Share (%), by End-User 2024 & 2032
- Figure 30: North America CINV Treatment Market Volume Share (%), by End-User 2024 & 2032
- Figure 31: North America CINV Treatment Market Revenue (Million), by Country 2024 & 2032
- Figure 32: North America CINV Treatment Market Volume (K Unit), by Country 2024 & 2032
- Figure 33: North America CINV Treatment Market Revenue Share (%), by Country 2024 & 2032
- Figure 34: North America CINV Treatment Market Volume Share (%), by Country 2024 & 2032
- Figure 35: Europe CINV Treatment Market Revenue (Million), by Drug Type 2024 & 2032
- Figure 36: Europe CINV Treatment Market Volume (K Unit), by Drug Type 2024 & 2032
- Figure 37: Europe CINV Treatment Market Revenue Share (%), by Drug Type 2024 & 2032
- Figure 38: Europe CINV Treatment Market Volume Share (%), by Drug Type 2024 & 2032
- Figure 39: Europe CINV Treatment Market Revenue (Million), by End-User 2024 & 2032
- Figure 40: Europe CINV Treatment Market Volume (K Unit), by End-User 2024 & 2032
- Figure 41: Europe CINV Treatment Market Revenue Share (%), by End-User 2024 & 2032
- Figure 42: Europe CINV Treatment Market Volume Share (%), by End-User 2024 & 2032
- Figure 43: Europe CINV Treatment Market Revenue (Million), by Country 2024 & 2032
- Figure 44: Europe CINV Treatment Market Volume (K Unit), by Country 2024 & 2032
- Figure 45: Europe CINV Treatment Market Revenue Share (%), by Country 2024 & 2032
- Figure 46: Europe CINV Treatment Market Volume Share (%), by Country 2024 & 2032
- Figure 47: Asia Pacific CINV Treatment Market Revenue (Million), by Drug Type 2024 & 2032
- Figure 48: Asia Pacific CINV Treatment Market Volume (K Unit), by Drug Type 2024 & 2032
- Figure 49: Asia Pacific CINV Treatment Market Revenue Share (%), by Drug Type 2024 & 2032
- Figure 50: Asia Pacific CINV Treatment Market Volume Share (%), by Drug Type 2024 & 2032
- Figure 51: Asia Pacific CINV Treatment Market Revenue (Million), by End-User 2024 & 2032
- Figure 52: Asia Pacific CINV Treatment Market Volume (K Unit), by End-User 2024 & 2032
- Figure 53: Asia Pacific CINV Treatment Market Revenue Share (%), by End-User 2024 & 2032
- Figure 54: Asia Pacific CINV Treatment Market Volume Share (%), by End-User 2024 & 2032
- Figure 55: Asia Pacific CINV Treatment Market Revenue (Million), by Country 2024 & 2032
- Figure 56: Asia Pacific CINV Treatment Market Volume (K Unit), by Country 2024 & 2032
- Figure 57: Asia Pacific CINV Treatment Market Revenue Share (%), by Country 2024 & 2032
- Figure 58: Asia Pacific CINV Treatment Market Volume Share (%), by Country 2024 & 2032
- Figure 59: Middle East and Africa CINV Treatment Market Revenue (Million), by Drug Type 2024 & 2032
- Figure 60: Middle East and Africa CINV Treatment Market Volume (K Unit), by Drug Type 2024 & 2032
- Figure 61: Middle East and Africa CINV Treatment Market Revenue Share (%), by Drug Type 2024 & 2032
- Figure 62: Middle East and Africa CINV Treatment Market Volume Share (%), by Drug Type 2024 & 2032
- Figure 63: Middle East and Africa CINV Treatment Market Revenue (Million), by End-User 2024 & 2032
- Figure 64: Middle East and Africa CINV Treatment Market Volume (K Unit), by End-User 2024 & 2032
- Figure 65: Middle East and Africa CINV Treatment Market Revenue Share (%), by End-User 2024 & 2032
- Figure 66: Middle East and Africa CINV Treatment Market Volume Share (%), by End-User 2024 & 2032
- Figure 67: Middle East and Africa CINV Treatment Market Revenue (Million), by Country 2024 & 2032
- Figure 68: Middle East and Africa CINV Treatment Market Volume (K Unit), by Country 2024 & 2032
- Figure 69: Middle East and Africa CINV Treatment Market Revenue Share (%), by Country 2024 & 2032
- Figure 70: Middle East and Africa CINV Treatment Market Volume Share (%), by Country 2024 & 2032
- Figure 71: South America CINV Treatment Market Revenue (Million), by Drug Type 2024 & 2032
- Figure 72: South America CINV Treatment Market Volume (K Unit), by Drug Type 2024 & 2032
- Figure 73: South America CINV Treatment Market Revenue Share (%), by Drug Type 2024 & 2032
- Figure 74: South America CINV Treatment Market Volume Share (%), by Drug Type 2024 & 2032
- Figure 75: South America CINV Treatment Market Revenue (Million), by End-User 2024 & 2032
- Figure 76: South America CINV Treatment Market Volume (K Unit), by End-User 2024 & 2032
- Figure 77: South America CINV Treatment Market Revenue Share (%), by End-User 2024 & 2032
- Figure 78: South America CINV Treatment Market Volume Share (%), by End-User 2024 & 2032
- Figure 79: South America CINV Treatment Market Revenue (Million), by Country 2024 & 2032
- Figure 80: South America CINV Treatment Market Volume (K Unit), by Country 2024 & 2032
- Figure 81: South America CINV Treatment Market Revenue Share (%), by Country 2024 & 2032
- Figure 82: South America CINV Treatment Market Volume Share (%), by Country 2024 & 2032
List of Tables
- Table 1: Global CINV Treatment Market Revenue Million Forecast, by Region 2019 & 2032
- Table 2: Global CINV Treatment Market Volume K Unit Forecast, by Region 2019 & 2032
- Table 3: Global CINV Treatment Market Revenue Million Forecast, by Drug Type 2019 & 2032
- Table 4: Global CINV Treatment Market Volume K Unit Forecast, by Drug Type 2019 & 2032
- Table 5: Global CINV Treatment Market Revenue Million Forecast, by End-User 2019 & 2032
- Table 6: Global CINV Treatment Market Volume K Unit Forecast, by End-User 2019 & 2032
- Table 7: Global CINV Treatment Market Revenue Million Forecast, by Region 2019 & 2032
- Table 8: Global CINV Treatment Market Volume K Unit Forecast, by Region 2019 & 2032
- Table 9: Global CINV Treatment Market Revenue Million Forecast, by Country 2019 & 2032
- Table 10: Global CINV Treatment Market Volume K Unit Forecast, by Country 2019 & 2032
- Table 11: United States CINV Treatment Market Revenue (Million) Forecast, by Application 2019 & 2032
- Table 12: United States CINV Treatment Market Volume (K Unit) Forecast, by Application 2019 & 2032
- Table 13: Canada CINV Treatment Market Revenue (Million) Forecast, by Application 2019 & 2032
- Table 14: Canada CINV Treatment Market Volume (K Unit) Forecast, by Application 2019 & 2032
- Table 15: Mexico CINV Treatment Market Revenue (Million) Forecast, by Application 2019 & 2032
- Table 16: Mexico CINV Treatment Market Volume (K Unit) Forecast, by Application 2019 & 2032
- Table 17: Global CINV Treatment Market Revenue Million Forecast, by Country 2019 & 2032
- Table 18: Global CINV Treatment Market Volume K Unit Forecast, by Country 2019 & 2032
- Table 19: Germany CINV Treatment Market Revenue (Million) Forecast, by Application 2019 & 2032
- Table 20: Germany CINV Treatment Market Volume (K Unit) Forecast, by Application 2019 & 2032
- Table 21: United Kingdom CINV Treatment Market Revenue (Million) Forecast, by Application 2019 & 2032
- Table 22: United Kingdom CINV Treatment Market Volume (K Unit) Forecast, by Application 2019 & 2032
- Table 23: France CINV Treatment Market Revenue (Million) Forecast, by Application 2019 & 2032
- Table 24: France CINV Treatment Market Volume (K Unit) Forecast, by Application 2019 & 2032
- Table 25: Italy CINV Treatment Market Revenue (Million) Forecast, by Application 2019 & 2032
- Table 26: Italy CINV Treatment Market Volume (K Unit) Forecast, by Application 2019 & 2032
- Table 27: Spain CINV Treatment Market Revenue (Million) Forecast, by Application 2019 & 2032
- Table 28: Spain CINV Treatment Market Volume (K Unit) Forecast, by Application 2019 & 2032
- Table 29: Rest of Europe CINV Treatment Market Revenue (Million) Forecast, by Application 2019 & 2032
- Table 30: Rest of Europe CINV Treatment Market Volume (K Unit) Forecast, by Application 2019 & 2032
- Table 31: Global CINV Treatment Market Revenue Million Forecast, by Country 2019 & 2032
- Table 32: Global CINV Treatment Market Volume K Unit Forecast, by Country 2019 & 2032
- Table 33: China CINV Treatment Market Revenue (Million) Forecast, by Application 2019 & 2032
- Table 34: China CINV Treatment Market Volume (K Unit) Forecast, by Application 2019 & 2032
- Table 35: Japan CINV Treatment Market Revenue (Million) Forecast, by Application 2019 & 2032
- Table 36: Japan CINV Treatment Market Volume (K Unit) Forecast, by Application 2019 & 2032
- Table 37: India CINV Treatment Market Revenue (Million) Forecast, by Application 2019 & 2032
- Table 38: India CINV Treatment Market Volume (K Unit) Forecast, by Application 2019 & 2032
- Table 39: Australia CINV Treatment Market Revenue (Million) Forecast, by Application 2019 & 2032
- Table 40: Australia CINV Treatment Market Volume (K Unit) Forecast, by Application 2019 & 2032
- Table 41: South Korea CINV Treatment Market Revenue (Million) Forecast, by Application 2019 & 2032
- Table 42: South Korea CINV Treatment Market Volume (K Unit) Forecast, by Application 2019 & 2032
- Table 43: Rest of Asia Pacific CINV Treatment Market Revenue (Million) Forecast, by Application 2019 & 2032
- Table 44: Rest of Asia Pacific CINV Treatment Market Volume (K Unit) Forecast, by Application 2019 & 2032
- Table 45: Global CINV Treatment Market Revenue Million Forecast, by Country 2019 & 2032
- Table 46: Global CINV Treatment Market Volume K Unit Forecast, by Country 2019 & 2032
- Table 47: GCC CINV Treatment Market Revenue (Million) Forecast, by Application 2019 & 2032
- Table 48: GCC CINV Treatment Market Volume (K Unit) Forecast, by Application 2019 & 2032
- Table 49: South Africa CINV Treatment Market Revenue (Million) Forecast, by Application 2019 & 2032
- Table 50: South Africa CINV Treatment Market Volume (K Unit) Forecast, by Application 2019 & 2032
- Table 51: Rest of Middle East and Africa CINV Treatment Market Revenue (Million) Forecast, by Application 2019 & 2032
- Table 52: Rest of Middle East and Africa CINV Treatment Market Volume (K Unit) Forecast, by Application 2019 & 2032
- Table 53: Global CINV Treatment Market Revenue Million Forecast, by Country 2019 & 2032
- Table 54: Global CINV Treatment Market Volume K Unit Forecast, by Country 2019 & 2032
- Table 55: Brazil CINV Treatment Market Revenue (Million) Forecast, by Application 2019 & 2032
- Table 56: Brazil CINV Treatment Market Volume (K Unit) Forecast, by Application 2019 & 2032
- Table 57: Argentina CINV Treatment Market Revenue (Million) Forecast, by Application 2019 & 2032
- Table 58: Argentina CINV Treatment Market Volume (K Unit) Forecast, by Application 2019 & 2032
- Table 59: Rest of South America CINV Treatment Market Revenue (Million) Forecast, by Application 2019 & 2032
- Table 60: Rest of South America CINV Treatment Market Volume (K Unit) Forecast, by Application 2019 & 2032
- Table 61: Global CINV Treatment Market Revenue Million Forecast, by Drug Type 2019 & 2032
- Table 62: Global CINV Treatment Market Volume K Unit Forecast, by Drug Type 2019 & 2032
- Table 63: Global CINV Treatment Market Revenue Million Forecast, by End-User 2019 & 2032
- Table 64: Global CINV Treatment Market Volume K Unit Forecast, by End-User 2019 & 2032
- Table 65: Global CINV Treatment Market Revenue Million Forecast, by Country 2019 & 2032
- Table 66: Global CINV Treatment Market Volume K Unit Forecast, by Country 2019 & 2032
- Table 67: United States CINV Treatment Market Revenue (Million) Forecast, by Application 2019 & 2032
- Table 68: United States CINV Treatment Market Volume (K Unit) Forecast, by Application 2019 & 2032
- Table 69: Canada CINV Treatment Market Revenue (Million) Forecast, by Application 2019 & 2032
- Table 70: Canada CINV Treatment Market Volume (K Unit) Forecast, by Application 2019 & 2032
- Table 71: Mexico CINV Treatment Market Revenue (Million) Forecast, by Application 2019 & 2032
- Table 72: Mexico CINV Treatment Market Volume (K Unit) Forecast, by Application 2019 & 2032
- Table 73: Global CINV Treatment Market Revenue Million Forecast, by Drug Type 2019 & 2032
- Table 74: Global CINV Treatment Market Volume K Unit Forecast, by Drug Type 2019 & 2032
- Table 75: Global CINV Treatment Market Revenue Million Forecast, by End-User 2019 & 2032
- Table 76: Global CINV Treatment Market Volume K Unit Forecast, by End-User 2019 & 2032
- Table 77: Global CINV Treatment Market Revenue Million Forecast, by Country 2019 & 2032
- Table 78: Global CINV Treatment Market Volume K Unit Forecast, by Country 2019 & 2032
- Table 79: Germany CINV Treatment Market Revenue (Million) Forecast, by Application 2019 & 2032
- Table 80: Germany CINV Treatment Market Volume (K Unit) Forecast, by Application 2019 & 2032
- Table 81: United Kingdom CINV Treatment Market Revenue (Million) Forecast, by Application 2019 & 2032
- Table 82: United Kingdom CINV Treatment Market Volume (K Unit) Forecast, by Application 2019 & 2032
- Table 83: France CINV Treatment Market Revenue (Million) Forecast, by Application 2019 & 2032
- Table 84: France CINV Treatment Market Volume (K Unit) Forecast, by Application 2019 & 2032
- Table 85: Italy CINV Treatment Market Revenue (Million) Forecast, by Application 2019 & 2032
- Table 86: Italy CINV Treatment Market Volume (K Unit) Forecast, by Application 2019 & 2032
- Table 87: Spain CINV Treatment Market Revenue (Million) Forecast, by Application 2019 & 2032
- Table 88: Spain CINV Treatment Market Volume (K Unit) Forecast, by Application 2019 & 2032
- Table 89: Rest of Europe CINV Treatment Market Revenue (Million) Forecast, by Application 2019 & 2032
- Table 90: Rest of Europe CINV Treatment Market Volume (K Unit) Forecast, by Application 2019 & 2032
- Table 91: Global CINV Treatment Market Revenue Million Forecast, by Drug Type 2019 & 2032
- Table 92: Global CINV Treatment Market Volume K Unit Forecast, by Drug Type 2019 & 2032
- Table 93: Global CINV Treatment Market Revenue Million Forecast, by End-User 2019 & 2032
- Table 94: Global CINV Treatment Market Volume K Unit Forecast, by End-User 2019 & 2032
- Table 95: Global CINV Treatment Market Revenue Million Forecast, by Country 2019 & 2032
- Table 96: Global CINV Treatment Market Volume K Unit Forecast, by Country 2019 & 2032
- Table 97: China CINV Treatment Market Revenue (Million) Forecast, by Application 2019 & 2032
- Table 98: China CINV Treatment Market Volume (K Unit) Forecast, by Application 2019 & 2032
- Table 99: Japan CINV Treatment Market Revenue (Million) Forecast, by Application 2019 & 2032
- Table 100: Japan CINV Treatment Market Volume (K Unit) Forecast, by Application 2019 & 2032
- Table 101: India CINV Treatment Market Revenue (Million) Forecast, by Application 2019 & 2032
- Table 102: India CINV Treatment Market Volume (K Unit) Forecast, by Application 2019 & 2032
- Table 103: Australia CINV Treatment Market Revenue (Million) Forecast, by Application 2019 & 2032
- Table 104: Australia CINV Treatment Market Volume (K Unit) Forecast, by Application 2019 & 2032
- Table 105: South Korea CINV Treatment Market Revenue (Million) Forecast, by Application 2019 & 2032
- Table 106: South Korea CINV Treatment Market Volume (K Unit) Forecast, by Application 2019 & 2032
- Table 107: Rest of Asia Pacific CINV Treatment Market Revenue (Million) Forecast, by Application 2019 & 2032
- Table 108: Rest of Asia Pacific CINV Treatment Market Volume (K Unit) Forecast, by Application 2019 & 2032
- Table 109: Global CINV Treatment Market Revenue Million Forecast, by Drug Type 2019 & 2032
- Table 110: Global CINV Treatment Market Volume K Unit Forecast, by Drug Type 2019 & 2032
- Table 111: Global CINV Treatment Market Revenue Million Forecast, by End-User 2019 & 2032
- Table 112: Global CINV Treatment Market Volume K Unit Forecast, by End-User 2019 & 2032
- Table 113: Global CINV Treatment Market Revenue Million Forecast, by Country 2019 & 2032
- Table 114: Global CINV Treatment Market Volume K Unit Forecast, by Country 2019 & 2032
- Table 115: GCC CINV Treatment Market Revenue (Million) Forecast, by Application 2019 & 2032
- Table 116: GCC CINV Treatment Market Volume (K Unit) Forecast, by Application 2019 & 2032
- Table 117: South Africa CINV Treatment Market Revenue (Million) Forecast, by Application 2019 & 2032
- Table 118: South Africa CINV Treatment Market Volume (K Unit) Forecast, by Application 2019 & 2032
- Table 119: Rest of Middle East and Africa CINV Treatment Market Revenue (Million) Forecast, by Application 2019 & 2032
- Table 120: Rest of Middle East and Africa CINV Treatment Market Volume (K Unit) Forecast, by Application 2019 & 2032
- Table 121: Global CINV Treatment Market Revenue Million Forecast, by Drug Type 2019 & 2032
- Table 122: Global CINV Treatment Market Volume K Unit Forecast, by Drug Type 2019 & 2032
- Table 123: Global CINV Treatment Market Revenue Million Forecast, by End-User 2019 & 2032
- Table 124: Global CINV Treatment Market Volume K Unit Forecast, by End-User 2019 & 2032
- Table 125: Global CINV Treatment Market Revenue Million Forecast, by Country 2019 & 2032
- Table 126: Global CINV Treatment Market Volume K Unit Forecast, by Country 2019 & 2032
- Table 127: Brazil CINV Treatment Market Revenue (Million) Forecast, by Application 2019 & 2032
- Table 128: Brazil CINV Treatment Market Volume (K Unit) Forecast, by Application 2019 & 2032
- Table 129: Argentina CINV Treatment Market Revenue (Million) Forecast, by Application 2019 & 2032
- Table 130: Argentina CINV Treatment Market Volume (K Unit) Forecast, by Application 2019 & 2032
- Table 131: Rest of South America CINV Treatment Market Revenue (Million) Forecast, by Application 2019 & 2032
- Table 132: Rest of South America CINV Treatment Market Volume (K Unit) Forecast, by Application 2019 & 2032
Frequently Asked Questions
1. What is the projected Compound Annual Growth Rate (CAGR) of the CINV Treatment Market?
The projected CAGR is approximately 5.80%.
2. Which companies are prominent players in the CINV Treatment Market?
Key companies in the market include Teva Pharmaceutical Industries Ltd , Merck & Co Inc, Novartis AG, Orchid Healthcare, GlaxoSmithKline plc, Mylan Pharmaceuticals Inc, Helsinn Holding S A, Heron Therapeutics Inc, Sun Pharmaceutical Industries Ltd, Baxter Healthcare.
3. What are the main segments of the CINV Treatment Market?
The market segments include Drug Type, End-User.
4. Can you provide details about the market size?
The market size is estimated to be USD XX Million as of 2022.
5. What are some drivers contributing to market growth?
; Increasing Prevalence of Cancer; Rising Research and Development Activities for Cancer Treatments.
6. What are the notable trends driving market growth?
Speciality Clinics Segment is expected to Grow at a Faster rate in the Forecast Period.
7. Are there any restraints impacting market growth?
; Lack of Awareness of the available Drugs.
8. Can you provide examples of recent developments in the market?
N/A
9. What pricing options are available for accessing the report?
Pricing options include single-user, multi-user, and enterprise licenses priced at USD 4750, USD 5250, and USD 8750 respectively.
10. Is the market size provided in terms of value or volume?
The market size is provided in terms of value, measured in Million and volume, measured in K Unit.
11. Are there any specific market keywords associated with the report?
Yes, the market keyword associated with the report is "CINV Treatment Market," which aids in identifying and referencing the specific market segment covered.
12. How do I determine which pricing option suits my needs best?
The pricing options vary based on user requirements and access needs. Individual users may opt for single-user licenses, while businesses requiring broader access may choose multi-user or enterprise licenses for cost-effective access to the report.
13. Are there any additional resources or data provided in the CINV Treatment Market report?
While the report offers comprehensive insights, it's advisable to review the specific contents or supplementary materials provided to ascertain if additional resources or data are available.
14. How can I stay updated on further developments or reports in the CINV Treatment Market?
To stay informed about further developments, trends, and reports in the CINV Treatment Market, consider subscribing to industry newsletters, following relevant companies and organizations, or regularly checking reputable industry news sources and publications.
Methodology
Step 1 - Identification of Relevant Samples Size from Population Database


Step 2 - Approaches for Defining Global Market Size (Value, Volume* & Price*)

Note*: In applicable scenarios
Step 3 - Data Sources
Primary Research
- Web Analytics
- Survey Reports
- Research Institute
- Latest Research Reports
- Opinion Leaders
Secondary Research
- Annual Reports
- White Paper
- Latest Press Release
- Industry Association
- Paid Database
- Investor Presentations

Step 4 - Data Triangulation
Involves using different sources of information in order to increase the validity of a study
These sources are likely to be stakeholders in a program - participants, other researchers, program staff, other community members, and so on.
Then we put all data in single framework & apply various statistical tools to find out the dynamic on the market.
During the analysis stage, feedback from the stakeholder groups would be compared to determine areas of agreement as well as areas of divergence
