

Key Insights
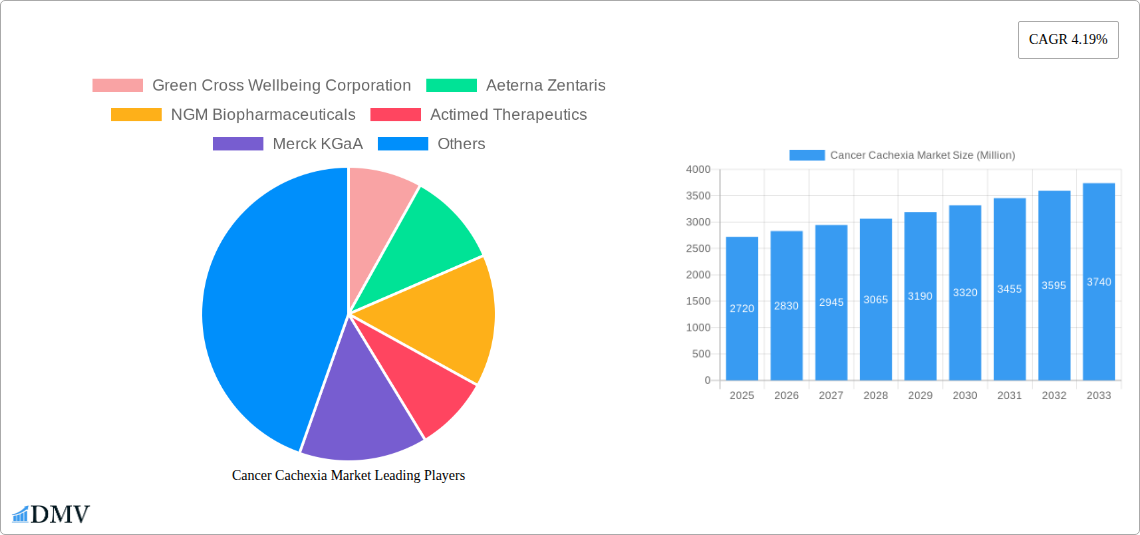
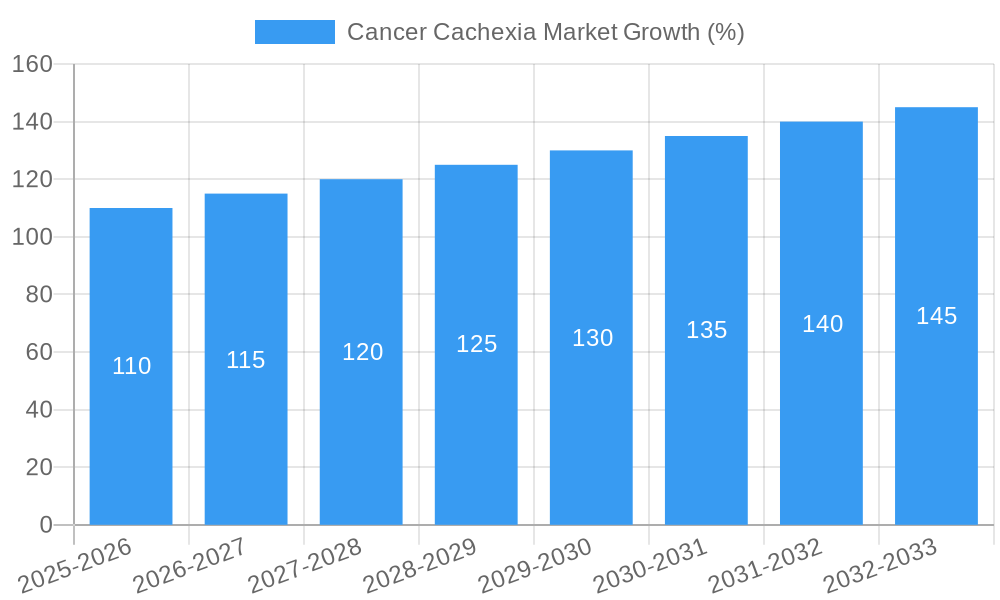
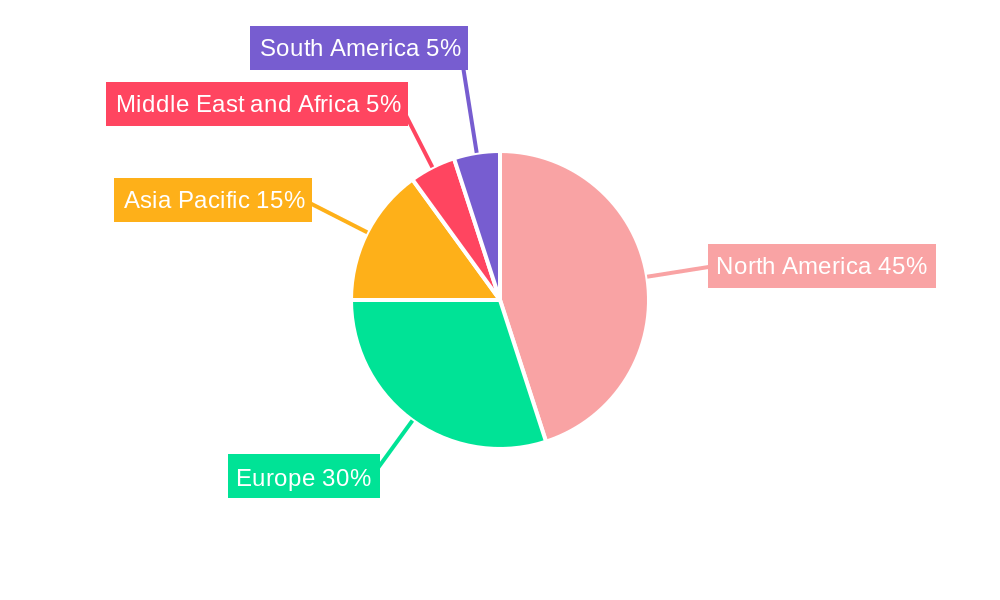
The cancer cachexia market, valued at $2.72 billion in 2025, is projected to experience robust growth, driven by rising cancer incidence globally and an increasing awareness of cachexia's debilitating effects on patients' quality of life and treatment outcomes. The market's compound annual growth rate (CAGR) of 4.19% from 2019 to 2024 suggests a continued upward trajectory through 2033. Key drivers include the development of novel therapeutics targeting the underlying mechanisms of cachexia, such as appetite stimulants and weight loss stabilizers. The increasing prevalence of various cancer types, particularly those strongly associated with cachexia like lung, pancreatic, and colorectal cancers, further fuels market expansion. While the market is segmented by therapeutics (progestogens, corticosteroids, combination therapies, and others) and mechanism of action, future growth is largely dependent on the successful clinical development and regulatory approvals of innovative therapies offering improved efficacy and reduced side effects. The geographic distribution of the market reflects variations in healthcare infrastructure and cancer prevalence, with North America and Europe currently holding significant market shares, but growth opportunities are emerging in the Asia-Pacific region due to rising healthcare expenditure and increasing cancer diagnoses. The competitive landscape includes established pharmaceutical companies alongside smaller biotechnology firms actively engaged in research and development, fostering innovation and market expansion. However, challenges remain, including the complexities of cachexia's pathophysiology, the need for more effective treatment options, and the high cost of developing and commercializing new drugs.
The forecast period from 2025 to 2033 anticipates continued market expansion due to ongoing research and development efforts, potentially leading to breakthroughs in cachexia treatment. Factors such as improved diagnostic tools and a greater understanding of the complex interplay between cancer and cachexia will contribute to more effective targeted therapies. Furthermore, growing awareness among healthcare professionals and patients about the importance of early diagnosis and management of cachexia will likely drive market growth. The continued focus on improving patient outcomes and quality of life, coupled with ongoing efforts to develop personalized medicine approaches, promises to shape the future of this market. However, challenges related to reimbursement policies, regulatory hurdles, and the need for large-scale clinical trials to validate the efficacy of new therapies must be overcome to realize the full potential of this market segment.
Cancer Cachexia Market: A Comprehensive Report (2019-2033)
This insightful report provides a detailed analysis of the Cancer Cachexia Market, offering a comprehensive overview of its current state, future trajectory, and key players. The study period spans from 2019 to 2033, with 2025 serving as the base and estimated year. The forecast period covers 2025-2033, and the historical period encompasses 2019-2024. The market is projected to reach xx Million by 2033, presenting significant opportunities for stakeholders.
Cancer Cachexia Market Composition & Trends
This section delves into the intricate dynamics of the Cancer Cachexia market, evaluating its concentration, innovation drivers, regulatory landscape, substitute products, end-user profiles, and merger & acquisition (M&A) activities. Market concentration is currently [Insert Market Concentration Data, e.g., moderately fragmented, with the top 5 players holding xx% market share]. Innovation is being driven by advancements in targeted therapies and a deeper understanding of the disease's complex pathophysiology. The regulatory landscape is [Describe Regulatory Landscape, e.g., evolving, with increasing focus on expedited approvals for promising treatments]. Substitute products include supportive care measures, but their effectiveness is limited. End-users primarily comprise oncologists, hospitals, and cancer treatment centers.
M&A activity has been [Describe M&A Activity, e.g., moderate, with several key deals focused on expanding pipelines and securing market share]. For example, [Example M&A Deal, including deal value].
- Market Share Distribution: [Provide data on market share distribution among key players. If unavailable, use estimates like: Top 3 players holding approximately 40%, next 5 players holding 30%, remaining players holding 30%.]
- M&A Deal Values: [Provide data on M&A deal values if available. If unavailable, provide estimated ranges, e.g., average deal value between $xx Million and $xx Million].
- Key Regulatory Hurdles: [List key regulatory hurdles, e.g., lengthy approval processes, stringent clinical trial requirements].
- Emerging Treatment Modalities: [List emerging treatment modalities, e.g., Immunotherapies, targeted therapies]
Cancer Cachexia Market Industry Evolution
This section traces the evolution of the Cancer Cachexia market, examining its growth trajectory, technological progress, and evolving patient needs. The market has witnessed significant growth over the past few years, driven by [Explain Growth Drivers, e.g., rising cancer prevalence, increased awareness of cachexia, and the development of novel therapies]. The compound annual growth rate (CAGR) from 2019 to 2024 is estimated to be xx%, and is projected to reach xx% during the forecast period. Technological advancements, such as the development of targeted therapies and biomarker identification, are accelerating treatment efficacy. Furthermore, patient demand for improved quality of life and less toxic treatments is fueling innovation. Adoption rates of newer therapies are [Provide Data on Adoption Rates, e.g., gradually increasing, with a projected xx% adoption rate by 2033]. [Further detail on growth trajectory, including specific data points].
Leading Regions, Countries, or Segments in Cancer Cachexia Market
This analysis identifies the leading segments and geographical regions within the Cancer Cachexia market.
Dominant Segments:
- Therapeutics: Currently, Combination Therapy shows strong potential, followed by Corticosteroids and Progestogens. Other Therapeutics is an emerging space, with novel mechanisms rapidly developing.
- Mechanism of Action: Appetite stimulants are currently the most widely used, but Weight Loss Stabilizers are showing promise and are a key area of ongoing research and development.
Key Drivers (By Segment):
- Combination Therapy: Synergistic effects leading to better patient outcomes.
- Corticosteroids: Established efficacy in managing certain symptoms of cachexia, though with limitations regarding long-term use.
- Appetite Stimulants: Directly addressing a primary symptom, improving patient well-being.
- Weight Loss Stabilizers: Targeting a key pathophysiological aspect of cachexia, with significant future potential.
Regional Dominance: [Identify the dominant region based on data, e.g., North America currently holds the largest market share, driven by high cancer prevalence and robust healthcare infrastructure. Europe and Asia Pacific are projected to experience significant growth during the forecast period].
Cancer Cachexia Market Product Innovations
The Cancer Cachexia market is witnessing significant product innovation, with a focus on targeted therapies exhibiting higher efficacy and fewer side effects compared to traditional treatments. New appetite stimulants and weight-loss stabilizers are constantly being developed. The introduction of novel delivery systems enhances treatment effectiveness while minimizing adverse events. These innovations are largely driven by improved understanding of the underlying disease mechanisms. Moreover, personalized medicine approaches are gaining traction, promising individualized treatments that cater to specific patient profiles.
Propelling Factors for Cancer Cachexia Market Growth
Several factors are driving the growth of the Cancer Cachexia market. Increased cancer incidence globally is a primary driver. Technological advancements, such as the development of targeted therapies and biomarkers, are improving diagnosis and treatment. Furthermore, rising healthcare expenditure and increasing awareness about cachexia among healthcare professionals and patients are bolstering market expansion. Favorable regulatory policies and supportive government initiatives are also contributing to the market's growth.
Obstacles in the Cancer Cachexia Market
The Cancer Cachexia market faces several challenges. High treatment costs, particularly for novel therapies, limit accessibility. The complex pathophysiology of cachexia makes treatment development challenging, leading to slower progress compared to other cancer therapies. Furthermore, clinical trial design for cachexia can be intricate, requiring specialized expertise. Regulatory approvals can be lengthy and stringent, further impacting market growth.
Future Opportunities in Cancer Cachexia Market
The Cancer Cachexia market presents considerable future opportunities. The growing adoption of personalized medicine approaches presents a significant area for expansion. Advances in drug delivery systems and targeted therapies offer avenues for improved treatment efficacy. Research into novel therapeutic targets and biomarkers holds immense potential for developing more effective therapies. Additionally, untapped markets in emerging economies offer opportunities for market expansion.
Major Players in the Cancer Cachexia Market Ecosystem
- Green Cross Wellbeing Corporation
- Aeterna Zentaris
- NGM Biopharmaceuticals
- Actimed Therapeutics
- Merck KGaA
- Fresenius Kabi
- Aavogen Inc
- TCI Peptide Therapeutics
- Cannabics Pharmaceuticals Inc
- Aveo Oncology
- Artelo Biosciences Inc
- Aphios Corporation
- Tetra Bio-Pharma
- Helsinn Group
- Bristol-Myers Squibb Company
- Pfizer Inc
Key Developments in Cancer Cachexia Market Industry
- June 2022: The team led by Rutgers Cancer Institute of New Jersey received a USD 25 Million Cancer Grand Challenges grant to research cancer cachexia. This highlights the significant research investment in this area and signals a potential for new treatment breakthroughs.
- August 2022: ARTHEx biotech launched ENTRY™, a platform for advancing its pipeline of drugs, including those for cancer cachexia, using tissue-enriched delivery of antimiRs. This represents a significant technological advancement in drug delivery and could lead to more effective cancer cachexia treatments.
Strategic Cancer Cachexia Market Forecast
The Cancer Cachexia market is poised for robust growth, driven by a confluence of factors including technological advancements in targeted therapies, increased research and development investments, and rising awareness about the disease. The development of novel therapies addressing the diverse pathophysiological mechanisms of cachexia, alongside improvements in diagnostics and personalized medicine approaches, will further fuel market expansion. This robust growth trajectory, coupled with untapped market potential in emerging economies, presents attractive investment prospects for stakeholders in the coming years.
Cancer Cachexia Market Segmentation
-
1. Therapeutics
- 1.1. Progestogens
- 1.2. Corticosteroids
- 1.3. Combination Therapy
- 1.4. Other Therapeutics
-
2. Mechanism of Action
- 2.1. Appetite Stimulators
- 2.2. Weight Loss Stabilizers
Cancer Cachexia Market Segmentation By Geography
-
1. North America
- 1.1. United States
- 1.2. Canada
- 1.3. Mexico
-
2. Europe
- 2.1. Germany
- 2.2. United Kingdom
- 2.3. France
- 2.4. Italy
- 2.5. Spain
- 2.6. Rest of Europe
-
3. Asia Pacific
- 3.1. China
- 3.2. Japan
- 3.3. India
- 3.4. Australia
- 3.5. South Korea
- 3.6. Rest of Asia Pacific
-
4. Middle East and Africa
- 4.1. GCC
- 4.2. South Africa
- 4.3. Rest of Middle East and Africa
-
5. South America
- 5.1. Brazil
- 5.2. Argentina
- 5.3. Rest of South America
Cancer Cachexia Market REPORT HIGHLIGHTS
| Aspects | Details |
|---|---|
| Study Period | 2019-2033 |
| Base Year | 2024 |
| Estimated Year | 2025 |
| Forecast Period | 2025-2033 |
| Historical Period | 2019-2024 |
| Growth Rate | CAGR of 4.19% from 2019-2033 |
| Segmentation |
|
Table of Contents
- 1. Introduction
- 1.1. Research Scope
- 1.2. Market Segmentation
- 1.3. Research Methodology
- 1.4. Definitions and Assumptions
- 2. Executive Summary
- 2.1. Introduction
- 3. Market Dynamics
- 3.1. Introduction
- 3.2. Market Drivers
- 3.2.1. Increasing Prevalence of Cancer Cachexia; Strong R&D and Product Pipeline
- 3.3. Market Restrains
- 3.3.1. Stringent Regulatory Requirements
- 3.4. Market Trends
- 3.4.1. Appetite Stimulators is Expected to Grow Significantly in the Cancer Cachexia Market
- 4. Market Factor Analysis
- 4.1. Porters Five Forces
- 4.2. Supply/Value Chain
- 4.3. PESTEL analysis
- 4.4. Market Entropy
- 4.5. Patent/Trademark Analysis
- 5. Global Cancer Cachexia Market Analysis, Insights and Forecast, 2019-2031
- 5.1. Market Analysis, Insights and Forecast - by Therapeutics
- 5.1.1. Progestogens
- 5.1.2. Corticosteroids
- 5.1.3. Combination Therapy
- 5.1.4. Other Therapeutics
- 5.2. Market Analysis, Insights and Forecast - by Mechanism of Action
- 5.2.1. Appetite Stimulators
- 5.2.2. Weight Loss Stabilizers
- 5.3. Market Analysis, Insights and Forecast - by Region
- 5.3.1. North America
- 5.3.2. Europe
- 5.3.3. Asia Pacific
- 5.3.4. Middle East and Africa
- 5.3.5. South America
- 5.1. Market Analysis, Insights and Forecast - by Therapeutics
- 6. North America Cancer Cachexia Market Analysis, Insights and Forecast, 2019-2031
- 6.1. Market Analysis, Insights and Forecast - by Therapeutics
- 6.1.1. Progestogens
- 6.1.2. Corticosteroids
- 6.1.3. Combination Therapy
- 6.1.4. Other Therapeutics
- 6.2. Market Analysis, Insights and Forecast - by Mechanism of Action
- 6.2.1. Appetite Stimulators
- 6.2.2. Weight Loss Stabilizers
- 6.1. Market Analysis, Insights and Forecast - by Therapeutics
- 7. Europe Cancer Cachexia Market Analysis, Insights and Forecast, 2019-2031
- 7.1. Market Analysis, Insights and Forecast - by Therapeutics
- 7.1.1. Progestogens
- 7.1.2. Corticosteroids
- 7.1.3. Combination Therapy
- 7.1.4. Other Therapeutics
- 7.2. Market Analysis, Insights and Forecast - by Mechanism of Action
- 7.2.1. Appetite Stimulators
- 7.2.2. Weight Loss Stabilizers
- 7.1. Market Analysis, Insights and Forecast - by Therapeutics
- 8. Asia Pacific Cancer Cachexia Market Analysis, Insights and Forecast, 2019-2031
- 8.1. Market Analysis, Insights and Forecast - by Therapeutics
- 8.1.1. Progestogens
- 8.1.2. Corticosteroids
- 8.1.3. Combination Therapy
- 8.1.4. Other Therapeutics
- 8.2. Market Analysis, Insights and Forecast - by Mechanism of Action
- 8.2.1. Appetite Stimulators
- 8.2.2. Weight Loss Stabilizers
- 8.1. Market Analysis, Insights and Forecast - by Therapeutics
- 9. Middle East and Africa Cancer Cachexia Market Analysis, Insights and Forecast, 2019-2031
- 9.1. Market Analysis, Insights and Forecast - by Therapeutics
- 9.1.1. Progestogens
- 9.1.2. Corticosteroids
- 9.1.3. Combination Therapy
- 9.1.4. Other Therapeutics
- 9.2. Market Analysis, Insights and Forecast - by Mechanism of Action
- 9.2.1. Appetite Stimulators
- 9.2.2. Weight Loss Stabilizers
- 9.1. Market Analysis, Insights and Forecast - by Therapeutics
- 10. South America Cancer Cachexia Market Analysis, Insights and Forecast, 2019-2031
- 10.1. Market Analysis, Insights and Forecast - by Therapeutics
- 10.1.1. Progestogens
- 10.1.2. Corticosteroids
- 10.1.3. Combination Therapy
- 10.1.4. Other Therapeutics
- 10.2. Market Analysis, Insights and Forecast - by Mechanism of Action
- 10.2.1. Appetite Stimulators
- 10.2.2. Weight Loss Stabilizers
- 10.1. Market Analysis, Insights and Forecast - by Therapeutics
- 11. North America Cancer Cachexia Market Analysis, Insights and Forecast, 2019-2031
- 11.1. Market Analysis, Insights and Forecast - By Country/Sub-region
- 11.1.1 United States
- 11.1.2 Canada
- 11.1.3 Mexico
- 12. Europe Cancer Cachexia Market Analysis, Insights and Forecast, 2019-2031
- 12.1. Market Analysis, Insights and Forecast - By Country/Sub-region
- 12.1.1 Germany
- 12.1.2 United Kingdom
- 12.1.3 France
- 12.1.4 Italy
- 12.1.5 Spain
- 12.1.6 Rest of Europe
- 13. Asia Pacific Cancer Cachexia Market Analysis, Insights and Forecast, 2019-2031
- 13.1. Market Analysis, Insights and Forecast - By Country/Sub-region
- 13.1.1 China
- 13.1.2 Japan
- 13.1.3 India
- 13.1.4 Australia
- 13.1.5 South Korea
- 13.1.6 Rest of Asia Pacific
- 14. Middle East and Africa Cancer Cachexia Market Analysis, Insights and Forecast, 2019-2031
- 14.1. Market Analysis, Insights and Forecast - By Country/Sub-region
- 14.1.1 GCC
- 14.1.2 South Africa
- 14.1.3 Rest of Middle East and Africa
- 15. South America Cancer Cachexia Market Analysis, Insights and Forecast, 2019-2031
- 15.1. Market Analysis, Insights and Forecast - By Country/Sub-region
- 15.1.1 Brazil
- 15.1.2 Argentina
- 15.1.3 Rest of South America
- 16. Competitive Analysis
- 16.1. Global Market Share Analysis 2024
- 16.2. Company Profiles
- 16.2.1 Green Cross Wellbeing Corporation
- 16.2.1.1. Overview
- 16.2.1.2. Products
- 16.2.1.3. SWOT Analysis
- 16.2.1.4. Recent Developments
- 16.2.1.5. Financials (Based on Availability)
- 16.2.2 Aeterna Zentaris
- 16.2.2.1. Overview
- 16.2.2.2. Products
- 16.2.2.3. SWOT Analysis
- 16.2.2.4. Recent Developments
- 16.2.2.5. Financials (Based on Availability)
- 16.2.3 NGM Biopharmaceuticals
- 16.2.3.1. Overview
- 16.2.3.2. Products
- 16.2.3.3. SWOT Analysis
- 16.2.3.4. Recent Developments
- 16.2.3.5. Financials (Based on Availability)
- 16.2.4 Actimed Therapeutics
- 16.2.4.1. Overview
- 16.2.4.2. Products
- 16.2.4.3. SWOT Analysis
- 16.2.4.4. Recent Developments
- 16.2.4.5. Financials (Based on Availability)
- 16.2.5 Merck KGaA
- 16.2.5.1. Overview
- 16.2.5.2. Products
- 16.2.5.3. SWOT Analysis
- 16.2.5.4. Recent Developments
- 16.2.5.5. Financials (Based on Availability)
- 16.2.6 Fresenius Kabi
- 16.2.6.1. Overview
- 16.2.6.2. Products
- 16.2.6.3. SWOT Analysis
- 16.2.6.4. Recent Developments
- 16.2.6.5. Financials (Based on Availability)
- 16.2.7 Aavogen Inc
- 16.2.7.1. Overview
- 16.2.7.2. Products
- 16.2.7.3. SWOT Analysis
- 16.2.7.4. Recent Developments
- 16.2.7.5. Financials (Based on Availability)
- 16.2.8 TCI Peptide Therapeutics
- 16.2.8.1. Overview
- 16.2.8.2. Products
- 16.2.8.3. SWOT Analysis
- 16.2.8.4. Recent Developments
- 16.2.8.5. Financials (Based on Availability)
- 16.2.9 Cannabics Pharmaceuticals Inc
- 16.2.9.1. Overview
- 16.2.9.2. Products
- 16.2.9.3. SWOT Analysis
- 16.2.9.4. Recent Developments
- 16.2.9.5. Financials (Based on Availability)
- 16.2.10 Aveo Oncology
- 16.2.10.1. Overview
- 16.2.10.2. Products
- 16.2.10.3. SWOT Analysis
- 16.2.10.4. Recent Developments
- 16.2.10.5. Financials (Based on Availability)
- 16.2.11 Artelo Biosciences Inc
- 16.2.11.1. Overview
- 16.2.11.2. Products
- 16.2.11.3. SWOT Analysis
- 16.2.11.4. Recent Developments
- 16.2.11.5. Financials (Based on Availability)
- 16.2.12 Aphios Corporation
- 16.2.12.1. Overview
- 16.2.12.2. Products
- 16.2.12.3. SWOT Analysis
- 16.2.12.4. Recent Developments
- 16.2.12.5. Financials (Based on Availability)
- 16.2.13 Tetra Bio-Pharma
- 16.2.13.1. Overview
- 16.2.13.2. Products
- 16.2.13.3. SWOT Analysis
- 16.2.13.4. Recent Developments
- 16.2.13.5. Financials (Based on Availability)
- 16.2.14 Helsinn Group
- 16.2.14.1. Overview
- 16.2.14.2. Products
- 16.2.14.3. SWOT Analysis
- 16.2.14.4. Recent Developments
- 16.2.14.5. Financials (Based on Availability)
- 16.2.15 Bristol-Myers Squibb Company
- 16.2.15.1. Overview
- 16.2.15.2. Products
- 16.2.15.3. SWOT Analysis
- 16.2.15.4. Recent Developments
- 16.2.15.5. Financials (Based on Availability)
- 16.2.16 Pfizer Inc
- 16.2.16.1. Overview
- 16.2.16.2. Products
- 16.2.16.3. SWOT Analysis
- 16.2.16.4. Recent Developments
- 16.2.16.5. Financials (Based on Availability)
- 16.2.1 Green Cross Wellbeing Corporation
List of Figures
- Figure 1: Global Cancer Cachexia Market Revenue Breakdown (Million, %) by Region 2024 & 2032
- Figure 2: Global Cancer Cachexia Market Volume Breakdown (K Unit, %) by Region 2024 & 2032
- Figure 3: North America Cancer Cachexia Market Revenue (Million), by Country 2024 & 2032
- Figure 4: North America Cancer Cachexia Market Volume (K Unit), by Country 2024 & 2032
- Figure 5: North America Cancer Cachexia Market Revenue Share (%), by Country 2024 & 2032
- Figure 6: North America Cancer Cachexia Market Volume Share (%), by Country 2024 & 2032
- Figure 7: Europe Cancer Cachexia Market Revenue (Million), by Country 2024 & 2032
- Figure 8: Europe Cancer Cachexia Market Volume (K Unit), by Country 2024 & 2032
- Figure 9: Europe Cancer Cachexia Market Revenue Share (%), by Country 2024 & 2032
- Figure 10: Europe Cancer Cachexia Market Volume Share (%), by Country 2024 & 2032
- Figure 11: Asia Pacific Cancer Cachexia Market Revenue (Million), by Country 2024 & 2032
- Figure 12: Asia Pacific Cancer Cachexia Market Volume (K Unit), by Country 2024 & 2032
- Figure 13: Asia Pacific Cancer Cachexia Market Revenue Share (%), by Country 2024 & 2032
- Figure 14: Asia Pacific Cancer Cachexia Market Volume Share (%), by Country 2024 & 2032
- Figure 15: Middle East and Africa Cancer Cachexia Market Revenue (Million), by Country 2024 & 2032
- Figure 16: Middle East and Africa Cancer Cachexia Market Volume (K Unit), by Country 2024 & 2032
- Figure 17: Middle East and Africa Cancer Cachexia Market Revenue Share (%), by Country 2024 & 2032
- Figure 18: Middle East and Africa Cancer Cachexia Market Volume Share (%), by Country 2024 & 2032
- Figure 19: South America Cancer Cachexia Market Revenue (Million), by Country 2024 & 2032
- Figure 20: South America Cancer Cachexia Market Volume (K Unit), by Country 2024 & 2032
- Figure 21: South America Cancer Cachexia Market Revenue Share (%), by Country 2024 & 2032
- Figure 22: South America Cancer Cachexia Market Volume Share (%), by Country 2024 & 2032
- Figure 23: North America Cancer Cachexia Market Revenue (Million), by Therapeutics 2024 & 2032
- Figure 24: North America Cancer Cachexia Market Volume (K Unit), by Therapeutics 2024 & 2032
- Figure 25: North America Cancer Cachexia Market Revenue Share (%), by Therapeutics 2024 & 2032
- Figure 26: North America Cancer Cachexia Market Volume Share (%), by Therapeutics 2024 & 2032
- Figure 27: North America Cancer Cachexia Market Revenue (Million), by Mechanism of Action 2024 & 2032
- Figure 28: North America Cancer Cachexia Market Volume (K Unit), by Mechanism of Action 2024 & 2032
- Figure 29: North America Cancer Cachexia Market Revenue Share (%), by Mechanism of Action 2024 & 2032
- Figure 30: North America Cancer Cachexia Market Volume Share (%), by Mechanism of Action 2024 & 2032
- Figure 31: North America Cancer Cachexia Market Revenue (Million), by Country 2024 & 2032
- Figure 32: North America Cancer Cachexia Market Volume (K Unit), by Country 2024 & 2032
- Figure 33: North America Cancer Cachexia Market Revenue Share (%), by Country 2024 & 2032
- Figure 34: North America Cancer Cachexia Market Volume Share (%), by Country 2024 & 2032
- Figure 35: Europe Cancer Cachexia Market Revenue (Million), by Therapeutics 2024 & 2032
- Figure 36: Europe Cancer Cachexia Market Volume (K Unit), by Therapeutics 2024 & 2032
- Figure 37: Europe Cancer Cachexia Market Revenue Share (%), by Therapeutics 2024 & 2032
- Figure 38: Europe Cancer Cachexia Market Volume Share (%), by Therapeutics 2024 & 2032
- Figure 39: Europe Cancer Cachexia Market Revenue (Million), by Mechanism of Action 2024 & 2032
- Figure 40: Europe Cancer Cachexia Market Volume (K Unit), by Mechanism of Action 2024 & 2032
- Figure 41: Europe Cancer Cachexia Market Revenue Share (%), by Mechanism of Action 2024 & 2032
- Figure 42: Europe Cancer Cachexia Market Volume Share (%), by Mechanism of Action 2024 & 2032
- Figure 43: Europe Cancer Cachexia Market Revenue (Million), by Country 2024 & 2032
- Figure 44: Europe Cancer Cachexia Market Volume (K Unit), by Country 2024 & 2032
- Figure 45: Europe Cancer Cachexia Market Revenue Share (%), by Country 2024 & 2032
- Figure 46: Europe Cancer Cachexia Market Volume Share (%), by Country 2024 & 2032
- Figure 47: Asia Pacific Cancer Cachexia Market Revenue (Million), by Therapeutics 2024 & 2032
- Figure 48: Asia Pacific Cancer Cachexia Market Volume (K Unit), by Therapeutics 2024 & 2032
- Figure 49: Asia Pacific Cancer Cachexia Market Revenue Share (%), by Therapeutics 2024 & 2032
- Figure 50: Asia Pacific Cancer Cachexia Market Volume Share (%), by Therapeutics 2024 & 2032
- Figure 51: Asia Pacific Cancer Cachexia Market Revenue (Million), by Mechanism of Action 2024 & 2032
- Figure 52: Asia Pacific Cancer Cachexia Market Volume (K Unit), by Mechanism of Action 2024 & 2032
- Figure 53: Asia Pacific Cancer Cachexia Market Revenue Share (%), by Mechanism of Action 2024 & 2032
- Figure 54: Asia Pacific Cancer Cachexia Market Volume Share (%), by Mechanism of Action 2024 & 2032
- Figure 55: Asia Pacific Cancer Cachexia Market Revenue (Million), by Country 2024 & 2032
- Figure 56: Asia Pacific Cancer Cachexia Market Volume (K Unit), by Country 2024 & 2032
- Figure 57: Asia Pacific Cancer Cachexia Market Revenue Share (%), by Country 2024 & 2032
- Figure 58: Asia Pacific Cancer Cachexia Market Volume Share (%), by Country 2024 & 2032
- Figure 59: Middle East and Africa Cancer Cachexia Market Revenue (Million), by Therapeutics 2024 & 2032
- Figure 60: Middle East and Africa Cancer Cachexia Market Volume (K Unit), by Therapeutics 2024 & 2032
- Figure 61: Middle East and Africa Cancer Cachexia Market Revenue Share (%), by Therapeutics 2024 & 2032
- Figure 62: Middle East and Africa Cancer Cachexia Market Volume Share (%), by Therapeutics 2024 & 2032
- Figure 63: Middle East and Africa Cancer Cachexia Market Revenue (Million), by Mechanism of Action 2024 & 2032
- Figure 64: Middle East and Africa Cancer Cachexia Market Volume (K Unit), by Mechanism of Action 2024 & 2032
- Figure 65: Middle East and Africa Cancer Cachexia Market Revenue Share (%), by Mechanism of Action 2024 & 2032
- Figure 66: Middle East and Africa Cancer Cachexia Market Volume Share (%), by Mechanism of Action 2024 & 2032
- Figure 67: Middle East and Africa Cancer Cachexia Market Revenue (Million), by Country 2024 & 2032
- Figure 68: Middle East and Africa Cancer Cachexia Market Volume (K Unit), by Country 2024 & 2032
- Figure 69: Middle East and Africa Cancer Cachexia Market Revenue Share (%), by Country 2024 & 2032
- Figure 70: Middle East and Africa Cancer Cachexia Market Volume Share (%), by Country 2024 & 2032
- Figure 71: South America Cancer Cachexia Market Revenue (Million), by Therapeutics 2024 & 2032
- Figure 72: South America Cancer Cachexia Market Volume (K Unit), by Therapeutics 2024 & 2032
- Figure 73: South America Cancer Cachexia Market Revenue Share (%), by Therapeutics 2024 & 2032
- Figure 74: South America Cancer Cachexia Market Volume Share (%), by Therapeutics 2024 & 2032
- Figure 75: South America Cancer Cachexia Market Revenue (Million), by Mechanism of Action 2024 & 2032
- Figure 76: South America Cancer Cachexia Market Volume (K Unit), by Mechanism of Action 2024 & 2032
- Figure 77: South America Cancer Cachexia Market Revenue Share (%), by Mechanism of Action 2024 & 2032
- Figure 78: South America Cancer Cachexia Market Volume Share (%), by Mechanism of Action 2024 & 2032
- Figure 79: South America Cancer Cachexia Market Revenue (Million), by Country 2024 & 2032
- Figure 80: South America Cancer Cachexia Market Volume (K Unit), by Country 2024 & 2032
- Figure 81: South America Cancer Cachexia Market Revenue Share (%), by Country 2024 & 2032
- Figure 82: South America Cancer Cachexia Market Volume Share (%), by Country 2024 & 2032
List of Tables
- Table 1: Global Cancer Cachexia Market Revenue Million Forecast, by Region 2019 & 2032
- Table 2: Global Cancer Cachexia Market Volume K Unit Forecast, by Region 2019 & 2032
- Table 3: Global Cancer Cachexia Market Revenue Million Forecast, by Therapeutics 2019 & 2032
- Table 4: Global Cancer Cachexia Market Volume K Unit Forecast, by Therapeutics 2019 & 2032
- Table 5: Global Cancer Cachexia Market Revenue Million Forecast, by Mechanism of Action 2019 & 2032
- Table 6: Global Cancer Cachexia Market Volume K Unit Forecast, by Mechanism of Action 2019 & 2032
- Table 7: Global Cancer Cachexia Market Revenue Million Forecast, by Region 2019 & 2032
- Table 8: Global Cancer Cachexia Market Volume K Unit Forecast, by Region 2019 & 2032
- Table 9: Global Cancer Cachexia Market Revenue Million Forecast, by Country 2019 & 2032
- Table 10: Global Cancer Cachexia Market Volume K Unit Forecast, by Country 2019 & 2032
- Table 11: United States Cancer Cachexia Market Revenue (Million) Forecast, by Application 2019 & 2032
- Table 12: United States Cancer Cachexia Market Volume (K Unit) Forecast, by Application 2019 & 2032
- Table 13: Canada Cancer Cachexia Market Revenue (Million) Forecast, by Application 2019 & 2032
- Table 14: Canada Cancer Cachexia Market Volume (K Unit) Forecast, by Application 2019 & 2032
- Table 15: Mexico Cancer Cachexia Market Revenue (Million) Forecast, by Application 2019 & 2032
- Table 16: Mexico Cancer Cachexia Market Volume (K Unit) Forecast, by Application 2019 & 2032
- Table 17: Global Cancer Cachexia Market Revenue Million Forecast, by Country 2019 & 2032
- Table 18: Global Cancer Cachexia Market Volume K Unit Forecast, by Country 2019 & 2032
- Table 19: Germany Cancer Cachexia Market Revenue (Million) Forecast, by Application 2019 & 2032
- Table 20: Germany Cancer Cachexia Market Volume (K Unit) Forecast, by Application 2019 & 2032
- Table 21: United Kingdom Cancer Cachexia Market Revenue (Million) Forecast, by Application 2019 & 2032
- Table 22: United Kingdom Cancer Cachexia Market Volume (K Unit) Forecast, by Application 2019 & 2032
- Table 23: France Cancer Cachexia Market Revenue (Million) Forecast, by Application 2019 & 2032
- Table 24: France Cancer Cachexia Market Volume (K Unit) Forecast, by Application 2019 & 2032
- Table 25: Italy Cancer Cachexia Market Revenue (Million) Forecast, by Application 2019 & 2032
- Table 26: Italy Cancer Cachexia Market Volume (K Unit) Forecast, by Application 2019 & 2032
- Table 27: Spain Cancer Cachexia Market Revenue (Million) Forecast, by Application 2019 & 2032
- Table 28: Spain Cancer Cachexia Market Volume (K Unit) Forecast, by Application 2019 & 2032
- Table 29: Rest of Europe Cancer Cachexia Market Revenue (Million) Forecast, by Application 2019 & 2032
- Table 30: Rest of Europe Cancer Cachexia Market Volume (K Unit) Forecast, by Application 2019 & 2032
- Table 31: Global Cancer Cachexia Market Revenue Million Forecast, by Country 2019 & 2032
- Table 32: Global Cancer Cachexia Market Volume K Unit Forecast, by Country 2019 & 2032
- Table 33: China Cancer Cachexia Market Revenue (Million) Forecast, by Application 2019 & 2032
- Table 34: China Cancer Cachexia Market Volume (K Unit) Forecast, by Application 2019 & 2032
- Table 35: Japan Cancer Cachexia Market Revenue (Million) Forecast, by Application 2019 & 2032
- Table 36: Japan Cancer Cachexia Market Volume (K Unit) Forecast, by Application 2019 & 2032
- Table 37: India Cancer Cachexia Market Revenue (Million) Forecast, by Application 2019 & 2032
- Table 38: India Cancer Cachexia Market Volume (K Unit) Forecast, by Application 2019 & 2032
- Table 39: Australia Cancer Cachexia Market Revenue (Million) Forecast, by Application 2019 & 2032
- Table 40: Australia Cancer Cachexia Market Volume (K Unit) Forecast, by Application 2019 & 2032
- Table 41: South Korea Cancer Cachexia Market Revenue (Million) Forecast, by Application 2019 & 2032
- Table 42: South Korea Cancer Cachexia Market Volume (K Unit) Forecast, by Application 2019 & 2032
- Table 43: Rest of Asia Pacific Cancer Cachexia Market Revenue (Million) Forecast, by Application 2019 & 2032
- Table 44: Rest of Asia Pacific Cancer Cachexia Market Volume (K Unit) Forecast, by Application 2019 & 2032
- Table 45: Global Cancer Cachexia Market Revenue Million Forecast, by Country 2019 & 2032
- Table 46: Global Cancer Cachexia Market Volume K Unit Forecast, by Country 2019 & 2032
- Table 47: GCC Cancer Cachexia Market Revenue (Million) Forecast, by Application 2019 & 2032
- Table 48: GCC Cancer Cachexia Market Volume (K Unit) Forecast, by Application 2019 & 2032
- Table 49: South Africa Cancer Cachexia Market Revenue (Million) Forecast, by Application 2019 & 2032
- Table 50: South Africa Cancer Cachexia Market Volume (K Unit) Forecast, by Application 2019 & 2032
- Table 51: Rest of Middle East and Africa Cancer Cachexia Market Revenue (Million) Forecast, by Application 2019 & 2032
- Table 52: Rest of Middle East and Africa Cancer Cachexia Market Volume (K Unit) Forecast, by Application 2019 & 2032
- Table 53: Global Cancer Cachexia Market Revenue Million Forecast, by Country 2019 & 2032
- Table 54: Global Cancer Cachexia Market Volume K Unit Forecast, by Country 2019 & 2032
- Table 55: Brazil Cancer Cachexia Market Revenue (Million) Forecast, by Application 2019 & 2032
- Table 56: Brazil Cancer Cachexia Market Volume (K Unit) Forecast, by Application 2019 & 2032
- Table 57: Argentina Cancer Cachexia Market Revenue (Million) Forecast, by Application 2019 & 2032
- Table 58: Argentina Cancer Cachexia Market Volume (K Unit) Forecast, by Application 2019 & 2032
- Table 59: Rest of South America Cancer Cachexia Market Revenue (Million) Forecast, by Application 2019 & 2032
- Table 60: Rest of South America Cancer Cachexia Market Volume (K Unit) Forecast, by Application 2019 & 2032
- Table 61: Global Cancer Cachexia Market Revenue Million Forecast, by Therapeutics 2019 & 2032
- Table 62: Global Cancer Cachexia Market Volume K Unit Forecast, by Therapeutics 2019 & 2032
- Table 63: Global Cancer Cachexia Market Revenue Million Forecast, by Mechanism of Action 2019 & 2032
- Table 64: Global Cancer Cachexia Market Volume K Unit Forecast, by Mechanism of Action 2019 & 2032
- Table 65: Global Cancer Cachexia Market Revenue Million Forecast, by Country 2019 & 2032
- Table 66: Global Cancer Cachexia Market Volume K Unit Forecast, by Country 2019 & 2032
- Table 67: United States Cancer Cachexia Market Revenue (Million) Forecast, by Application 2019 & 2032
- Table 68: United States Cancer Cachexia Market Volume (K Unit) Forecast, by Application 2019 & 2032
- Table 69: Canada Cancer Cachexia Market Revenue (Million) Forecast, by Application 2019 & 2032
- Table 70: Canada Cancer Cachexia Market Volume (K Unit) Forecast, by Application 2019 & 2032
- Table 71: Mexico Cancer Cachexia Market Revenue (Million) Forecast, by Application 2019 & 2032
- Table 72: Mexico Cancer Cachexia Market Volume (K Unit) Forecast, by Application 2019 & 2032
- Table 73: Global Cancer Cachexia Market Revenue Million Forecast, by Therapeutics 2019 & 2032
- Table 74: Global Cancer Cachexia Market Volume K Unit Forecast, by Therapeutics 2019 & 2032
- Table 75: Global Cancer Cachexia Market Revenue Million Forecast, by Mechanism of Action 2019 & 2032
- Table 76: Global Cancer Cachexia Market Volume K Unit Forecast, by Mechanism of Action 2019 & 2032
- Table 77: Global Cancer Cachexia Market Revenue Million Forecast, by Country 2019 & 2032
- Table 78: Global Cancer Cachexia Market Volume K Unit Forecast, by Country 2019 & 2032
- Table 79: Germany Cancer Cachexia Market Revenue (Million) Forecast, by Application 2019 & 2032
- Table 80: Germany Cancer Cachexia Market Volume (K Unit) Forecast, by Application 2019 & 2032
- Table 81: United Kingdom Cancer Cachexia Market Revenue (Million) Forecast, by Application 2019 & 2032
- Table 82: United Kingdom Cancer Cachexia Market Volume (K Unit) Forecast, by Application 2019 & 2032
- Table 83: France Cancer Cachexia Market Revenue (Million) Forecast, by Application 2019 & 2032
- Table 84: France Cancer Cachexia Market Volume (K Unit) Forecast, by Application 2019 & 2032
- Table 85: Italy Cancer Cachexia Market Revenue (Million) Forecast, by Application 2019 & 2032
- Table 86: Italy Cancer Cachexia Market Volume (K Unit) Forecast, by Application 2019 & 2032
- Table 87: Spain Cancer Cachexia Market Revenue (Million) Forecast, by Application 2019 & 2032
- Table 88: Spain Cancer Cachexia Market Volume (K Unit) Forecast, by Application 2019 & 2032
- Table 89: Rest of Europe Cancer Cachexia Market Revenue (Million) Forecast, by Application 2019 & 2032
- Table 90: Rest of Europe Cancer Cachexia Market Volume (K Unit) Forecast, by Application 2019 & 2032
- Table 91: Global Cancer Cachexia Market Revenue Million Forecast, by Therapeutics 2019 & 2032
- Table 92: Global Cancer Cachexia Market Volume K Unit Forecast, by Therapeutics 2019 & 2032
- Table 93: Global Cancer Cachexia Market Revenue Million Forecast, by Mechanism of Action 2019 & 2032
- Table 94: Global Cancer Cachexia Market Volume K Unit Forecast, by Mechanism of Action 2019 & 2032
- Table 95: Global Cancer Cachexia Market Revenue Million Forecast, by Country 2019 & 2032
- Table 96: Global Cancer Cachexia Market Volume K Unit Forecast, by Country 2019 & 2032
- Table 97: China Cancer Cachexia Market Revenue (Million) Forecast, by Application 2019 & 2032
- Table 98: China Cancer Cachexia Market Volume (K Unit) Forecast, by Application 2019 & 2032
- Table 99: Japan Cancer Cachexia Market Revenue (Million) Forecast, by Application 2019 & 2032
- Table 100: Japan Cancer Cachexia Market Volume (K Unit) Forecast, by Application 2019 & 2032
- Table 101: India Cancer Cachexia Market Revenue (Million) Forecast, by Application 2019 & 2032
- Table 102: India Cancer Cachexia Market Volume (K Unit) Forecast, by Application 2019 & 2032
- Table 103: Australia Cancer Cachexia Market Revenue (Million) Forecast, by Application 2019 & 2032
- Table 104: Australia Cancer Cachexia Market Volume (K Unit) Forecast, by Application 2019 & 2032
- Table 105: South Korea Cancer Cachexia Market Revenue (Million) Forecast, by Application 2019 & 2032
- Table 106: South Korea Cancer Cachexia Market Volume (K Unit) Forecast, by Application 2019 & 2032
- Table 107: Rest of Asia Pacific Cancer Cachexia Market Revenue (Million) Forecast, by Application 2019 & 2032
- Table 108: Rest of Asia Pacific Cancer Cachexia Market Volume (K Unit) Forecast, by Application 2019 & 2032
- Table 109: Global Cancer Cachexia Market Revenue Million Forecast, by Therapeutics 2019 & 2032
- Table 110: Global Cancer Cachexia Market Volume K Unit Forecast, by Therapeutics 2019 & 2032
- Table 111: Global Cancer Cachexia Market Revenue Million Forecast, by Mechanism of Action 2019 & 2032
- Table 112: Global Cancer Cachexia Market Volume K Unit Forecast, by Mechanism of Action 2019 & 2032
- Table 113: Global Cancer Cachexia Market Revenue Million Forecast, by Country 2019 & 2032
- Table 114: Global Cancer Cachexia Market Volume K Unit Forecast, by Country 2019 & 2032
- Table 115: GCC Cancer Cachexia Market Revenue (Million) Forecast, by Application 2019 & 2032
- Table 116: GCC Cancer Cachexia Market Volume (K Unit) Forecast, by Application 2019 & 2032
- Table 117: South Africa Cancer Cachexia Market Revenue (Million) Forecast, by Application 2019 & 2032
- Table 118: South Africa Cancer Cachexia Market Volume (K Unit) Forecast, by Application 2019 & 2032
- Table 119: Rest of Middle East and Africa Cancer Cachexia Market Revenue (Million) Forecast, by Application 2019 & 2032
- Table 120: Rest of Middle East and Africa Cancer Cachexia Market Volume (K Unit) Forecast, by Application 2019 & 2032
- Table 121: Global Cancer Cachexia Market Revenue Million Forecast, by Therapeutics 2019 & 2032
- Table 122: Global Cancer Cachexia Market Volume K Unit Forecast, by Therapeutics 2019 & 2032
- Table 123: Global Cancer Cachexia Market Revenue Million Forecast, by Mechanism of Action 2019 & 2032
- Table 124: Global Cancer Cachexia Market Volume K Unit Forecast, by Mechanism of Action 2019 & 2032
- Table 125: Global Cancer Cachexia Market Revenue Million Forecast, by Country 2019 & 2032
- Table 126: Global Cancer Cachexia Market Volume K Unit Forecast, by Country 2019 & 2032
- Table 127: Brazil Cancer Cachexia Market Revenue (Million) Forecast, by Application 2019 & 2032
- Table 128: Brazil Cancer Cachexia Market Volume (K Unit) Forecast, by Application 2019 & 2032
- Table 129: Argentina Cancer Cachexia Market Revenue (Million) Forecast, by Application 2019 & 2032
- Table 130: Argentina Cancer Cachexia Market Volume (K Unit) Forecast, by Application 2019 & 2032
- Table 131: Rest of South America Cancer Cachexia Market Revenue (Million) Forecast, by Application 2019 & 2032
- Table 132: Rest of South America Cancer Cachexia Market Volume (K Unit) Forecast, by Application 2019 & 2032
Frequently Asked Questions
1. What is the projected Compound Annual Growth Rate (CAGR) of the Cancer Cachexia Market?
The projected CAGR is approximately 4.19%.
2. Which companies are prominent players in the Cancer Cachexia Market?
Key companies in the market include Green Cross Wellbeing Corporation, Aeterna Zentaris, NGM Biopharmaceuticals, Actimed Therapeutics, Merck KGaA, Fresenius Kabi, Aavogen Inc, TCI Peptide Therapeutics, Cannabics Pharmaceuticals Inc, Aveo Oncology, Artelo Biosciences Inc, Aphios Corporation, Tetra Bio-Pharma, Helsinn Group, Bristol-Myers Squibb Company, Pfizer Inc.
3. What are the main segments of the Cancer Cachexia Market?
The market segments include Therapeutics, Mechanism of Action.
4. Can you provide details about the market size?
The market size is estimated to be USD 2.72 Million as of 2022.
5. What are some drivers contributing to market growth?
Increasing Prevalence of Cancer Cachexia; Strong R&D and Product Pipeline.
6. What are the notable trends driving market growth?
Appetite Stimulators is Expected to Grow Significantly in the Cancer Cachexia Market.
7. Are there any restraints impacting market growth?
Stringent Regulatory Requirements.
8. Can you provide examples of recent developments in the market?
August 2022: ARTHEx biotech launched ENTRYTM , a platform that will allow it to advance its pipeline of drugs that includes drugs for myotonic dystrophy, cancer cachexia, and osteoarthritis by providing tissue-enriched delivery of antimiRs.
9. What pricing options are available for accessing the report?
Pricing options include single-user, multi-user, and enterprise licenses priced at USD 4750, USD 5250, and USD 8750 respectively.
10. Is the market size provided in terms of value or volume?
The market size is provided in terms of value, measured in Million and volume, measured in K Unit.
11. Are there any specific market keywords associated with the report?
Yes, the market keyword associated with the report is "Cancer Cachexia Market," which aids in identifying and referencing the specific market segment covered.
12. How do I determine which pricing option suits my needs best?
The pricing options vary based on user requirements and access needs. Individual users may opt for single-user licenses, while businesses requiring broader access may choose multi-user or enterprise licenses for cost-effective access to the report.
13. Are there any additional resources or data provided in the Cancer Cachexia Market report?
While the report offers comprehensive insights, it's advisable to review the specific contents or supplementary materials provided to ascertain if additional resources or data are available.
14. How can I stay updated on further developments or reports in the Cancer Cachexia Market?
To stay informed about further developments, trends, and reports in the Cancer Cachexia Market, consider subscribing to industry newsletters, following relevant companies and organizations, or regularly checking reputable industry news sources and publications.
Methodology
Step 1 - Identification of Relevant Samples Size from Population Database


Step 2 - Approaches for Defining Global Market Size (Value, Volume* & Price*)

Note*: In applicable scenarios
Step 3 - Data Sources
Primary Research
- Web Analytics
- Survey Reports
- Research Institute
- Latest Research Reports
- Opinion Leaders
Secondary Research
- Annual Reports
- White Paper
- Latest Press Release
- Industry Association
- Paid Database
- Investor Presentations

Step 4 - Data Triangulation
Involves using different sources of information in order to increase the validity of a study
These sources are likely to be stakeholders in a program - participants, other researchers, program staff, other community members, and so on.
Then we put all data in single framework & apply various statistical tools to find out the dynamic on the market.
During the analysis stage, feedback from the stakeholder groups would be compared to determine areas of agreement as well as areas of divergence
