

Key Insights
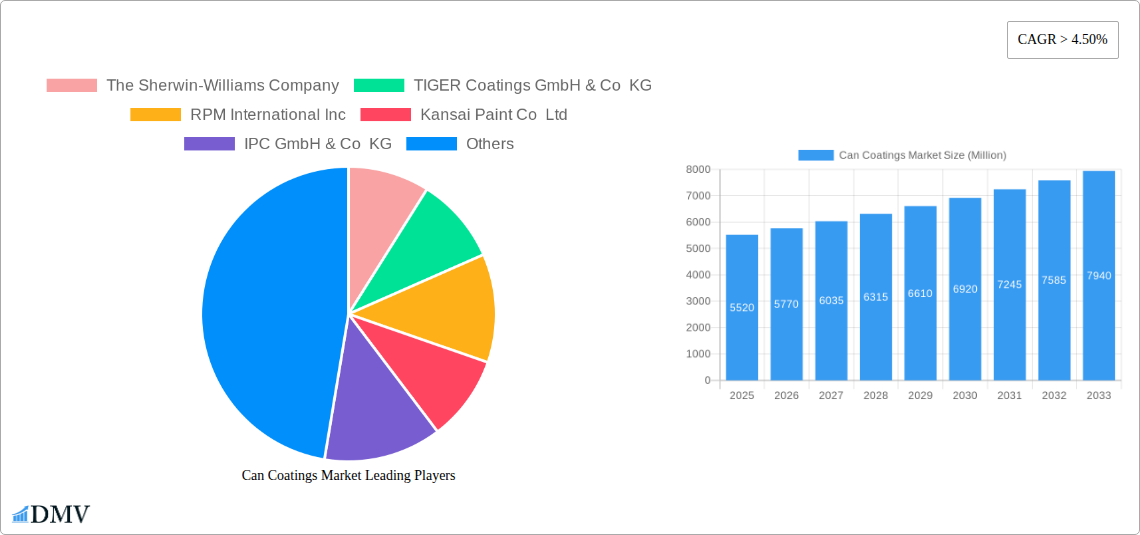
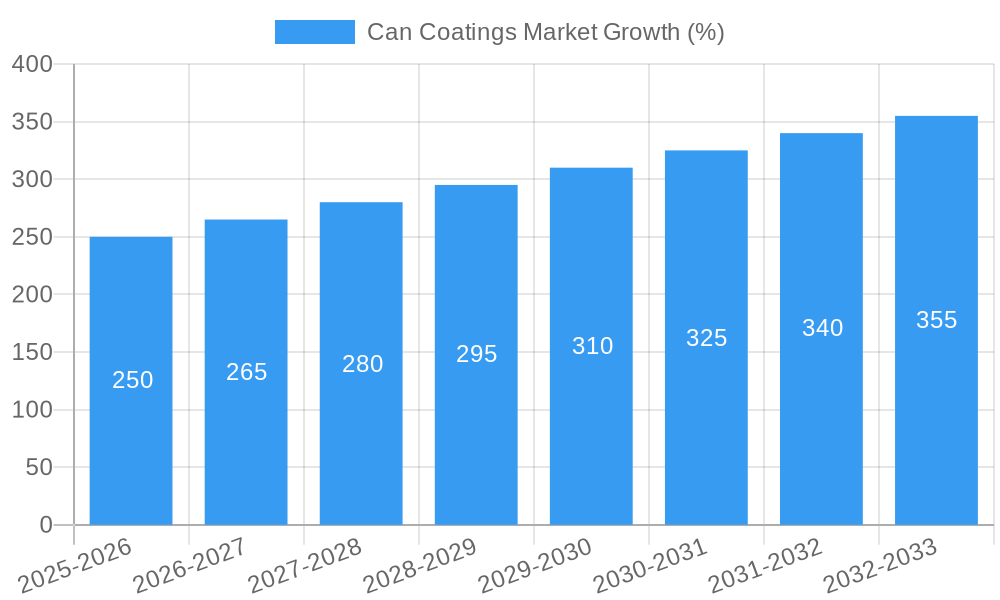
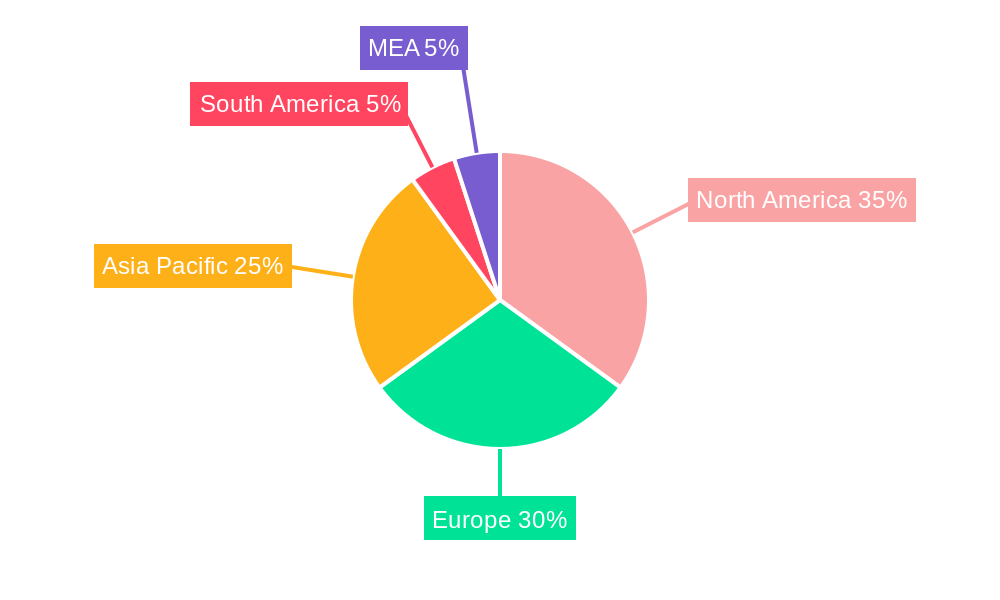
The global can coatings market, valued at $5.52 billion in 2025, is projected to experience robust growth, exhibiting a compound annual growth rate (CAGR) exceeding 4.50% from 2025 to 2033. This expansion is driven by several key factors. The burgeoning food and beverage industry, particularly the increasing demand for canned goods globally, fuels significant demand for protective and aesthetically pleasing can coatings. Furthermore, the growing preference for convenient and shelf-stable products is bolstering the market. Technological advancements in coating formulations, leading to improved durability, corrosion resistance, and enhanced printability, are also contributing to market growth. The shift towards sustainable and eco-friendly coatings, aligning with growing environmental concerns, presents a substantial opportunity for market players. However, fluctuating raw material prices and stringent regulatory compliance requirements pose challenges to market expansion. The market is segmented by type (acrylic, epoxy, polyester, and others) and application (beverage cans, food cans, aerosol cans, and others). Acrylic coatings currently dominate due to their versatility and cost-effectiveness, while epoxy coatings are preferred for their superior corrosion resistance in demanding applications. Geographically, North America and Europe currently hold significant market shares, but the Asia-Pacific region is anticipated to witness the fastest growth due to rapid industrialization and rising consumer spending. Major players such as Sherwin-Williams, PPG Industries, and Akzo Nobel are actively investing in research and development to maintain their competitive edge.
The competitive landscape is characterized by both established multinational corporations and regional players. Consolidation through mergers and acquisitions is expected to continue, driving further market concentration. Companies are focusing on strategic partnerships and collaborations to expand their product portfolios and geographical reach. The increasing emphasis on customized solutions and specialized coatings for specific can types (e.g., high-temperature resistant coatings for retort pouches) further contributes to market dynamism. The forecast period will witness increased innovation in sustainable and high-performance coatings, catering to the evolving demands of both manufacturers and consumers. The market's future trajectory is expected to remain positive, driven by consistent growth in the canned goods sector and ongoing technological improvements within the coatings industry.
Can Coatings Market: A Comprehensive Report (2019-2033)
This insightful report provides a detailed analysis of the Can Coatings Market, offering a comprehensive overview of market trends, leading players, and future growth projections from 2019 to 2033. The study covers key segments including Type (Acrylic, Epoxy, Polyester, Other Types) and Application (Beverage Can, Food Can, Aerosol Can, Other Applications), offering stakeholders a clear understanding of the market's current state and future trajectory. With a base year of 2025 and a forecast period extending to 2033, this report is an essential resource for businesses seeking to navigate this dynamic market. The total market value is estimated at xx Million in 2025, poised for significant growth in the coming years.
Can Coatings Market Market Composition & Trends
The Can Coatings market is characterized by moderate concentration, with several major players holding significant market share. The Sherwin-Williams Company, PPG Industries Inc, Akzo Nobel N.V., and RPM International Inc. are among the key players, though the market includes many smaller regional and specialized firms. Market share distribution is dynamic, influenced by innovation, pricing strategies, and M&A activities. Recent years have seen several acquisitions, with deal values ranging from xx Million to xx Million, driving consolidation. Innovation is a key driver, particularly in the development of sustainable and high-performance coatings that meet stringent regulatory requirements and consumer demands for eco-friendly products. The regulatory landscape is increasingly stringent, particularly regarding the use of BPA and other potentially harmful substances. Substitute products are limited, with can coatings offering unique functionalities like corrosion resistance and aesthetic appeal. End-users are primarily food and beverage companies and manufacturers across various industries.
- Market Concentration: Moderately concentrated, with a few major players dominating.
- Innovation Catalysts: Development of sustainable and high-performance coatings.
- Regulatory Landscape: Increasingly stringent regulations on hazardous substances.
- Substitute Products: Limited viable substitutes available.
- End-User Profiles: Primarily food and beverage companies and various industry manufacturers.
- M&A Activities: Significant M&A activity, driving consolidation. Deal values range from xx Million to xx Million.
Can Coatings Market Industry Evolution
The Can Coatings market has witnessed steady growth over the historical period (2019-2024), driven by increasing demand for canned goods, especially in emerging economies. Technological advancements in coating formulations, including the development of BPA-free options and enhanced durability, have been pivotal. Consumer preferences are shifting towards sustainable packaging, demanding eco-friendly and recyclable coatings. Growth rates have fluctuated slightly year-on-year, influenced by economic factors and fluctuations in raw material prices. Adoption of new technologies, particularly in automation and high-efficiency manufacturing processes, is steadily increasing, impacting both efficiency and cost-effectiveness. The market is projected to witness robust growth during the forecast period (2025-2033), driven by a combination of factors. This growth is fueled by the steady rise in consumer demand, product innovation, and regulatory compliance initiatives.
Leading Regions, Countries, or Segments in Can Coatings Market
The North American region, specifically the United States, currently holds a leading position in the Can Coatings market. This dominance is attributed to a strong food and beverage industry, advanced manufacturing capabilities, and early adoption of innovative coating technologies.
Key Drivers (North America):
- High demand from the beverage and food industry.
- Significant investments in advanced manufacturing facilities.
- Stringent environmental regulations driving adoption of eco-friendly coatings.
Key Drivers (Europe):
- Increasing consumer preference for sustainable packaging solutions.
- Growing demand for BPA-free and recyclable coatings.
- Initiatives focusing on resource efficiency and waste reduction.
Within the product segments, Acrylic coatings hold the largest market share due to their versatility, cost-effectiveness, and relatively good performance characteristics. Beverage cans constitute a major application segment, followed by food cans and aerosol cans.
Can Coatings Market Product Innovations
Recent innovations in can coatings have focused on improving sustainability and performance. The development of BPA-free coatings addresses growing concerns about potential health risks. Enhanced durability and corrosion resistance extend the shelf life of canned products. Improved application processes, like those employed by PPG's INNOVEL PRO coating, ensure better efficiency and reduced waste. New coating technologies aim to enhance recyclability, aligning with broader sustainability goals.
Propelling Factors for Can Coatings Market Growth
Several factors fuel the growth of the Can Coatings market:
- Technological Advancements: Development of sustainable, high-performance coatings.
- Economic Growth: Rising disposable incomes and increased consumption of canned goods.
- Regulatory Support: Stringent regulations pushing adoption of eco-friendly options. Examples include the EU's restrictions on certain hazardous substances.
- Growing Demand for Sustainable Packaging: Increased consumer preference for environmentally friendly options.
Obstacles in the Can Coatings Market Market
The Can Coatings market faces several challenges:
- Regulatory Hurdles: Stringent regulations regarding hazardous substances can increase production costs.
- Supply Chain Disruptions: Fluctuations in raw material prices and global supply chain complexities.
- Competitive Pressure: Intense competition from established and emerging players. This pressure can lead to pricing wars and reduced profit margins.
Future Opportunities in Can Coatings Market
Opportunities lie in:
- New Markets: Expanding into emerging economies with growing demand for canned goods.
- Advanced Technologies: Development of more sustainable and high-performance coatings.
- New Applications: Exploring new applications beyond traditional food and beverage cans.
Major Players in the Can Coatings Market Ecosystem
- The Sherwin-Williams Company
- TIGER Coatings GmbH & Co KG
- RPM International Inc
- Kansai Paint Co Ltd
- IPC GmbH & Co KG
- PPG Industries Inc
- TOYOCHEM CO LTD
- VPL Coatings GmbH & Co KG
- Axalta Coating Systems
- Akzo Nobel N V
- National Paints Factories Co Ltd
- Kupsa Coatings
Key Developments in Can Coatings Market Industry
- November 2023: AkzoNobel's EUR 32 million (~USD 34.99 million) investment in a new bisphenol-free coating factory signifies a major commitment to sustainable solutions in the EMEA metal packaging market.
- August 2022: PPG Industries' launch of PPG INNOVEL PRO, a BPA-free internal spray coating, demonstrates the focus on creating environmentally friendly and high-performing products for the beverage can sector.
- July 2022: PPG Industries' expansion of its Delaware facility highlights the increasing demand for high-quality coatings, particularly over-varnish coatings for beverage can exteriors.
Strategic Can Coatings Market Market Forecast
The Can Coatings market is poised for continued growth, fueled by technological innovation, increasing demand for sustainable packaging, and expanding applications across various industries. The focus on eco-friendly and high-performance coatings will continue to drive market expansion in the coming years, presenting significant opportunities for industry players to capitalize on evolving consumer preferences and regulatory requirements. The market is projected to reach xx Million by 2033, driven by these key trends.
Can Coatings Market Segmentation
-
1. Type
- 1.1. Acrylic
- 1.2. Epoxy
- 1.3. Polyester
- 1.4. Other Types
-
2. Application
- 2.1. Beverage Can
- 2.2. Food Can
- 2.3. Aerosol Can
- 2.4. Other Applications
Can Coatings Market Segmentation By Geography
-
1. Asia Pacific
- 1.1. China
- 1.2. India
- 1.3. Japan
- 1.4. South Korea
- 1.5. Indonesia
- 1.6. Malaysia
- 1.7. Thailand
- 1.8. Vietnam
- 1.9. Rest of Asia Pacific
-
2. North America
- 2.1. United States
- 2.2. Canada
- 2.3. Mexico
-
3. Europe
- 3.1. Germany
- 3.2. United Kingdom
- 3.3. France
- 3.4. Italy
- 3.5. Spain
- 3.6. Russia
- 3.7. Turkey
- 3.8. NORDIC Countries
- 3.9. Rest of Europe
-
4. South America
- 4.1. Brazil
- 4.2. Argentina
- 4.3. Colombia
- 4.4. Rest of South America
-
5. Middle East and Africa
- 5.1. Saudi Arabia
- 5.2. South Africa
- 5.3. Qatar
- 5.4. UAE
- 5.5. Egypt
- 5.6. Algeria
- 5.7. Rest of Middle East and Africa
Can Coatings Market REPORT HIGHLIGHTS
| Aspects | Details |
|---|---|
| Study Period | 2019-2033 |
| Base Year | 2024 |
| Estimated Year | 2025 |
| Forecast Period | 2025-2033 |
| Historical Period | 2019-2024 |
| Growth Rate | CAGR of > 4.50% from 2019-2033 |
| Segmentation |
|
Table of Contents
- 1. Introduction
- 1.1. Research Scope
- 1.2. Market Segmentation
- 1.3. Research Methodology
- 1.4. Definitions and Assumptions
- 2. Executive Summary
- 2.1. Introduction
- 3. Market Dynamics
- 3.1. Introduction
- 3.2. Market Drivers
- 3.2.1. Increasing Demand from Food and Beverage Packaging; Growing Utilization of Aerosol Cans for Personal Care Industry
- 3.3. Market Restrains
- 3.3.1. Stringent VOC Regulatory Policies; Other Restraints
- 3.4. Market Trends
- 3.4.1. Beverage Cans to Dominate the market
- 4. Market Factor Analysis
- 4.1. Porters Five Forces
- 4.2. Supply/Value Chain
- 4.3. PESTEL analysis
- 4.4. Market Entropy
- 4.5. Patent/Trademark Analysis
- 5. Global Can Coatings Market Analysis, Insights and Forecast, 2019-2031
- 5.1. Market Analysis, Insights and Forecast - by Type
- 5.1.1. Acrylic
- 5.1.2. Epoxy
- 5.1.3. Polyester
- 5.1.4. Other Types
- 5.2. Market Analysis, Insights and Forecast - by Application
- 5.2.1. Beverage Can
- 5.2.2. Food Can
- 5.2.3. Aerosol Can
- 5.2.4. Other Applications
- 5.3. Market Analysis, Insights and Forecast - by Region
- 5.3.1. Asia Pacific
- 5.3.2. North America
- 5.3.3. Europe
- 5.3.4. South America
- 5.3.5. Middle East and Africa
- 5.1. Market Analysis, Insights and Forecast - by Type
- 6. Asia Pacific Can Coatings Market Analysis, Insights and Forecast, 2019-2031
- 6.1. Market Analysis, Insights and Forecast - by Type
- 6.1.1. Acrylic
- 6.1.2. Epoxy
- 6.1.3. Polyester
- 6.1.4. Other Types
- 6.2. Market Analysis, Insights and Forecast - by Application
- 6.2.1. Beverage Can
- 6.2.2. Food Can
- 6.2.3. Aerosol Can
- 6.2.4. Other Applications
- 6.1. Market Analysis, Insights and Forecast - by Type
- 7. North America Can Coatings Market Analysis, Insights and Forecast, 2019-2031
- 7.1. Market Analysis, Insights and Forecast - by Type
- 7.1.1. Acrylic
- 7.1.2. Epoxy
- 7.1.3. Polyester
- 7.1.4. Other Types
- 7.2. Market Analysis, Insights and Forecast - by Application
- 7.2.1. Beverage Can
- 7.2.2. Food Can
- 7.2.3. Aerosol Can
- 7.2.4. Other Applications
- 7.1. Market Analysis, Insights and Forecast - by Type
- 8. Europe Can Coatings Market Analysis, Insights and Forecast, 2019-2031
- 8.1. Market Analysis, Insights and Forecast - by Type
- 8.1.1. Acrylic
- 8.1.2. Epoxy
- 8.1.3. Polyester
- 8.1.4. Other Types
- 8.2. Market Analysis, Insights and Forecast - by Application
- 8.2.1. Beverage Can
- 8.2.2. Food Can
- 8.2.3. Aerosol Can
- 8.2.4. Other Applications
- 8.1. Market Analysis, Insights and Forecast - by Type
- 9. South America Can Coatings Market Analysis, Insights and Forecast, 2019-2031
- 9.1. Market Analysis, Insights and Forecast - by Type
- 9.1.1. Acrylic
- 9.1.2. Epoxy
- 9.1.3. Polyester
- 9.1.4. Other Types
- 9.2. Market Analysis, Insights and Forecast - by Application
- 9.2.1. Beverage Can
- 9.2.2. Food Can
- 9.2.3. Aerosol Can
- 9.2.4. Other Applications
- 9.1. Market Analysis, Insights and Forecast - by Type
- 10. Middle East and Africa Can Coatings Market Analysis, Insights and Forecast, 2019-2031
- 10.1. Market Analysis, Insights and Forecast - by Type
- 10.1.1. Acrylic
- 10.1.2. Epoxy
- 10.1.3. Polyester
- 10.1.4. Other Types
- 10.2. Market Analysis, Insights and Forecast - by Application
- 10.2.1. Beverage Can
- 10.2.2. Food Can
- 10.2.3. Aerosol Can
- 10.2.4. Other Applications
- 10.1. Market Analysis, Insights and Forecast - by Type
- 11. North America Can Coatings Market Analysis, Insights and Forecast, 2019-2031
- 11.1. Market Analysis, Insights and Forecast - By Country/Sub-region
- 11.1.1 United States
- 11.1.2 Canada
- 11.1.3 Mexico
- 12. Europe Can Coatings Market Analysis, Insights and Forecast, 2019-2031
- 12.1. Market Analysis, Insights and Forecast - By Country/Sub-region
- 12.1.1 Germany
- 12.1.2 United Kingdom
- 12.1.3 France
- 12.1.4 Spain
- 12.1.5 Italy
- 12.1.6 Spain
- 12.1.7 Belgium
- 12.1.8 Netherland
- 12.1.9 Nordics
- 12.1.10 Rest of Europe
- 13. Asia Pacific Can Coatings Market Analysis, Insights and Forecast, 2019-2031
- 13.1. Market Analysis, Insights and Forecast - By Country/Sub-region
- 13.1.1 China
- 13.1.2 Japan
- 13.1.3 India
- 13.1.4 South Korea
- 13.1.5 Southeast Asia
- 13.1.6 Australia
- 13.1.7 Indonesia
- 13.1.8 Phillipes
- 13.1.9 Singapore
- 13.1.10 Thailandc
- 13.1.11 Rest of Asia Pacific
- 14. South America Can Coatings Market Analysis, Insights and Forecast, 2019-2031
- 14.1. Market Analysis, Insights and Forecast - By Country/Sub-region
- 14.1.1 Brazil
- 14.1.2 Argentina
- 14.1.3 Peru
- 14.1.4 Chile
- 14.1.5 Colombia
- 14.1.6 Ecuador
- 14.1.7 Venezuela
- 14.1.8 Rest of South America
- 15. MEA Can Coatings Market Analysis, Insights and Forecast, 2019-2031
- 15.1. Market Analysis, Insights and Forecast - By Country/Sub-region
- 15.1.1 United Arab Emirates
- 15.1.2 Saudi Arabia
- 15.1.3 South Africa
- 15.1.4 Rest of Middle East and Africa
- 16. Competitive Analysis
- 16.1. Global Market Share Analysis 2024
- 16.2. Company Profiles
- 16.2.1 The Sherwin-Williams Company
- 16.2.1.1. Overview
- 16.2.1.2. Products
- 16.2.1.3. SWOT Analysis
- 16.2.1.4. Recent Developments
- 16.2.1.5. Financials (Based on Availability)
- 16.2.2 TIGER Coatings GmbH & Co KG
- 16.2.2.1. Overview
- 16.2.2.2. Products
- 16.2.2.3. SWOT Analysis
- 16.2.2.4. Recent Developments
- 16.2.2.5. Financials (Based on Availability)
- 16.2.3 RPM International Inc
- 16.2.3.1. Overview
- 16.2.3.2. Products
- 16.2.3.3. SWOT Analysis
- 16.2.3.4. Recent Developments
- 16.2.3.5. Financials (Based on Availability)
- 16.2.4 Kansai Paint Co Ltd
- 16.2.4.1. Overview
- 16.2.4.2. Products
- 16.2.4.3. SWOT Analysis
- 16.2.4.4. Recent Developments
- 16.2.4.5. Financials (Based on Availability)
- 16.2.5 IPC GmbH & Co KG
- 16.2.5.1. Overview
- 16.2.5.2. Products
- 16.2.5.3. SWOT Analysis
- 16.2.5.4. Recent Developments
- 16.2.5.5. Financials (Based on Availability)
- 16.2.6 PPG Industries Inc
- 16.2.6.1. Overview
- 16.2.6.2. Products
- 16.2.6.3. SWOT Analysis
- 16.2.6.4. Recent Developments
- 16.2.6.5. Financials (Based on Availability)
- 16.2.7 TOYOCHEM CO LTD
- 16.2.7.1. Overview
- 16.2.7.2. Products
- 16.2.7.3. SWOT Analysis
- 16.2.7.4. Recent Developments
- 16.2.7.5. Financials (Based on Availability)
- 16.2.8 VPL Coatings GmbH & Co KG*List Not Exhaustive
- 16.2.8.1. Overview
- 16.2.8.2. Products
- 16.2.8.3. SWOT Analysis
- 16.2.8.4. Recent Developments
- 16.2.8.5. Financials (Based on Availability)
- 16.2.9 Axalta Coating Systems
- 16.2.9.1. Overview
- 16.2.9.2. Products
- 16.2.9.3. SWOT Analysis
- 16.2.9.4. Recent Developments
- 16.2.9.5. Financials (Based on Availability)
- 16.2.10 Akzo Nobel N V
- 16.2.10.1. Overview
- 16.2.10.2. Products
- 16.2.10.3. SWOT Analysis
- 16.2.10.4. Recent Developments
- 16.2.10.5. Financials (Based on Availability)
- 16.2.11 National Paints Factories Co Ltd
- 16.2.11.1. Overview
- 16.2.11.2. Products
- 16.2.11.3. SWOT Analysis
- 16.2.11.4. Recent Developments
- 16.2.11.5. Financials (Based on Availability)
- 16.2.12 Kupsa Coatings
- 16.2.12.1. Overview
- 16.2.12.2. Products
- 16.2.12.3. SWOT Analysis
- 16.2.12.4. Recent Developments
- 16.2.12.5. Financials (Based on Availability)
- 16.2.1 The Sherwin-Williams Company
List of Figures
- Figure 1: Global Can Coatings Market Revenue Breakdown (Million, %) by Region 2024 & 2032
- Figure 2: Global Can Coatings Market Volume Breakdown (liter per unit, %) by Region 2024 & 2032
- Figure 3: North America Can Coatings Market Revenue (Million), by Country 2024 & 2032
- Figure 4: North America Can Coatings Market Volume (liter per unit), by Country 2024 & 2032
- Figure 5: North America Can Coatings Market Revenue Share (%), by Country 2024 & 2032
- Figure 6: North America Can Coatings Market Volume Share (%), by Country 2024 & 2032
- Figure 7: Europe Can Coatings Market Revenue (Million), by Country 2024 & 2032
- Figure 8: Europe Can Coatings Market Volume (liter per unit), by Country 2024 & 2032
- Figure 9: Europe Can Coatings Market Revenue Share (%), by Country 2024 & 2032
- Figure 10: Europe Can Coatings Market Volume Share (%), by Country 2024 & 2032
- Figure 11: Asia Pacific Can Coatings Market Revenue (Million), by Country 2024 & 2032
- Figure 12: Asia Pacific Can Coatings Market Volume (liter per unit), by Country 2024 & 2032
- Figure 13: Asia Pacific Can Coatings Market Revenue Share (%), by Country 2024 & 2032
- Figure 14: Asia Pacific Can Coatings Market Volume Share (%), by Country 2024 & 2032
- Figure 15: South America Can Coatings Market Revenue (Million), by Country 2024 & 2032
- Figure 16: South America Can Coatings Market Volume (liter per unit), by Country 2024 & 2032
- Figure 17: South America Can Coatings Market Revenue Share (%), by Country 2024 & 2032
- Figure 18: South America Can Coatings Market Volume Share (%), by Country 2024 & 2032
- Figure 19: MEA Can Coatings Market Revenue (Million), by Country 2024 & 2032
- Figure 20: MEA Can Coatings Market Volume (liter per unit), by Country 2024 & 2032
- Figure 21: MEA Can Coatings Market Revenue Share (%), by Country 2024 & 2032
- Figure 22: MEA Can Coatings Market Volume Share (%), by Country 2024 & 2032
- Figure 23: Asia Pacific Can Coatings Market Revenue (Million), by Type 2024 & 2032
- Figure 24: Asia Pacific Can Coatings Market Volume (liter per unit), by Type 2024 & 2032
- Figure 25: Asia Pacific Can Coatings Market Revenue Share (%), by Type 2024 & 2032
- Figure 26: Asia Pacific Can Coatings Market Volume Share (%), by Type 2024 & 2032
- Figure 27: Asia Pacific Can Coatings Market Revenue (Million), by Application 2024 & 2032
- Figure 28: Asia Pacific Can Coatings Market Volume (liter per unit), by Application 2024 & 2032
- Figure 29: Asia Pacific Can Coatings Market Revenue Share (%), by Application 2024 & 2032
- Figure 30: Asia Pacific Can Coatings Market Volume Share (%), by Application 2024 & 2032
- Figure 31: Asia Pacific Can Coatings Market Revenue (Million), by Country 2024 & 2032
- Figure 32: Asia Pacific Can Coatings Market Volume (liter per unit), by Country 2024 & 2032
- Figure 33: Asia Pacific Can Coatings Market Revenue Share (%), by Country 2024 & 2032
- Figure 34: Asia Pacific Can Coatings Market Volume Share (%), by Country 2024 & 2032
- Figure 35: North America Can Coatings Market Revenue (Million), by Type 2024 & 2032
- Figure 36: North America Can Coatings Market Volume (liter per unit), by Type 2024 & 2032
- Figure 37: North America Can Coatings Market Revenue Share (%), by Type 2024 & 2032
- Figure 38: North America Can Coatings Market Volume Share (%), by Type 2024 & 2032
- Figure 39: North America Can Coatings Market Revenue (Million), by Application 2024 & 2032
- Figure 40: North America Can Coatings Market Volume (liter per unit), by Application 2024 & 2032
- Figure 41: North America Can Coatings Market Revenue Share (%), by Application 2024 & 2032
- Figure 42: North America Can Coatings Market Volume Share (%), by Application 2024 & 2032
- Figure 43: North America Can Coatings Market Revenue (Million), by Country 2024 & 2032
- Figure 44: North America Can Coatings Market Volume (liter per unit), by Country 2024 & 2032
- Figure 45: North America Can Coatings Market Revenue Share (%), by Country 2024 & 2032
- Figure 46: North America Can Coatings Market Volume Share (%), by Country 2024 & 2032
- Figure 47: Europe Can Coatings Market Revenue (Million), by Type 2024 & 2032
- Figure 48: Europe Can Coatings Market Volume (liter per unit), by Type 2024 & 2032
- Figure 49: Europe Can Coatings Market Revenue Share (%), by Type 2024 & 2032
- Figure 50: Europe Can Coatings Market Volume Share (%), by Type 2024 & 2032
- Figure 51: Europe Can Coatings Market Revenue (Million), by Application 2024 & 2032
- Figure 52: Europe Can Coatings Market Volume (liter per unit), by Application 2024 & 2032
- Figure 53: Europe Can Coatings Market Revenue Share (%), by Application 2024 & 2032
- Figure 54: Europe Can Coatings Market Volume Share (%), by Application 2024 & 2032
- Figure 55: Europe Can Coatings Market Revenue (Million), by Country 2024 & 2032
- Figure 56: Europe Can Coatings Market Volume (liter per unit), by Country 2024 & 2032
- Figure 57: Europe Can Coatings Market Revenue Share (%), by Country 2024 & 2032
- Figure 58: Europe Can Coatings Market Volume Share (%), by Country 2024 & 2032
- Figure 59: South America Can Coatings Market Revenue (Million), by Type 2024 & 2032
- Figure 60: South America Can Coatings Market Volume (liter per unit), by Type 2024 & 2032
- Figure 61: South America Can Coatings Market Revenue Share (%), by Type 2024 & 2032
- Figure 62: South America Can Coatings Market Volume Share (%), by Type 2024 & 2032
- Figure 63: South America Can Coatings Market Revenue (Million), by Application 2024 & 2032
- Figure 64: South America Can Coatings Market Volume (liter per unit), by Application 2024 & 2032
- Figure 65: South America Can Coatings Market Revenue Share (%), by Application 2024 & 2032
- Figure 66: South America Can Coatings Market Volume Share (%), by Application 2024 & 2032
- Figure 67: South America Can Coatings Market Revenue (Million), by Country 2024 & 2032
- Figure 68: South America Can Coatings Market Volume (liter per unit), by Country 2024 & 2032
- Figure 69: South America Can Coatings Market Revenue Share (%), by Country 2024 & 2032
- Figure 70: South America Can Coatings Market Volume Share (%), by Country 2024 & 2032
- Figure 71: Middle East and Africa Can Coatings Market Revenue (Million), by Type 2024 & 2032
- Figure 72: Middle East and Africa Can Coatings Market Volume (liter per unit), by Type 2024 & 2032
- Figure 73: Middle East and Africa Can Coatings Market Revenue Share (%), by Type 2024 & 2032
- Figure 74: Middle East and Africa Can Coatings Market Volume Share (%), by Type 2024 & 2032
- Figure 75: Middle East and Africa Can Coatings Market Revenue (Million), by Application 2024 & 2032
- Figure 76: Middle East and Africa Can Coatings Market Volume (liter per unit), by Application 2024 & 2032
- Figure 77: Middle East and Africa Can Coatings Market Revenue Share (%), by Application 2024 & 2032
- Figure 78: Middle East and Africa Can Coatings Market Volume Share (%), by Application 2024 & 2032
- Figure 79: Middle East and Africa Can Coatings Market Revenue (Million), by Country 2024 & 2032
- Figure 80: Middle East and Africa Can Coatings Market Volume (liter per unit), by Country 2024 & 2032
- Figure 81: Middle East and Africa Can Coatings Market Revenue Share (%), by Country 2024 & 2032
- Figure 82: Middle East and Africa Can Coatings Market Volume Share (%), by Country 2024 & 2032
List of Tables
- Table 1: Global Can Coatings Market Revenue Million Forecast, by Region 2019 & 2032
- Table 2: Global Can Coatings Market Volume liter per unit Forecast, by Region 2019 & 2032
- Table 3: Global Can Coatings Market Revenue Million Forecast, by Type 2019 & 2032
- Table 4: Global Can Coatings Market Volume liter per unit Forecast, by Type 2019 & 2032
- Table 5: Global Can Coatings Market Revenue Million Forecast, by Application 2019 & 2032
- Table 6: Global Can Coatings Market Volume liter per unit Forecast, by Application 2019 & 2032
- Table 7: Global Can Coatings Market Revenue Million Forecast, by Region 2019 & 2032
- Table 8: Global Can Coatings Market Volume liter per unit Forecast, by Region 2019 & 2032
- Table 9: Global Can Coatings Market Revenue Million Forecast, by Country 2019 & 2032
- Table 10: Global Can Coatings Market Volume liter per unit Forecast, by Country 2019 & 2032
- Table 11: United States Can Coatings Market Revenue (Million) Forecast, by Application 2019 & 2032
- Table 12: United States Can Coatings Market Volume (liter per unit) Forecast, by Application 2019 & 2032
- Table 13: Canada Can Coatings Market Revenue (Million) Forecast, by Application 2019 & 2032
- Table 14: Canada Can Coatings Market Volume (liter per unit) Forecast, by Application 2019 & 2032
- Table 15: Mexico Can Coatings Market Revenue (Million) Forecast, by Application 2019 & 2032
- Table 16: Mexico Can Coatings Market Volume (liter per unit) Forecast, by Application 2019 & 2032
- Table 17: Global Can Coatings Market Revenue Million Forecast, by Country 2019 & 2032
- Table 18: Global Can Coatings Market Volume liter per unit Forecast, by Country 2019 & 2032
- Table 19: Germany Can Coatings Market Revenue (Million) Forecast, by Application 2019 & 2032
- Table 20: Germany Can Coatings Market Volume (liter per unit) Forecast, by Application 2019 & 2032
- Table 21: United Kingdom Can Coatings Market Revenue (Million) Forecast, by Application 2019 & 2032
- Table 22: United Kingdom Can Coatings Market Volume (liter per unit) Forecast, by Application 2019 & 2032
- Table 23: France Can Coatings Market Revenue (Million) Forecast, by Application 2019 & 2032
- Table 24: France Can Coatings Market Volume (liter per unit) Forecast, by Application 2019 & 2032
- Table 25: Spain Can Coatings Market Revenue (Million) Forecast, by Application 2019 & 2032
- Table 26: Spain Can Coatings Market Volume (liter per unit) Forecast, by Application 2019 & 2032
- Table 27: Italy Can Coatings Market Revenue (Million) Forecast, by Application 2019 & 2032
- Table 28: Italy Can Coatings Market Volume (liter per unit) Forecast, by Application 2019 & 2032
- Table 29: Spain Can Coatings Market Revenue (Million) Forecast, by Application 2019 & 2032
- Table 30: Spain Can Coatings Market Volume (liter per unit) Forecast, by Application 2019 & 2032
- Table 31: Belgium Can Coatings Market Revenue (Million) Forecast, by Application 2019 & 2032
- Table 32: Belgium Can Coatings Market Volume (liter per unit) Forecast, by Application 2019 & 2032
- Table 33: Netherland Can Coatings Market Revenue (Million) Forecast, by Application 2019 & 2032
- Table 34: Netherland Can Coatings Market Volume (liter per unit) Forecast, by Application 2019 & 2032
- Table 35: Nordics Can Coatings Market Revenue (Million) Forecast, by Application 2019 & 2032
- Table 36: Nordics Can Coatings Market Volume (liter per unit) Forecast, by Application 2019 & 2032
- Table 37: Rest of Europe Can Coatings Market Revenue (Million) Forecast, by Application 2019 & 2032
- Table 38: Rest of Europe Can Coatings Market Volume (liter per unit) Forecast, by Application 2019 & 2032
- Table 39: Global Can Coatings Market Revenue Million Forecast, by Country 2019 & 2032
- Table 40: Global Can Coatings Market Volume liter per unit Forecast, by Country 2019 & 2032
- Table 41: China Can Coatings Market Revenue (Million) Forecast, by Application 2019 & 2032
- Table 42: China Can Coatings Market Volume (liter per unit) Forecast, by Application 2019 & 2032
- Table 43: Japan Can Coatings Market Revenue (Million) Forecast, by Application 2019 & 2032
- Table 44: Japan Can Coatings Market Volume (liter per unit) Forecast, by Application 2019 & 2032
- Table 45: India Can Coatings Market Revenue (Million) Forecast, by Application 2019 & 2032
- Table 46: India Can Coatings Market Volume (liter per unit) Forecast, by Application 2019 & 2032
- Table 47: South Korea Can Coatings Market Revenue (Million) Forecast, by Application 2019 & 2032
- Table 48: South Korea Can Coatings Market Volume (liter per unit) Forecast, by Application 2019 & 2032
- Table 49: Southeast Asia Can Coatings Market Revenue (Million) Forecast, by Application 2019 & 2032
- Table 50: Southeast Asia Can Coatings Market Volume (liter per unit) Forecast, by Application 2019 & 2032
- Table 51: Australia Can Coatings Market Revenue (Million) Forecast, by Application 2019 & 2032
- Table 52: Australia Can Coatings Market Volume (liter per unit) Forecast, by Application 2019 & 2032
- Table 53: Indonesia Can Coatings Market Revenue (Million) Forecast, by Application 2019 & 2032
- Table 54: Indonesia Can Coatings Market Volume (liter per unit) Forecast, by Application 2019 & 2032
- Table 55: Phillipes Can Coatings Market Revenue (Million) Forecast, by Application 2019 & 2032
- Table 56: Phillipes Can Coatings Market Volume (liter per unit) Forecast, by Application 2019 & 2032
- Table 57: Singapore Can Coatings Market Revenue (Million) Forecast, by Application 2019 & 2032
- Table 58: Singapore Can Coatings Market Volume (liter per unit) Forecast, by Application 2019 & 2032
- Table 59: Thailandc Can Coatings Market Revenue (Million) Forecast, by Application 2019 & 2032
- Table 60: Thailandc Can Coatings Market Volume (liter per unit) Forecast, by Application 2019 & 2032
- Table 61: Rest of Asia Pacific Can Coatings Market Revenue (Million) Forecast, by Application 2019 & 2032
- Table 62: Rest of Asia Pacific Can Coatings Market Volume (liter per unit) Forecast, by Application 2019 & 2032
- Table 63: Global Can Coatings Market Revenue Million Forecast, by Country 2019 & 2032
- Table 64: Global Can Coatings Market Volume liter per unit Forecast, by Country 2019 & 2032
- Table 65: Brazil Can Coatings Market Revenue (Million) Forecast, by Application 2019 & 2032
- Table 66: Brazil Can Coatings Market Volume (liter per unit) Forecast, by Application 2019 & 2032
- Table 67: Argentina Can Coatings Market Revenue (Million) Forecast, by Application 2019 & 2032
- Table 68: Argentina Can Coatings Market Volume (liter per unit) Forecast, by Application 2019 & 2032
- Table 69: Peru Can Coatings Market Revenue (Million) Forecast, by Application 2019 & 2032
- Table 70: Peru Can Coatings Market Volume (liter per unit) Forecast, by Application 2019 & 2032
- Table 71: Chile Can Coatings Market Revenue (Million) Forecast, by Application 2019 & 2032
- Table 72: Chile Can Coatings Market Volume (liter per unit) Forecast, by Application 2019 & 2032
- Table 73: Colombia Can Coatings Market Revenue (Million) Forecast, by Application 2019 & 2032
- Table 74: Colombia Can Coatings Market Volume (liter per unit) Forecast, by Application 2019 & 2032
- Table 75: Ecuador Can Coatings Market Revenue (Million) Forecast, by Application 2019 & 2032
- Table 76: Ecuador Can Coatings Market Volume (liter per unit) Forecast, by Application 2019 & 2032
- Table 77: Venezuela Can Coatings Market Revenue (Million) Forecast, by Application 2019 & 2032
- Table 78: Venezuela Can Coatings Market Volume (liter per unit) Forecast, by Application 2019 & 2032
- Table 79: Rest of South America Can Coatings Market Revenue (Million) Forecast, by Application 2019 & 2032
- Table 80: Rest of South America Can Coatings Market Volume (liter per unit) Forecast, by Application 2019 & 2032
- Table 81: Global Can Coatings Market Revenue Million Forecast, by Country 2019 & 2032
- Table 82: Global Can Coatings Market Volume liter per unit Forecast, by Country 2019 & 2032
- Table 83: United Arab Emirates Can Coatings Market Revenue (Million) Forecast, by Application 2019 & 2032
- Table 84: United Arab Emirates Can Coatings Market Volume (liter per unit) Forecast, by Application 2019 & 2032
- Table 85: Saudi Arabia Can Coatings Market Revenue (Million) Forecast, by Application 2019 & 2032
- Table 86: Saudi Arabia Can Coatings Market Volume (liter per unit) Forecast, by Application 2019 & 2032
- Table 87: South Africa Can Coatings Market Revenue (Million) Forecast, by Application 2019 & 2032
- Table 88: South Africa Can Coatings Market Volume (liter per unit) Forecast, by Application 2019 & 2032
- Table 89: Rest of Middle East and Africa Can Coatings Market Revenue (Million) Forecast, by Application 2019 & 2032
- Table 90: Rest of Middle East and Africa Can Coatings Market Volume (liter per unit) Forecast, by Application 2019 & 2032
- Table 91: Global Can Coatings Market Revenue Million Forecast, by Type 2019 & 2032
- Table 92: Global Can Coatings Market Volume liter per unit Forecast, by Type 2019 & 2032
- Table 93: Global Can Coatings Market Revenue Million Forecast, by Application 2019 & 2032
- Table 94: Global Can Coatings Market Volume liter per unit Forecast, by Application 2019 & 2032
- Table 95: Global Can Coatings Market Revenue Million Forecast, by Country 2019 & 2032
- Table 96: Global Can Coatings Market Volume liter per unit Forecast, by Country 2019 & 2032
- Table 97: China Can Coatings Market Revenue (Million) Forecast, by Application 2019 & 2032
- Table 98: China Can Coatings Market Volume (liter per unit) Forecast, by Application 2019 & 2032
- Table 99: India Can Coatings Market Revenue (Million) Forecast, by Application 2019 & 2032
- Table 100: India Can Coatings Market Volume (liter per unit) Forecast, by Application 2019 & 2032
- Table 101: Japan Can Coatings Market Revenue (Million) Forecast, by Application 2019 & 2032
- Table 102: Japan Can Coatings Market Volume (liter per unit) Forecast, by Application 2019 & 2032
- Table 103: South Korea Can Coatings Market Revenue (Million) Forecast, by Application 2019 & 2032
- Table 104: South Korea Can Coatings Market Volume (liter per unit) Forecast, by Application 2019 & 2032
- Table 105: Indonesia Can Coatings Market Revenue (Million) Forecast, by Application 2019 & 2032
- Table 106: Indonesia Can Coatings Market Volume (liter per unit) Forecast, by Application 2019 & 2032
- Table 107: Malaysia Can Coatings Market Revenue (Million) Forecast, by Application 2019 & 2032
- Table 108: Malaysia Can Coatings Market Volume (liter per unit) Forecast, by Application 2019 & 2032
- Table 109: Thailand Can Coatings Market Revenue (Million) Forecast, by Application 2019 & 2032
- Table 110: Thailand Can Coatings Market Volume (liter per unit) Forecast, by Application 2019 & 2032
- Table 111: Vietnam Can Coatings Market Revenue (Million) Forecast, by Application 2019 & 2032
- Table 112: Vietnam Can Coatings Market Volume (liter per unit) Forecast, by Application 2019 & 2032
- Table 113: Rest of Asia Pacific Can Coatings Market Revenue (Million) Forecast, by Application 2019 & 2032
- Table 114: Rest of Asia Pacific Can Coatings Market Volume (liter per unit) Forecast, by Application 2019 & 2032
- Table 115: Global Can Coatings Market Revenue Million Forecast, by Type 2019 & 2032
- Table 116: Global Can Coatings Market Volume liter per unit Forecast, by Type 2019 & 2032
- Table 117: Global Can Coatings Market Revenue Million Forecast, by Application 2019 & 2032
- Table 118: Global Can Coatings Market Volume liter per unit Forecast, by Application 2019 & 2032
- Table 119: Global Can Coatings Market Revenue Million Forecast, by Country 2019 & 2032
- Table 120: Global Can Coatings Market Volume liter per unit Forecast, by Country 2019 & 2032
- Table 121: United States Can Coatings Market Revenue (Million) Forecast, by Application 2019 & 2032
- Table 122: United States Can Coatings Market Volume (liter per unit) Forecast, by Application 2019 & 2032
- Table 123: Canada Can Coatings Market Revenue (Million) Forecast, by Application 2019 & 2032
- Table 124: Canada Can Coatings Market Volume (liter per unit) Forecast, by Application 2019 & 2032
- Table 125: Mexico Can Coatings Market Revenue (Million) Forecast, by Application 2019 & 2032
- Table 126: Mexico Can Coatings Market Volume (liter per unit) Forecast, by Application 2019 & 2032
- Table 127: Global Can Coatings Market Revenue Million Forecast, by Type 2019 & 2032
- Table 128: Global Can Coatings Market Volume liter per unit Forecast, by Type 2019 & 2032
- Table 129: Global Can Coatings Market Revenue Million Forecast, by Application 2019 & 2032
- Table 130: Global Can Coatings Market Volume liter per unit Forecast, by Application 2019 & 2032
- Table 131: Global Can Coatings Market Revenue Million Forecast, by Country 2019 & 2032
- Table 132: Global Can Coatings Market Volume liter per unit Forecast, by Country 2019 & 2032
- Table 133: Germany Can Coatings Market Revenue (Million) Forecast, by Application 2019 & 2032
- Table 134: Germany Can Coatings Market Volume (liter per unit) Forecast, by Application 2019 & 2032
- Table 135: United Kingdom Can Coatings Market Revenue (Million) Forecast, by Application 2019 & 2032
- Table 136: United Kingdom Can Coatings Market Volume (liter per unit) Forecast, by Application 2019 & 2032
- Table 137: France Can Coatings Market Revenue (Million) Forecast, by Application 2019 & 2032
- Table 138: France Can Coatings Market Volume (liter per unit) Forecast, by Application 2019 & 2032
- Table 139: Italy Can Coatings Market Revenue (Million) Forecast, by Application 2019 & 2032
- Table 140: Italy Can Coatings Market Volume (liter per unit) Forecast, by Application 2019 & 2032
- Table 141: Spain Can Coatings Market Revenue (Million) Forecast, by Application 2019 & 2032
- Table 142: Spain Can Coatings Market Volume (liter per unit) Forecast, by Application 2019 & 2032
- Table 143: Russia Can Coatings Market Revenue (Million) Forecast, by Application 2019 & 2032
- Table 144: Russia Can Coatings Market Volume (liter per unit) Forecast, by Application 2019 & 2032
- Table 145: Turkey Can Coatings Market Revenue (Million) Forecast, by Application 2019 & 2032
- Table 146: Turkey Can Coatings Market Volume (liter per unit) Forecast, by Application 2019 & 2032
- Table 147: NORDIC Countries Can Coatings Market Revenue (Million) Forecast, by Application 2019 & 2032
- Table 148: NORDIC Countries Can Coatings Market Volume (liter per unit) Forecast, by Application 2019 & 2032
- Table 149: Rest of Europe Can Coatings Market Revenue (Million) Forecast, by Application 2019 & 2032
- Table 150: Rest of Europe Can Coatings Market Volume (liter per unit) Forecast, by Application 2019 & 2032
- Table 151: Global Can Coatings Market Revenue Million Forecast, by Type 2019 & 2032
- Table 152: Global Can Coatings Market Volume liter per unit Forecast, by Type 2019 & 2032
- Table 153: Global Can Coatings Market Revenue Million Forecast, by Application 2019 & 2032
- Table 154: Global Can Coatings Market Volume liter per unit Forecast, by Application 2019 & 2032
- Table 155: Global Can Coatings Market Revenue Million Forecast, by Country 2019 & 2032
- Table 156: Global Can Coatings Market Volume liter per unit Forecast, by Country 2019 & 2032
- Table 157: Brazil Can Coatings Market Revenue (Million) Forecast, by Application 2019 & 2032
- Table 158: Brazil Can Coatings Market Volume (liter per unit) Forecast, by Application 2019 & 2032
- Table 159: Argentina Can Coatings Market Revenue (Million) Forecast, by Application 2019 & 2032
- Table 160: Argentina Can Coatings Market Volume (liter per unit) Forecast, by Application 2019 & 2032
- Table 161: Colombia Can Coatings Market Revenue (Million) Forecast, by Application 2019 & 2032
- Table 162: Colombia Can Coatings Market Volume (liter per unit) Forecast, by Application 2019 & 2032
- Table 163: Rest of South America Can Coatings Market Revenue (Million) Forecast, by Application 2019 & 2032
- Table 164: Rest of South America Can Coatings Market Volume (liter per unit) Forecast, by Application 2019 & 2032
- Table 165: Global Can Coatings Market Revenue Million Forecast, by Type 2019 & 2032
- Table 166: Global Can Coatings Market Volume liter per unit Forecast, by Type 2019 & 2032
- Table 167: Global Can Coatings Market Revenue Million Forecast, by Application 2019 & 2032
- Table 168: Global Can Coatings Market Volume liter per unit Forecast, by Application 2019 & 2032
- Table 169: Global Can Coatings Market Revenue Million Forecast, by Country 2019 & 2032
- Table 170: Global Can Coatings Market Volume liter per unit Forecast, by Country 2019 & 2032
- Table 171: Saudi Arabia Can Coatings Market Revenue (Million) Forecast, by Application 2019 & 2032
- Table 172: Saudi Arabia Can Coatings Market Volume (liter per unit) Forecast, by Application 2019 & 2032
- Table 173: South Africa Can Coatings Market Revenue (Million) Forecast, by Application 2019 & 2032
- Table 174: South Africa Can Coatings Market Volume (liter per unit) Forecast, by Application 2019 & 2032
- Table 175: Qatar Can Coatings Market Revenue (Million) Forecast, by Application 2019 & 2032
- Table 176: Qatar Can Coatings Market Volume (liter per unit) Forecast, by Application 2019 & 2032
- Table 177: UAE Can Coatings Market Revenue (Million) Forecast, by Application 2019 & 2032
- Table 178: UAE Can Coatings Market Volume (liter per unit) Forecast, by Application 2019 & 2032
- Table 179: Egypt Can Coatings Market Revenue (Million) Forecast, by Application 2019 & 2032
- Table 180: Egypt Can Coatings Market Volume (liter per unit) Forecast, by Application 2019 & 2032
- Table 181: Algeria Can Coatings Market Revenue (Million) Forecast, by Application 2019 & 2032
- Table 182: Algeria Can Coatings Market Volume (liter per unit) Forecast, by Application 2019 & 2032
- Table 183: Rest of Middle East and Africa Can Coatings Market Revenue (Million) Forecast, by Application 2019 & 2032
- Table 184: Rest of Middle East and Africa Can Coatings Market Volume (liter per unit) Forecast, by Application 2019 & 2032
Frequently Asked Questions
1. What is the projected Compound Annual Growth Rate (CAGR) of the Can Coatings Market?
The projected CAGR is approximately > 4.50%.
2. Which companies are prominent players in the Can Coatings Market?
Key companies in the market include The Sherwin-Williams Company, TIGER Coatings GmbH & Co KG, RPM International Inc, Kansai Paint Co Ltd, IPC GmbH & Co KG, PPG Industries Inc, TOYOCHEM CO LTD, VPL Coatings GmbH & Co KG*List Not Exhaustive, Axalta Coating Systems, Akzo Nobel N V, National Paints Factories Co Ltd, Kupsa Coatings.
3. What are the main segments of the Can Coatings Market?
The market segments include Type, Application.
4. Can you provide details about the market size?
The market size is estimated to be USD 5.52 Million as of 2022.
5. What are some drivers contributing to market growth?
Increasing Demand from Food and Beverage Packaging; Growing Utilization of Aerosol Cans for Personal Care Industry.
6. What are the notable trends driving market growth?
Beverage Cans to Dominate the market.
7. Are there any restraints impacting market growth?
Stringent VOC Regulatory Policies; Other Restraints.
8. Can you provide examples of recent developments in the market?
November 2023: AkzoNobel will invest EUR 32 million (~USD 34.99 million) in a new factory at its Vilafranca site to manufacture bisphenol-free coatings for the metal packaging industry in EMEA (Europe, Middle East, and Africa). The facility will use advanced automation and has been designed to meet high eco-efficiency requirements, allowing the company to achieve significant improvements in energy and material economy. It is projected to be operational by the middle of 2025.
9. What pricing options are available for accessing the report?
Pricing options include single-user, multi-user, and enterprise licenses priced at USD 4750, USD 5250, and USD 8750 respectively.
10. Is the market size provided in terms of value or volume?
The market size is provided in terms of value, measured in Million and volume, measured in liter per unit.
11. Are there any specific market keywords associated with the report?
Yes, the market keyword associated with the report is "Can Coatings Market," which aids in identifying and referencing the specific market segment covered.
12. How do I determine which pricing option suits my needs best?
The pricing options vary based on user requirements and access needs. Individual users may opt for single-user licenses, while businesses requiring broader access may choose multi-user or enterprise licenses for cost-effective access to the report.
13. Are there any additional resources or data provided in the Can Coatings Market report?
While the report offers comprehensive insights, it's advisable to review the specific contents or supplementary materials provided to ascertain if additional resources or data are available.
14. How can I stay updated on further developments or reports in the Can Coatings Market?
To stay informed about further developments, trends, and reports in the Can Coatings Market, consider subscribing to industry newsletters, following relevant companies and organizations, or regularly checking reputable industry news sources and publications.
Methodology
Step 1 - Identification of Relevant Samples Size from Population Database


Step 2 - Approaches for Defining Global Market Size (Value, Volume* & Price*)

Note*: In applicable scenarios
Step 3 - Data Sources
Primary Research
- Web Analytics
- Survey Reports
- Research Institute
- Latest Research Reports
- Opinion Leaders
Secondary Research
- Annual Reports
- White Paper
- Latest Press Release
- Industry Association
- Paid Database
- Investor Presentations

Step 4 - Data Triangulation
Involves using different sources of information in order to increase the validity of a study
These sources are likely to be stakeholders in a program - participants, other researchers, program staff, other community members, and so on.
Then we put all data in single framework & apply various statistical tools to find out the dynamic on the market.
During the analysis stage, feedback from the stakeholder groups would be compared to determine areas of agreement as well as areas of divergence
