

Key Insights
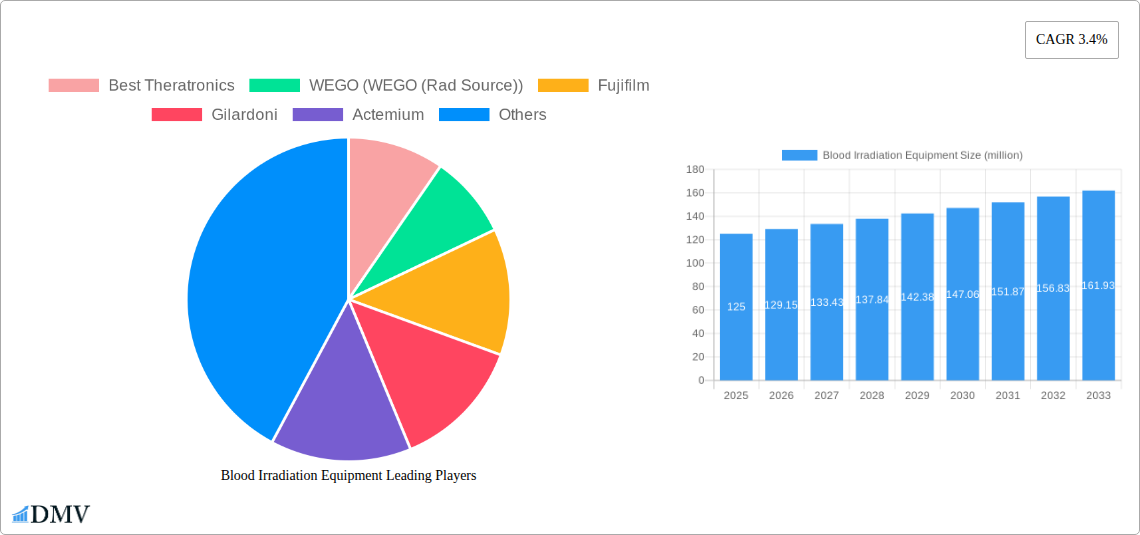
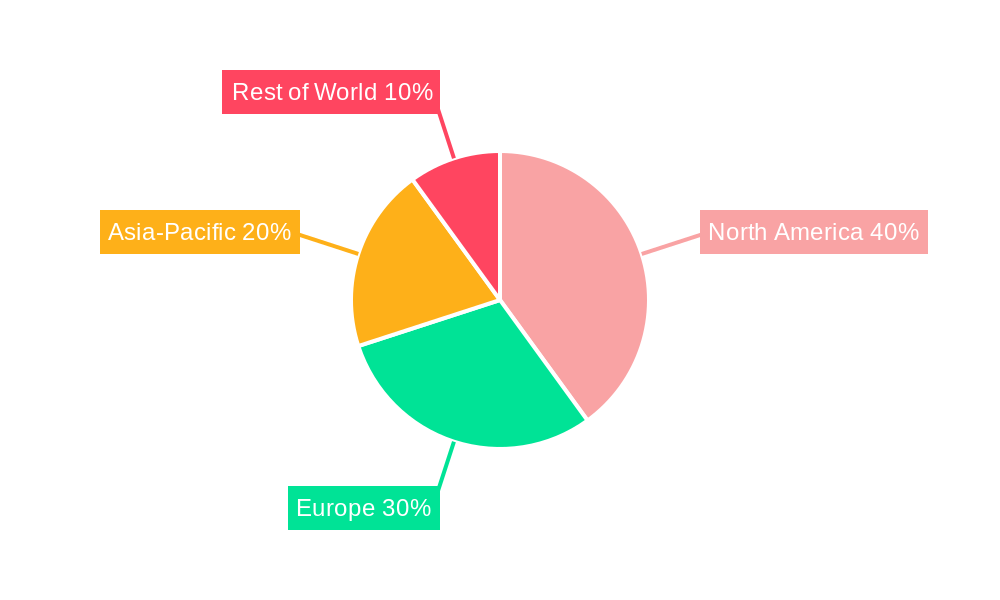
The global blood irradiation equipment market, valued at $125 million in 2025, is projected to experience steady growth, driven by increasing blood transfusion procedures globally and a rising incidence of blood-borne diseases. This necessitates the use of irradiation equipment to ensure blood safety and reduce the risk of transfusion-transmitted infections. Technological advancements in irradiation techniques, leading to more efficient and cost-effective equipment, further fuel market expansion. The demand is particularly strong in developed regions like North America and Europe, due to well-established healthcare infrastructure and stringent regulatory frameworks emphasizing blood safety. However, the high initial investment cost associated with procuring and maintaining blood irradiation equipment, coupled with the need for skilled personnel to operate these systems, could pose challenges to market growth, especially in developing economies. The market is characterized by a moderate level of competition among key players, including Best Theratronics, WEGO (Rad Source), Fujifilm, Gilardoni, and others, each striving to innovate and capture market share.
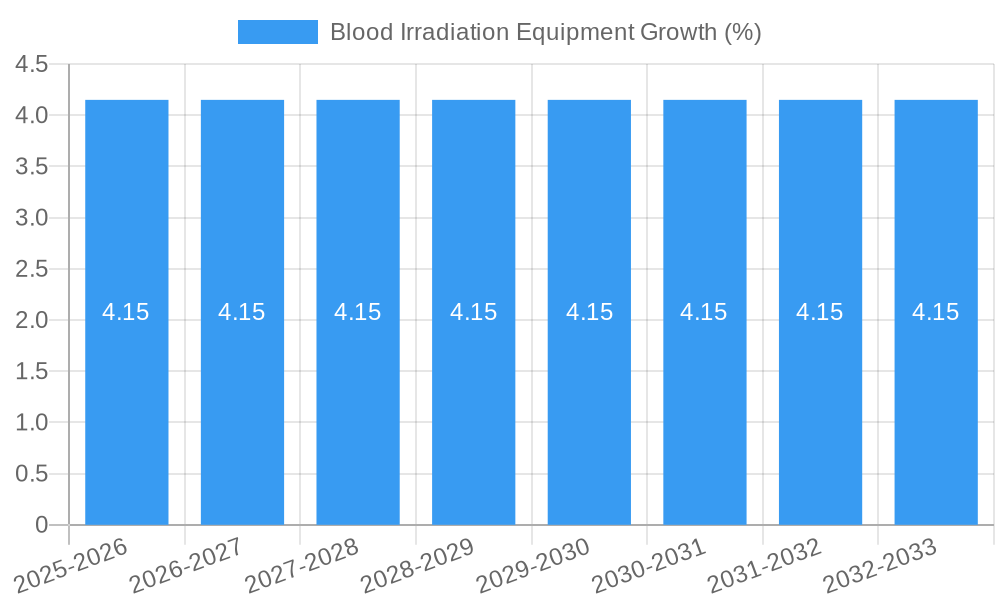
The forecast period of 2025-2033 anticipates a continued expansion, with the 3.4% CAGR indicating a stable, albeit not explosive, growth trajectory. This growth will likely be fueled by an increase in the adoption of blood irradiation in emerging markets as healthcare infrastructure improves and awareness regarding blood safety increases. However, maintaining this growth will require manufacturers to focus on developing user-friendly, cost-effective equipment and providing comprehensive training and support to healthcare professionals. Furthermore, ongoing research and development efforts in improving irradiation techniques, such as reducing irradiation time and improving efficiency, will be critical for sustained market growth and to address potential future market restraints.
Blood Irradiation Equipment Market Report: 2019-2033
This comprehensive report provides an in-depth analysis of the global Blood Irradiation Equipment market, projecting a market value exceeding $xx million by 2033. The study period spans 2019-2033, with 2025 serving as both the base and estimated year. This report is invaluable for stakeholders seeking to understand market dynamics, technological advancements, and future growth opportunities within this critical sector. The report leverages rigorous research methodologies and data analysis to deliver actionable insights, equipping businesses with the knowledge needed to make informed strategic decisions.
Blood Irradiation Equipment Market Composition & Trends
This section delves into the intricate composition of the Blood Irradiation Equipment market, analyzing key trends that shape its trajectory. We evaluate market concentration, revealing the market share distribution among key players like Best Theratronics, WEGO (Rad Source), Fujifilm, Gilardoni, Actemium, Eckert & Ziegler, Shinva Medical, NPIC, and LIVZON. The report quantifies the market's concentration level, using metrics such as the Herfindahl-Hirschman Index (HHI) to assess competitiveness. Innovation is a cornerstone of this market, with continuous advancements in irradiation technology driving market expansion. The regulatory landscape, including variations in approvals and certifications across different geographies, significantly influences market access and growth. The report analyzes these regulatory factors, considering their impact on market entry and expansion strategies. Furthermore, we explore substitute products and their potential impact on market share, considering both existing and emerging alternatives. The end-user landscape is examined, segmenting the market by application (e.g., blood banks, hospitals) and analyzing their specific needs and purchasing patterns. Finally, the report details M&A activities within the sector, including the value of significant deals and their strategic implications, providing insights into market consolidation and competitive landscape shifts. The report estimates the total value of M&A deals in the blood irradiation equipment market to be over $xx million during the historical period.
- Market Share Distribution: Best Theratronics (xx%), WEGO (Rad Source) (xx%), Fujifilm (xx%), Others (xx%)
- M&A Deal Value (2019-2024): $xx million
- Average Deal Size: $xx million
Blood Irradiation Equipment Industry Evolution
This section meticulously charts the evolution of the blood irradiation equipment industry from 2019 to 2033. We analyze market growth trajectories, identifying periods of accelerated expansion and potential plateaus, with detailed growth rates provided for each segment. Technological advancements are a central focus, tracing the development of key innovations and their impact on market dynamics, such as the adoption of improved radiation sources and automation. The report also explores shifting consumer demands, considering the influence of factors like cost-effectiveness, efficiency, and safety requirements on market preferences. We quantify the adoption rate of new technologies, highlighting specific examples, like the transition from older Cobalt-60 based systems to newer X-ray based systems. This analysis includes projections for future technology adoption rates and their influence on overall market growth. The report projects a compound annual growth rate (CAGR) of xx% during the forecast period (2025-2033).
Leading Regions, Countries, or Segments in Blood Irradiation Equipment
This section pinpoints the leading regions, countries, or segments within the blood irradiation equipment market. The report identifies the dominant market based on factors like adoption rates, regulatory landscape, and market size.
- Key Drivers for the Dominant Region/Segment:
- High levels of healthcare spending
- Stringent regulatory frameworks emphasizing blood safety
- Significant investments in healthcare infrastructure
- Growing prevalence of blood-borne diseases
- Favorable government initiatives supporting healthcare technology adoption
The dominance of the leading region is analyzed through a detailed examination of its unique characteristics that facilitate market growth. These include the presence of major industry players, robust research and development capabilities, and strong regulatory support. This is contrasted with other regions to highlight the specific factors driving disparity in market penetration and growth rates.
Blood Irradiation Equipment Product Innovations
Recent innovations in blood irradiation equipment have focused on improving efficiency, safety, and ease of use. This includes advancements in radiation sources (e.g., X-ray technology offering improved dose uniformity and reduced operational costs compared to Cobalt-60) and automation features that streamline the irradiation process and reduce human error. These innovations have resulted in equipment with improved performance metrics, including faster processing times, reduced radiation exposure, and higher throughput capacities. Unique selling propositions for these advanced systems include features like remote monitoring capabilities and enhanced safety protocols, catering to the growing demand for advanced and user-friendly technologies.
Propelling Factors for Blood Irradiation Equipment Growth
Several factors are driving the growth of the blood irradiation equipment market. Technological advancements, such as the development of more efficient and safer irradiation systems, are a key catalyst. The increasing prevalence of blood-borne diseases necessitates more robust blood safety protocols, boosting demand. Furthermore, supportive government regulations and investments in healthcare infrastructure play a vital role in fostering market expansion. Economic factors, such as rising healthcare spending and insurance coverage, also positively impact market growth.
Obstacles in the Blood Irradiation Equipment Market
Despite the positive outlook, several obstacles impede market growth. Regulatory hurdles, such as stringent approval processes and varying certifications across regions, can delay market entry and expansion. Supply chain disruptions, particularly concerning the availability of critical components, can affect production and availability. Furthermore, intense competition among established players and the emergence of new entrants create a challenging market environment. The report estimates these challenges to reduce the market's potential growth by xx% annually.
Future Opportunities in Blood Irradiation Equipment
Emerging opportunities lie in expanding into new markets with developing healthcare infrastructure and unmet needs. The development of innovative technologies, such as advanced radiation sources and AI-powered systems, offers significant growth potential. Moreover, evolving consumer trends favoring improved safety and efficiency present opportunities for manufacturers to cater to specific market demands. Expansion into emerging economies and the development of cost-effective irradiation solutions present further lucrative opportunities.
Major Players in the Blood Irradiation Equipment Ecosystem
- Best Theratronics
- WEGO (Rad Source)
- Fujifilm
- Gilardoni
- Actemium
- Eckert & Ziegler
- Shinva Medical
- NPIC
- LIVZON
Key Developments in Blood Irradiation Equipment Industry
- 2022-Q4: Best Theratronics launched a new generation of blood irradiator.
- 2023-Q1: WEGO acquired a smaller competitor, expanding its market share.
- 2023-Q3: Fujifilm received regulatory approval for its new blood irradiation system in a major market.
- (Further developments to be added based on data analysis)
Strategic Blood Irradiation Equipment Market Forecast
The blood irradiation equipment market is poised for significant growth in the coming years, driven by technological advancements, increasing demand for blood safety, and supportive regulatory environments. The market is expected to continue its expansion, with strong growth prospects in both developed and emerging economies. The future trajectory hinges on successful innovation, adept navigation of regulatory landscapes, and the ability of manufacturers to adapt to evolving consumer preferences, leading to continued market expansion and the emergence of new technological advancements.
Blood Irradiation Equipment Segmentation
-
1. Application
- 1.1. Blood Bank
- 1.2. Hospitals
- 1.3. Research Institutions
-
2. Type
- 2.1. X-ray Blood Irradiation Equipment
- 2.2. Gamma-ray Blood Irradiation Equipment
Blood Irradiation Equipment Segmentation By Geography
-
1. North America
- 1.1. United States
- 1.2. Canada
- 1.3. Mexico
-
2. South America
- 2.1. Brazil
- 2.2. Argentina
- 2.3. Rest of South America
-
3. Europe
- 3.1. United Kingdom
- 3.2. Germany
- 3.3. France
- 3.4. Italy
- 3.5. Spain
- 3.6. Russia
- 3.7. Benelux
- 3.8. Nordics
- 3.9. Rest of Europe
-
4. Middle East & Africa
- 4.1. Turkey
- 4.2. Israel
- 4.3. GCC
- 4.4. North Africa
- 4.5. South Africa
- 4.6. Rest of Middle East & Africa
-
5. Asia Pacific
- 5.1. China
- 5.2. India
- 5.3. Japan
- 5.4. South Korea
- 5.5. ASEAN
- 5.6. Oceania
- 5.7. Rest of Asia Pacific
Blood Irradiation Equipment REPORT HIGHLIGHTS
| Aspects | Details |
|---|---|
| Study Period | 2019-2033 |
| Base Year | 2024 |
| Estimated Year | 2025 |
| Forecast Period | 2025-2033 |
| Historical Period | 2019-2024 |
| Growth Rate | CAGR of 3.4% from 2019-2033 |
| Segmentation |
|
Table of Contents
- 1. Introduction
- 1.1. Research Scope
- 1.2. Market Segmentation
- 1.3. Research Methodology
- 1.4. Definitions and Assumptions
- 2. Executive Summary
- 2.1. Introduction
- 3. Market Dynamics
- 3.1. Introduction
- 3.2. Market Drivers
- 3.3. Market Restrains
- 3.4. Market Trends
- 4. Market Factor Analysis
- 4.1. Porters Five Forces
- 4.2. Supply/Value Chain
- 4.3. PESTEL analysis
- 4.4. Market Entropy
- 4.5. Patent/Trademark Analysis
- 5. Global Blood Irradiation Equipment Analysis, Insights and Forecast, 2019-2031
- 5.1. Market Analysis, Insights and Forecast - by Application
- 5.1.1. Blood Bank
- 5.1.2. Hospitals
- 5.1.3. Research Institutions
- 5.2. Market Analysis, Insights and Forecast - by Type
- 5.2.1. X-ray Blood Irradiation Equipment
- 5.2.2. Gamma-ray Blood Irradiation Equipment
- 5.3. Market Analysis, Insights and Forecast - by Region
- 5.3.1. North America
- 5.3.2. South America
- 5.3.3. Europe
- 5.3.4. Middle East & Africa
- 5.3.5. Asia Pacific
- 5.1. Market Analysis, Insights and Forecast - by Application
- 6. North America Blood Irradiation Equipment Analysis, Insights and Forecast, 2019-2031
- 6.1. Market Analysis, Insights and Forecast - by Application
- 6.1.1. Blood Bank
- 6.1.2. Hospitals
- 6.1.3. Research Institutions
- 6.2. Market Analysis, Insights and Forecast - by Type
- 6.2.1. X-ray Blood Irradiation Equipment
- 6.2.2. Gamma-ray Blood Irradiation Equipment
- 6.1. Market Analysis, Insights and Forecast - by Application
- 7. South America Blood Irradiation Equipment Analysis, Insights and Forecast, 2019-2031
- 7.1. Market Analysis, Insights and Forecast - by Application
- 7.1.1. Blood Bank
- 7.1.2. Hospitals
- 7.1.3. Research Institutions
- 7.2. Market Analysis, Insights and Forecast - by Type
- 7.2.1. X-ray Blood Irradiation Equipment
- 7.2.2. Gamma-ray Blood Irradiation Equipment
- 7.1. Market Analysis, Insights and Forecast - by Application
- 8. Europe Blood Irradiation Equipment Analysis, Insights and Forecast, 2019-2031
- 8.1. Market Analysis, Insights and Forecast - by Application
- 8.1.1. Blood Bank
- 8.1.2. Hospitals
- 8.1.3. Research Institutions
- 8.2. Market Analysis, Insights and Forecast - by Type
- 8.2.1. X-ray Blood Irradiation Equipment
- 8.2.2. Gamma-ray Blood Irradiation Equipment
- 8.1. Market Analysis, Insights and Forecast - by Application
- 9. Middle East & Africa Blood Irradiation Equipment Analysis, Insights and Forecast, 2019-2031
- 9.1. Market Analysis, Insights and Forecast - by Application
- 9.1.1. Blood Bank
- 9.1.2. Hospitals
- 9.1.3. Research Institutions
- 9.2. Market Analysis, Insights and Forecast - by Type
- 9.2.1. X-ray Blood Irradiation Equipment
- 9.2.2. Gamma-ray Blood Irradiation Equipment
- 9.1. Market Analysis, Insights and Forecast - by Application
- 10. Asia Pacific Blood Irradiation Equipment Analysis, Insights and Forecast, 2019-2031
- 10.1. Market Analysis, Insights and Forecast - by Application
- 10.1.1. Blood Bank
- 10.1.2. Hospitals
- 10.1.3. Research Institutions
- 10.2. Market Analysis, Insights and Forecast - by Type
- 10.2.1. X-ray Blood Irradiation Equipment
- 10.2.2. Gamma-ray Blood Irradiation Equipment
- 10.1. Market Analysis, Insights and Forecast - by Application
- 11. Competitive Analysis
- 11.1. Global Market Share Analysis 2024
- 11.2. Company Profiles
- 11.2.1 Best Theratronics
- 11.2.1.1. Overview
- 11.2.1.2. Products
- 11.2.1.3. SWOT Analysis
- 11.2.1.4. Recent Developments
- 11.2.1.5. Financials (Based on Availability)
- 11.2.2 WEGO (WEGO (Rad Source))
- 11.2.2.1. Overview
- 11.2.2.2. Products
- 11.2.2.3. SWOT Analysis
- 11.2.2.4. Recent Developments
- 11.2.2.5. Financials (Based on Availability)
- 11.2.3 Fujifilm
- 11.2.3.1. Overview
- 11.2.3.2. Products
- 11.2.3.3. SWOT Analysis
- 11.2.3.4. Recent Developments
- 11.2.3.5. Financials (Based on Availability)
- 11.2.4 Gilardoni
- 11.2.4.1. Overview
- 11.2.4.2. Products
- 11.2.4.3. SWOT Analysis
- 11.2.4.4. Recent Developments
- 11.2.4.5. Financials (Based on Availability)
- 11.2.5 Actemium
- 11.2.5.1. Overview
- 11.2.5.2. Products
- 11.2.5.3. SWOT Analysis
- 11.2.5.4. Recent Developments
- 11.2.5.5. Financials (Based on Availability)
- 11.2.6 Eckert&Ziegler
- 11.2.6.1. Overview
- 11.2.6.2. Products
- 11.2.6.3. SWOT Analysis
- 11.2.6.4. Recent Developments
- 11.2.6.5. Financials (Based on Availability)
- 11.2.7 Shinva Medical
- 11.2.7.1. Overview
- 11.2.7.2. Products
- 11.2.7.3. SWOT Analysis
- 11.2.7.4. Recent Developments
- 11.2.7.5. Financials (Based on Availability)
- 11.2.8 NPIC
- 11.2.8.1. Overview
- 11.2.8.2. Products
- 11.2.8.3. SWOT Analysis
- 11.2.8.4. Recent Developments
- 11.2.8.5. Financials (Based on Availability)
- 11.2.9 LIVZON
- 11.2.9.1. Overview
- 11.2.9.2. Products
- 11.2.9.3. SWOT Analysis
- 11.2.9.4. Recent Developments
- 11.2.9.5. Financials (Based on Availability)
- 11.2.1 Best Theratronics
List of Figures
- Figure 1: Global Blood Irradiation Equipment Revenue Breakdown (million, %) by Region 2024 & 2032
- Figure 2: Global Blood Irradiation Equipment Volume Breakdown (K, %) by Region 2024 & 2032
- Figure 3: North America Blood Irradiation Equipment Revenue (million), by Application 2024 & 2032
- Figure 4: North America Blood Irradiation Equipment Volume (K), by Application 2024 & 2032
- Figure 5: North America Blood Irradiation Equipment Revenue Share (%), by Application 2024 & 2032
- Figure 6: North America Blood Irradiation Equipment Volume Share (%), by Application 2024 & 2032
- Figure 7: North America Blood Irradiation Equipment Revenue (million), by Type 2024 & 2032
- Figure 8: North America Blood Irradiation Equipment Volume (K), by Type 2024 & 2032
- Figure 9: North America Blood Irradiation Equipment Revenue Share (%), by Type 2024 & 2032
- Figure 10: North America Blood Irradiation Equipment Volume Share (%), by Type 2024 & 2032
- Figure 11: North America Blood Irradiation Equipment Revenue (million), by Country 2024 & 2032
- Figure 12: North America Blood Irradiation Equipment Volume (K), by Country 2024 & 2032
- Figure 13: North America Blood Irradiation Equipment Revenue Share (%), by Country 2024 & 2032
- Figure 14: North America Blood Irradiation Equipment Volume Share (%), by Country 2024 & 2032
- Figure 15: South America Blood Irradiation Equipment Revenue (million), by Application 2024 & 2032
- Figure 16: South America Blood Irradiation Equipment Volume (K), by Application 2024 & 2032
- Figure 17: South America Blood Irradiation Equipment Revenue Share (%), by Application 2024 & 2032
- Figure 18: South America Blood Irradiation Equipment Volume Share (%), by Application 2024 & 2032
- Figure 19: South America Blood Irradiation Equipment Revenue (million), by Type 2024 & 2032
- Figure 20: South America Blood Irradiation Equipment Volume (K), by Type 2024 & 2032
- Figure 21: South America Blood Irradiation Equipment Revenue Share (%), by Type 2024 & 2032
- Figure 22: South America Blood Irradiation Equipment Volume Share (%), by Type 2024 & 2032
- Figure 23: South America Blood Irradiation Equipment Revenue (million), by Country 2024 & 2032
- Figure 24: South America Blood Irradiation Equipment Volume (K), by Country 2024 & 2032
- Figure 25: South America Blood Irradiation Equipment Revenue Share (%), by Country 2024 & 2032
- Figure 26: South America Blood Irradiation Equipment Volume Share (%), by Country 2024 & 2032
- Figure 27: Europe Blood Irradiation Equipment Revenue (million), by Application 2024 & 2032
- Figure 28: Europe Blood Irradiation Equipment Volume (K), by Application 2024 & 2032
- Figure 29: Europe Blood Irradiation Equipment Revenue Share (%), by Application 2024 & 2032
- Figure 30: Europe Blood Irradiation Equipment Volume Share (%), by Application 2024 & 2032
- Figure 31: Europe Blood Irradiation Equipment Revenue (million), by Type 2024 & 2032
- Figure 32: Europe Blood Irradiation Equipment Volume (K), by Type 2024 & 2032
- Figure 33: Europe Blood Irradiation Equipment Revenue Share (%), by Type 2024 & 2032
- Figure 34: Europe Blood Irradiation Equipment Volume Share (%), by Type 2024 & 2032
- Figure 35: Europe Blood Irradiation Equipment Revenue (million), by Country 2024 & 2032
- Figure 36: Europe Blood Irradiation Equipment Volume (K), by Country 2024 & 2032
- Figure 37: Europe Blood Irradiation Equipment Revenue Share (%), by Country 2024 & 2032
- Figure 38: Europe Blood Irradiation Equipment Volume Share (%), by Country 2024 & 2032
- Figure 39: Middle East & Africa Blood Irradiation Equipment Revenue (million), by Application 2024 & 2032
- Figure 40: Middle East & Africa Blood Irradiation Equipment Volume (K), by Application 2024 & 2032
- Figure 41: Middle East & Africa Blood Irradiation Equipment Revenue Share (%), by Application 2024 & 2032
- Figure 42: Middle East & Africa Blood Irradiation Equipment Volume Share (%), by Application 2024 & 2032
- Figure 43: Middle East & Africa Blood Irradiation Equipment Revenue (million), by Type 2024 & 2032
- Figure 44: Middle East & Africa Blood Irradiation Equipment Volume (K), by Type 2024 & 2032
- Figure 45: Middle East & Africa Blood Irradiation Equipment Revenue Share (%), by Type 2024 & 2032
- Figure 46: Middle East & Africa Blood Irradiation Equipment Volume Share (%), by Type 2024 & 2032
- Figure 47: Middle East & Africa Blood Irradiation Equipment Revenue (million), by Country 2024 & 2032
- Figure 48: Middle East & Africa Blood Irradiation Equipment Volume (K), by Country 2024 & 2032
- Figure 49: Middle East & Africa Blood Irradiation Equipment Revenue Share (%), by Country 2024 & 2032
- Figure 50: Middle East & Africa Blood Irradiation Equipment Volume Share (%), by Country 2024 & 2032
- Figure 51: Asia Pacific Blood Irradiation Equipment Revenue (million), by Application 2024 & 2032
- Figure 52: Asia Pacific Blood Irradiation Equipment Volume (K), by Application 2024 & 2032
- Figure 53: Asia Pacific Blood Irradiation Equipment Revenue Share (%), by Application 2024 & 2032
- Figure 54: Asia Pacific Blood Irradiation Equipment Volume Share (%), by Application 2024 & 2032
- Figure 55: Asia Pacific Blood Irradiation Equipment Revenue (million), by Type 2024 & 2032
- Figure 56: Asia Pacific Blood Irradiation Equipment Volume (K), by Type 2024 & 2032
- Figure 57: Asia Pacific Blood Irradiation Equipment Revenue Share (%), by Type 2024 & 2032
- Figure 58: Asia Pacific Blood Irradiation Equipment Volume Share (%), by Type 2024 & 2032
- Figure 59: Asia Pacific Blood Irradiation Equipment Revenue (million), by Country 2024 & 2032
- Figure 60: Asia Pacific Blood Irradiation Equipment Volume (K), by Country 2024 & 2032
- Figure 61: Asia Pacific Blood Irradiation Equipment Revenue Share (%), by Country 2024 & 2032
- Figure 62: Asia Pacific Blood Irradiation Equipment Volume Share (%), by Country 2024 & 2032
List of Tables
- Table 1: Global Blood Irradiation Equipment Revenue million Forecast, by Region 2019 & 2032
- Table 2: Global Blood Irradiation Equipment Volume K Forecast, by Region 2019 & 2032
- Table 3: Global Blood Irradiation Equipment Revenue million Forecast, by Application 2019 & 2032
- Table 4: Global Blood Irradiation Equipment Volume K Forecast, by Application 2019 & 2032
- Table 5: Global Blood Irradiation Equipment Revenue million Forecast, by Type 2019 & 2032
- Table 6: Global Blood Irradiation Equipment Volume K Forecast, by Type 2019 & 2032
- Table 7: Global Blood Irradiation Equipment Revenue million Forecast, by Region 2019 & 2032
- Table 8: Global Blood Irradiation Equipment Volume K Forecast, by Region 2019 & 2032
- Table 9: Global Blood Irradiation Equipment Revenue million Forecast, by Application 2019 & 2032
- Table 10: Global Blood Irradiation Equipment Volume K Forecast, by Application 2019 & 2032
- Table 11: Global Blood Irradiation Equipment Revenue million Forecast, by Type 2019 & 2032
- Table 12: Global Blood Irradiation Equipment Volume K Forecast, by Type 2019 & 2032
- Table 13: Global Blood Irradiation Equipment Revenue million Forecast, by Country 2019 & 2032
- Table 14: Global Blood Irradiation Equipment Volume K Forecast, by Country 2019 & 2032
- Table 15: United States Blood Irradiation Equipment Revenue (million) Forecast, by Application 2019 & 2032
- Table 16: United States Blood Irradiation Equipment Volume (K) Forecast, by Application 2019 & 2032
- Table 17: Canada Blood Irradiation Equipment Revenue (million) Forecast, by Application 2019 & 2032
- Table 18: Canada Blood Irradiation Equipment Volume (K) Forecast, by Application 2019 & 2032
- Table 19: Mexico Blood Irradiation Equipment Revenue (million) Forecast, by Application 2019 & 2032
- Table 20: Mexico Blood Irradiation Equipment Volume (K) Forecast, by Application 2019 & 2032
- Table 21: Global Blood Irradiation Equipment Revenue million Forecast, by Application 2019 & 2032
- Table 22: Global Blood Irradiation Equipment Volume K Forecast, by Application 2019 & 2032
- Table 23: Global Blood Irradiation Equipment Revenue million Forecast, by Type 2019 & 2032
- Table 24: Global Blood Irradiation Equipment Volume K Forecast, by Type 2019 & 2032
- Table 25: Global Blood Irradiation Equipment Revenue million Forecast, by Country 2019 & 2032
- Table 26: Global Blood Irradiation Equipment Volume K Forecast, by Country 2019 & 2032
- Table 27: Brazil Blood Irradiation Equipment Revenue (million) Forecast, by Application 2019 & 2032
- Table 28: Brazil Blood Irradiation Equipment Volume (K) Forecast, by Application 2019 & 2032
- Table 29: Argentina Blood Irradiation Equipment Revenue (million) Forecast, by Application 2019 & 2032
- Table 30: Argentina Blood Irradiation Equipment Volume (K) Forecast, by Application 2019 & 2032
- Table 31: Rest of South America Blood Irradiation Equipment Revenue (million) Forecast, by Application 2019 & 2032
- Table 32: Rest of South America Blood Irradiation Equipment Volume (K) Forecast, by Application 2019 & 2032
- Table 33: Global Blood Irradiation Equipment Revenue million Forecast, by Application 2019 & 2032
- Table 34: Global Blood Irradiation Equipment Volume K Forecast, by Application 2019 & 2032
- Table 35: Global Blood Irradiation Equipment Revenue million Forecast, by Type 2019 & 2032
- Table 36: Global Blood Irradiation Equipment Volume K Forecast, by Type 2019 & 2032
- Table 37: Global Blood Irradiation Equipment Revenue million Forecast, by Country 2019 & 2032
- Table 38: Global Blood Irradiation Equipment Volume K Forecast, by Country 2019 & 2032
- Table 39: United Kingdom Blood Irradiation Equipment Revenue (million) Forecast, by Application 2019 & 2032
- Table 40: United Kingdom Blood Irradiation Equipment Volume (K) Forecast, by Application 2019 & 2032
- Table 41: Germany Blood Irradiation Equipment Revenue (million) Forecast, by Application 2019 & 2032
- Table 42: Germany Blood Irradiation Equipment Volume (K) Forecast, by Application 2019 & 2032
- Table 43: France Blood Irradiation Equipment Revenue (million) Forecast, by Application 2019 & 2032
- Table 44: France Blood Irradiation Equipment Volume (K) Forecast, by Application 2019 & 2032
- Table 45: Italy Blood Irradiation Equipment Revenue (million) Forecast, by Application 2019 & 2032
- Table 46: Italy Blood Irradiation Equipment Volume (K) Forecast, by Application 2019 & 2032
- Table 47: Spain Blood Irradiation Equipment Revenue (million) Forecast, by Application 2019 & 2032
- Table 48: Spain Blood Irradiation Equipment Volume (K) Forecast, by Application 2019 & 2032
- Table 49: Russia Blood Irradiation Equipment Revenue (million) Forecast, by Application 2019 & 2032
- Table 50: Russia Blood Irradiation Equipment Volume (K) Forecast, by Application 2019 & 2032
- Table 51: Benelux Blood Irradiation Equipment Revenue (million) Forecast, by Application 2019 & 2032
- Table 52: Benelux Blood Irradiation Equipment Volume (K) Forecast, by Application 2019 & 2032
- Table 53: Nordics Blood Irradiation Equipment Revenue (million) Forecast, by Application 2019 & 2032
- Table 54: Nordics Blood Irradiation Equipment Volume (K) Forecast, by Application 2019 & 2032
- Table 55: Rest of Europe Blood Irradiation Equipment Revenue (million) Forecast, by Application 2019 & 2032
- Table 56: Rest of Europe Blood Irradiation Equipment Volume (K) Forecast, by Application 2019 & 2032
- Table 57: Global Blood Irradiation Equipment Revenue million Forecast, by Application 2019 & 2032
- Table 58: Global Blood Irradiation Equipment Volume K Forecast, by Application 2019 & 2032
- Table 59: Global Blood Irradiation Equipment Revenue million Forecast, by Type 2019 & 2032
- Table 60: Global Blood Irradiation Equipment Volume K Forecast, by Type 2019 & 2032
- Table 61: Global Blood Irradiation Equipment Revenue million Forecast, by Country 2019 & 2032
- Table 62: Global Blood Irradiation Equipment Volume K Forecast, by Country 2019 & 2032
- Table 63: Turkey Blood Irradiation Equipment Revenue (million) Forecast, by Application 2019 & 2032
- Table 64: Turkey Blood Irradiation Equipment Volume (K) Forecast, by Application 2019 & 2032
- Table 65: Israel Blood Irradiation Equipment Revenue (million) Forecast, by Application 2019 & 2032
- Table 66: Israel Blood Irradiation Equipment Volume (K) Forecast, by Application 2019 & 2032
- Table 67: GCC Blood Irradiation Equipment Revenue (million) Forecast, by Application 2019 & 2032
- Table 68: GCC Blood Irradiation Equipment Volume (K) Forecast, by Application 2019 & 2032
- Table 69: North Africa Blood Irradiation Equipment Revenue (million) Forecast, by Application 2019 & 2032
- Table 70: North Africa Blood Irradiation Equipment Volume (K) Forecast, by Application 2019 & 2032
- Table 71: South Africa Blood Irradiation Equipment Revenue (million) Forecast, by Application 2019 & 2032
- Table 72: South Africa Blood Irradiation Equipment Volume (K) Forecast, by Application 2019 & 2032
- Table 73: Rest of Middle East & Africa Blood Irradiation Equipment Revenue (million) Forecast, by Application 2019 & 2032
- Table 74: Rest of Middle East & Africa Blood Irradiation Equipment Volume (K) Forecast, by Application 2019 & 2032
- Table 75: Global Blood Irradiation Equipment Revenue million Forecast, by Application 2019 & 2032
- Table 76: Global Blood Irradiation Equipment Volume K Forecast, by Application 2019 & 2032
- Table 77: Global Blood Irradiation Equipment Revenue million Forecast, by Type 2019 & 2032
- Table 78: Global Blood Irradiation Equipment Volume K Forecast, by Type 2019 & 2032
- Table 79: Global Blood Irradiation Equipment Revenue million Forecast, by Country 2019 & 2032
- Table 80: Global Blood Irradiation Equipment Volume K Forecast, by Country 2019 & 2032
- Table 81: China Blood Irradiation Equipment Revenue (million) Forecast, by Application 2019 & 2032
- Table 82: China Blood Irradiation Equipment Volume (K) Forecast, by Application 2019 & 2032
- Table 83: India Blood Irradiation Equipment Revenue (million) Forecast, by Application 2019 & 2032
- Table 84: India Blood Irradiation Equipment Volume (K) Forecast, by Application 2019 & 2032
- Table 85: Japan Blood Irradiation Equipment Revenue (million) Forecast, by Application 2019 & 2032
- Table 86: Japan Blood Irradiation Equipment Volume (K) Forecast, by Application 2019 & 2032
- Table 87: South Korea Blood Irradiation Equipment Revenue (million) Forecast, by Application 2019 & 2032
- Table 88: South Korea Blood Irradiation Equipment Volume (K) Forecast, by Application 2019 & 2032
- Table 89: ASEAN Blood Irradiation Equipment Revenue (million) Forecast, by Application 2019 & 2032
- Table 90: ASEAN Blood Irradiation Equipment Volume (K) Forecast, by Application 2019 & 2032
- Table 91: Oceania Blood Irradiation Equipment Revenue (million) Forecast, by Application 2019 & 2032
- Table 92: Oceania Blood Irradiation Equipment Volume (K) Forecast, by Application 2019 & 2032
- Table 93: Rest of Asia Pacific Blood Irradiation Equipment Revenue (million) Forecast, by Application 2019 & 2032
- Table 94: Rest of Asia Pacific Blood Irradiation Equipment Volume (K) Forecast, by Application 2019 & 2032
Frequently Asked Questions
1. What is the projected Compound Annual Growth Rate (CAGR) of the Blood Irradiation Equipment?
The projected CAGR is approximately 3.4%.
2. Which companies are prominent players in the Blood Irradiation Equipment?
Key companies in the market include Best Theratronics, WEGO (WEGO (Rad Source)), Fujifilm, Gilardoni, Actemium, Eckert&Ziegler, Shinva Medical, NPIC, LIVZON.
3. What are the main segments of the Blood Irradiation Equipment?
The market segments include Application, Type.
4. Can you provide details about the market size?
The market size is estimated to be USD 125 million as of 2022.
5. What are some drivers contributing to market growth?
N/A
6. What are the notable trends driving market growth?
N/A
7. Are there any restraints impacting market growth?
N/A
8. Can you provide examples of recent developments in the market?
N/A
9. What pricing options are available for accessing the report?
Pricing options include single-user, multi-user, and enterprise licenses priced at USD 3950.00, USD 5925.00, and USD 7900.00 respectively.
10. Is the market size provided in terms of value or volume?
The market size is provided in terms of value, measured in million and volume, measured in K.
11. Are there any specific market keywords associated with the report?
Yes, the market keyword associated with the report is "Blood Irradiation Equipment," which aids in identifying and referencing the specific market segment covered.
12. How do I determine which pricing option suits my needs best?
The pricing options vary based on user requirements and access needs. Individual users may opt for single-user licenses, while businesses requiring broader access may choose multi-user or enterprise licenses for cost-effective access to the report.
13. Are there any additional resources or data provided in the Blood Irradiation Equipment report?
While the report offers comprehensive insights, it's advisable to review the specific contents or supplementary materials provided to ascertain if additional resources or data are available.
14. How can I stay updated on further developments or reports in the Blood Irradiation Equipment?
To stay informed about further developments, trends, and reports in the Blood Irradiation Equipment, consider subscribing to industry newsletters, following relevant companies and organizations, or regularly checking reputable industry news sources and publications.
Methodology
Step 1 - Identification of Relevant Samples Size from Population Database


Step 2 - Approaches for Defining Global Market Size (Value, Volume* & Price*)

Note*: In applicable scenarios
Step 3 - Data Sources
Primary Research
- Web Analytics
- Survey Reports
- Research Institute
- Latest Research Reports
- Opinion Leaders
Secondary Research
- Annual Reports
- White Paper
- Latest Press Release
- Industry Association
- Paid Database
- Investor Presentations

Step 4 - Data Triangulation
Involves using different sources of information in order to increase the validity of a study
These sources are likely to be stakeholders in a program - participants, other researchers, program staff, other community members, and so on.
Then we put all data in single framework & apply various statistical tools to find out the dynamic on the market.
During the analysis stage, feedback from the stakeholder groups would be compared to determine areas of agreement as well as areas of divergence
