

Key Insights
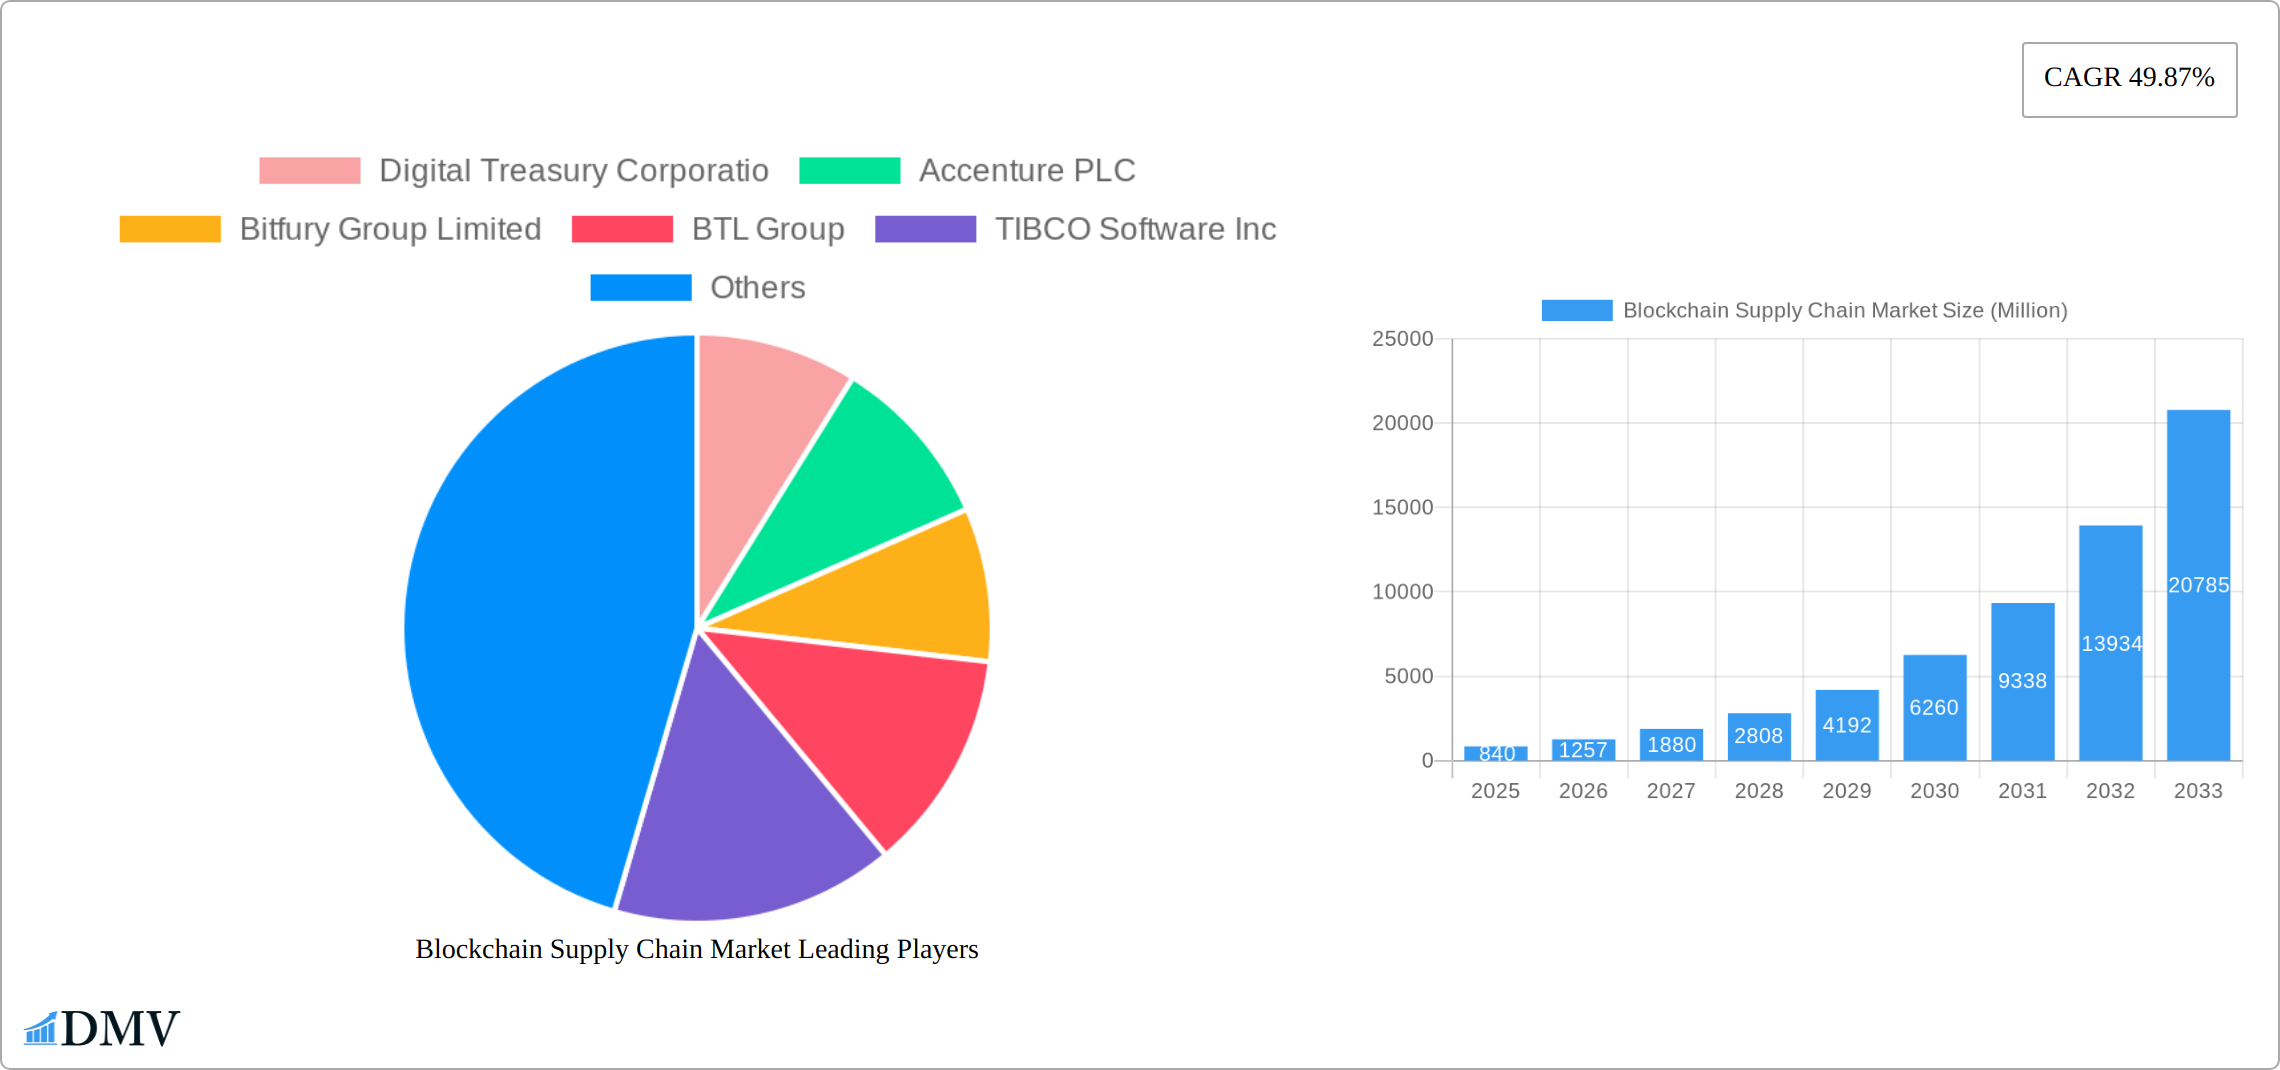
The Blockchain Supply Chain Market is experiencing explosive growth, projected to reach a value of $0.84 billion in 2025 and exhibiting a remarkable Compound Annual Growth Rate (CAGR) of 49.87% from 2025 to 2033. This expansion is driven by several key factors. The increasing need for enhanced transparency and traceability throughout the supply chain is a major catalyst. Businesses are actively seeking solutions to combat counterfeiting, improve product quality control, and optimize logistics. Furthermore, the growing adoption of smart contracts facilitates automated processes, reduces delays, and minimizes disputes, contributing to significant cost savings and increased efficiency. Regulations aimed at enhancing supply chain visibility and accountability also fuel market growth. The market is segmented by component (platform and services), application (payment & settlement, product traceability, counterfeit detection, smart contracts, risk & compliance management, and other applications), and industry vertical (retail & consumer goods, healthcare & life sciences, manufacturing, logistics, oil & gas, and others). The strong presence of major technology companies like IBM, Microsoft, and Amazon Web Services, coupled with the emergence of specialized blockchain solutions providers, indicates a robust and competitive market landscape. Geographical distribution reveals a strong presence in North America and Europe, with significant growth potential in Asia-Pacific driven by the rapid industrialization and digital transformation occurring in major economies like China and India.
The significant CAGR suggests continuous market expansion throughout the forecast period (2025-2033). The increasing adoption of blockchain technology across various industries indicates sustained demand for robust supply chain solutions. Growth will likely be propelled by improvements in scalability, interoperability, and the development of user-friendly interfaces. The competitive landscape will see further consolidation as companies invest in research and development and strategic partnerships. Challenges such as regulatory uncertainty, technological complexity, and the need for widespread industry adoption remain, yet the long-term outlook for the Blockchain Supply Chain Market remains exceptionally positive, projecting substantial growth in the coming years.
Blockchain Supply Chain Market: A Comprehensive Report (2019-2033)
This insightful report provides a detailed analysis of the Blockchain Supply Chain Market, offering a comprehensive overview of its current state, future trajectory, and key players. With a focus on market segmentation, technological advancements, and growth drivers, this report is an invaluable resource for stakeholders seeking to understand and capitalize on the opportunities within this rapidly evolving sector. The study period covers 2019-2033, with 2025 serving as the base and estimated year. The forecast period spans 2025-2033, while the historical period encompasses 2019-2024. The market is projected to reach xx Million by 2033.
Blockchain Supply Chain Market Composition & Trends
The Blockchain Supply Chain Market is characterized by a moderately concentrated landscape with several major players competing for market share. Market concentration is expected to shift slightly towards larger companies due to increased M&A activity and the capital-intensive nature of blockchain infrastructure development. Innovation is primarily driven by advancements in distributed ledger technology (DLT), improved scalability solutions, and the increasing integration of IoT devices. Regulatory landscapes vary significantly across geographical regions, impacting adoption rates and investment strategies. Substitute products, such as traditional centralized supply chain management systems, still hold a substantial market share, though blockchain solutions offer compelling advantages in terms of transparency and security. The end-user profile includes diverse sectors such as retail, healthcare, manufacturing, and logistics.
- Market Share Distribution (2024): IBM Corporation: 15%; SAP SE: 12%; Accenture PLC: 10%; Oracle Corporation: 8%; Others: 55% (estimated)
- M&A Activity (2019-2024): Total deal value estimated at xx Million, with an average deal size of xx Million. Notable acquisitions include Oracle's partnership with InfStones (August 2022).

Blockchain Supply Chain Market Industry Evolution
The Blockchain Supply Chain Market has witnessed substantial growth since 2019, fueled by increasing awareness of blockchain's potential to enhance supply chain transparency, traceability, and efficiency. Early adoption was primarily concentrated in niche sectors like pharmaceuticals and luxury goods. However, the market is expanding rapidly into mainstream industries, driven by factors such as growing demand for secure and verifiable data, increasing concerns about counterfeiting, and the need for streamlined supply chain processes. Technological advancements, such as improved consensus mechanisms and the development of enterprise-grade blockchain platforms, have significantly reduced barriers to entry. Consumer demand for ethical and sustainable products is also acting as a catalyst, driving adoption in sectors focused on product origin verification and environmental impact tracking. This translates into a Compound Annual Growth Rate (CAGR) of xx% during the historical period and a projected CAGR of xx% during the forecast period. Adoption metrics show a significant increase in the number of enterprises actively implementing blockchain solutions in their supply chains.
Leading Regions, Countries, or Segments in Blockchain Supply Chain Market
The North American region holds the dominant position in the Blockchain Supply Chain Market, driven by high levels of technological innovation, early adoption by large enterprises, and supportive regulatory frameworks. Europe and Asia-Pacific regions are witnessing rapid growth, with significant investments in blockchain infrastructure and government initiatives promoting digital transformation. Within segments:
By Component: The Platform segment leads the market due to its foundational role in enabling blockchain-based supply chain solutions. The Services segment is experiencing rapid growth, as more companies outsource the implementation and management of blockchain solutions.
By Application: Product Traceability and Counterfeit Detection hold significant market share due to consumer demands for authenticity and increased regulatory scrutiny.
By Industry Vertical: The Retail & Consumer Goods sector leads the market owing to high consumer awareness of ethical sourcing and product provenance. Healthcare & Life Sciences sectors show significant growth potential, due to strict regulatory requirements and the need for secure data management within the pharmaceutical supply chains.
- Key Drivers for North American Dominance:
- High levels of venture capital investment in blockchain startups.
- Strong presence of major technology companies driving adoption.
- Relatively favorable regulatory environment for blockchain technology.
Blockchain Supply Chain Market Product Innovations
Recent innovations have focused on enhancing scalability, interoperability, and usability of blockchain-based supply chain solutions. This involves developing hybrid approaches that combine the benefits of public and private blockchains, integrating advanced analytics capabilities to extract actionable insights from supply chain data and creating user-friendly interfaces to improve accessibility. Unique selling propositions include improved transparency, enhanced security, and reduction of operational costs, making it a compelling alternative to traditional supply chain management systems. Technological advancements such as the increased use of smart contracts are further streamlining processes and automating workflows.
Propelling Factors for Blockchain Supply Chain Market Growth
Several factors are fueling the growth of the Blockchain Supply Chain Market. Technological advancements, such as improved scalability and interoperability of blockchain platforms, are making the technology more accessible and cost-effective for businesses. Economic benefits, such as reduced operational costs, improved efficiency, and minimized fraud, are incentivizing adoption. Finally, increasing regulatory support for blockchain technology in various regions is fostering innovation and encouraging broader market adoption. The USD 30 Million investment by the USAF (February 2023) exemplifies the growing governmental support and investment in blockchain for supply chain management.
Obstacles in the Blockchain Supply Chain Market
Despite the market’s growth potential, several obstacles hinder wider adoption. Regulatory uncertainties and the lack of clear regulatory frameworks in certain regions create challenges for businesses seeking to implement blockchain solutions. Interoperability issues between different blockchain platforms and legacy systems pose integration challenges and limit the seamless flow of data across the supply chain. Lastly, competitive pressures from established supply chain management providers and the complexity of integrating blockchain technologies into existing business processes also slow down the rate of adoption.
Future Opportunities in Blockchain Supply Chain Market
Future opportunities lie in expanding into new markets, especially developing economies with less-developed supply chain infrastructure. The integration of advanced technologies such as Artificial Intelligence (AI) and Machine Learning (ML) with blockchain can enhance predictive analytics and optimize supply chain processes. The increasing demand for sustainable and ethical products will drive the adoption of blockchain for tracking and verification of supply chain sustainability initiatives.
Major Players in the Blockchain Supply Chain Market Ecosystem
- Accenture PLC
- Bitfury Group Limited
- BTL Group
- TIBCO Software Inc
- IBM Corporation
- Microsoft Corporation
- Amazon Web Services Inc
- Huawei Technologies Co Ltd
- Oracle Corporation
- VeChain Foundation
- Omnichain Inc
- Guardtime Inc
- Auxesis Group
- SAP SE
- Digital Treasury Corporation
Key Developments in Blockchain Supply Chain Market Industry
- November 2023: MY E.G. Service’s Zetrix launches a supply chain financing project with Chinese banks.
- February 2023: The US Air Force invests USD 30 Million in blockchain-based supply chain management solutions.
- August 2022: Oracle partners with InfStones to expand its blockchain product portfolio.
- March 2022: Unilever implements SAP SE's blockchain technology for palm oil traceability.
Strategic Blockchain Supply Chain Market Forecast
The Blockchain Supply Chain Market is poised for significant growth in the coming years, driven by increasing technological advancements, rising adoption rates across diverse industries, and supportive regulatory environments. The market’s future potential is considerable, with opportunities for innovation and expansion across various segments and geographies. The continued development of user-friendly interfaces, improved interoperability standards, and the integration of advanced analytics will be key to accelerating adoption and unlocking the full potential of blockchain technology in transforming supply chain operations globally.
Blockchain Supply Chain Market Segmentation
-
1. Application
- 1.1. Payment & Settlement
- 1.2. Product Traceability
- 1.3. Counterfeit Detection
- 1.4. Smart Contracts
- 1.5. Risk & Compliance Management
- 1.6. Other Applications
-
2. Industry Vertical
- 2.1. Retail & Consumer Goods
- 2.2. Healthcare & Life Sciences
- 2.3. Manufacturing
- 2.4. Logistics, Oil & Gas
- 2.5. Other Industry Verticals
-
3. Component
- 3.1. Platform
- 3.2. Services
Blockchain Supply Chain Market Segmentation By Geography
-
1. North America
- 1.1. United States
- 1.2. Canada
-
2. Europe
- 2.1. Germany
- 2.2. United Kingdom
- 2.3. France
- 2.4. Spain
-
3. Asia
- 3.1. China
- 3.2. Japan
- 3.3. India
- 3.4. Australia
-
4. Latin America
- 4.1. Brazil
- 4.2. Mexico
- 4.3. Argentina
-
5. Middle East and Africa
- 5.1. United Arab Emirates
- 5.2. Saudi Arabia
- 5.3. South Africa

Blockchain Supply Chain Market REPORT HIGHLIGHTS
| Aspects | Details |
|---|---|
| Study Period | 2019-2033 |
| Base Year | 2024 |
| Estimated Year | 2025 |
| Forecast Period | 2025-2033 |
| Historical Period | 2019-2024 |
| Growth Rate | CAGR of 49.87% from 2019-2033 |
| Segmentation |
|
Table of Contents
- 1. Introduction
- 1.1. Research Scope
- 1.2. Market Segmentation
- 1.3. Research Methodology
- 1.4. Definitions and Assumptions
- 2. Executive Summary
- 2.1. Introduction
- 3. Market Dynamics
- 3.1. Introduction
- 3.2. Market Drivers
- 3.2.1. Augmented Demand for Improved Security of Supply Chain Transactions; Growing Requirement for Supply Chain Transparency; Rising use of Blockchain in Retail & Consumer Goods sector
- 3.3. Market Restrains
- 3.3.1. Absence of Awareness of the Blockchain Technology
- 3.4. Market Trends
- 3.4.1. Retail & Consumer Goods to Dominate the Market
- 4. Market Factor Analysis
- 4.1. Porters Five Forces
- 4.2. Supply/Value Chain
- 4.3. PESTEL analysis
- 4.4. Market Entropy
- 4.5. Patent/Trademark Analysis
- 5. Global Blockchain Supply Chain Market Analysis, Insights and Forecast, 2019-2031
- 5.1. Market Analysis, Insights and Forecast - by Application
- 5.1.1. Payment & Settlement
- 5.1.2. Product Traceability
- 5.1.3. Counterfeit Detection
- 5.1.4. Smart Contracts
- 5.1.5. Risk & Compliance Management
- 5.1.6. Other Applications
- 5.2. Market Analysis, Insights and Forecast - by Industry Vertical
- 5.2.1. Retail & Consumer Goods
- 5.2.2. Healthcare & Life Sciences
- 5.2.3. Manufacturing
- 5.2.4. Logistics, Oil & Gas
- 5.2.5. Other Industry Verticals
- 5.3. Market Analysis, Insights and Forecast - by Component
- 5.3.1. Platform
- 5.3.2. Services
- 5.4. Market Analysis, Insights and Forecast - by Region
- 5.4.1. North America
- 5.4.2. Europe
- 5.4.3. Asia
- 5.4.4. Latin America
- 5.4.5. Middle East and Africa
- 5.1. Market Analysis, Insights and Forecast - by Application
- 6. North America Blockchain Supply Chain Market Analysis, Insights and Forecast, 2019-2031
- 6.1. Market Analysis, Insights and Forecast - by Application
- 6.1.1. Payment & Settlement
- 6.1.2. Product Traceability
- 6.1.3. Counterfeit Detection
- 6.1.4. Smart Contracts
- 6.1.5. Risk & Compliance Management
- 6.1.6. Other Applications
- 6.2. Market Analysis, Insights and Forecast - by Industry Vertical
- 6.2.1. Retail & Consumer Goods
- 6.2.2. Healthcare & Life Sciences
- 6.2.3. Manufacturing
- 6.2.4. Logistics, Oil & Gas
- 6.2.5. Other Industry Verticals
- 6.3. Market Analysis, Insights and Forecast - by Component
- 6.3.1. Platform
- 6.3.2. Services
- 6.1. Market Analysis, Insights and Forecast - by Application
- 7. Europe Blockchain Supply Chain Market Analysis, Insights and Forecast, 2019-2031
- 7.1. Market Analysis, Insights and Forecast - by Application
- 7.1.1. Payment & Settlement
- 7.1.2. Product Traceability
- 7.1.3. Counterfeit Detection
- 7.1.4. Smart Contracts
- 7.1.5. Risk & Compliance Management
- 7.1.6. Other Applications
- 7.2. Market Analysis, Insights and Forecast - by Industry Vertical
- 7.2.1. Retail & Consumer Goods
- 7.2.2. Healthcare & Life Sciences
- 7.2.3. Manufacturing
- 7.2.4. Logistics, Oil & Gas
- 7.2.5. Other Industry Verticals
- 7.3. Market Analysis, Insights and Forecast - by Component
- 7.3.1. Platform
- 7.3.2. Services
- 7.1. Market Analysis, Insights and Forecast - by Application
- 8. Asia Blockchain Supply Chain Market Analysis, Insights and Forecast, 2019-2031
- 8.1. Market Analysis, Insights and Forecast - by Application
- 8.1.1. Payment & Settlement
- 8.1.2. Product Traceability
- 8.1.3. Counterfeit Detection
- 8.1.4. Smart Contracts
- 8.1.5. Risk & Compliance Management
- 8.1.6. Other Applications
- 8.2. Market Analysis, Insights and Forecast - by Industry Vertical
- 8.2.1. Retail & Consumer Goods
- 8.2.2. Healthcare & Life Sciences
- 8.2.3. Manufacturing
- 8.2.4. Logistics, Oil & Gas
- 8.2.5. Other Industry Verticals
- 8.3. Market Analysis, Insights and Forecast - by Component
- 8.3.1. Platform
- 8.3.2. Services
- 8.1. Market Analysis, Insights and Forecast - by Application
- 9. Latin America Blockchain Supply Chain Market Analysis, Insights and Forecast, 2019-2031
- 9.1. Market Analysis, Insights and Forecast - by Application
- 9.1.1. Payment & Settlement
- 9.1.2. Product Traceability
- 9.1.3. Counterfeit Detection
- 9.1.4. Smart Contracts
- 9.1.5. Risk & Compliance Management
- 9.1.6. Other Applications
- 9.2. Market Analysis, Insights and Forecast - by Industry Vertical
- 9.2.1. Retail & Consumer Goods
- 9.2.2. Healthcare & Life Sciences
- 9.2.3. Manufacturing
- 9.2.4. Logistics, Oil & Gas
- 9.2.5. Other Industry Verticals
- 9.3. Market Analysis, Insights and Forecast - by Component
- 9.3.1. Platform
- 9.3.2. Services
- 9.1. Market Analysis, Insights and Forecast - by Application
- 10. Middle East and Africa Blockchain Supply Chain Market Analysis, Insights and Forecast, 2019-2031
- 10.1. Market Analysis, Insights and Forecast - by Application
- 10.1.1. Payment & Settlement
- 10.1.2. Product Traceability
- 10.1.3. Counterfeit Detection
- 10.1.4. Smart Contracts
- 10.1.5. Risk & Compliance Management
- 10.1.6. Other Applications
- 10.2. Market Analysis, Insights and Forecast - by Industry Vertical
- 10.2.1. Retail & Consumer Goods
- 10.2.2. Healthcare & Life Sciences
- 10.2.3. Manufacturing
- 10.2.4. Logistics, Oil & Gas
- 10.2.5. Other Industry Verticals
- 10.3. Market Analysis, Insights and Forecast - by Component
- 10.3.1. Platform
- 10.3.2. Services
- 10.1. Market Analysis, Insights and Forecast - by Application
- 11. North America Blockchain Supply Chain Market Analysis, Insights and Forecast, 2019-2031
- 11.1. Market Analysis, Insights and Forecast - By Country/Sub-region
- 11.1.1 United States
- 11.1.2 Canada
- 11.1.3 Mexico
- 12. Europe Blockchain Supply Chain Market Analysis, Insights and Forecast, 2019-2031
- 12.1. Market Analysis, Insights and Forecast - By Country/Sub-region
- 12.1.1 Germany
- 12.1.2 United Kingdom
- 12.1.3 France
- 12.1.4 Spain
- 12.1.5 Italy
- 12.1.6 Spain
- 12.1.7 Belgium
- 12.1.8 Netherland
- 12.1.9 Nordics
- 12.1.10 Rest of Europe
- 13. Asia Pacific Blockchain Supply Chain Market Analysis, Insights and Forecast, 2019-2031
- 13.1. Market Analysis, Insights and Forecast - By Country/Sub-region
- 13.1.1 China
- 13.1.2 Japan
- 13.1.3 India
- 13.1.4 South Korea
- 13.1.5 Southeast Asia
- 13.1.6 Australia
- 13.1.7 Indonesia
- 13.1.8 Phillipes
- 13.1.9 Singapore
- 13.1.10 Thailandc
- 13.1.11 Rest of Asia Pacific
- 14. South America Blockchain Supply Chain Market Analysis, Insights and Forecast, 2019-2031
- 14.1. Market Analysis, Insights and Forecast - By Country/Sub-region
- 14.1.1 Brazil
- 14.1.2 Argentina
- 14.1.3 Peru
- 14.1.4 Chile
- 14.1.5 Colombia
- 14.1.6 Ecuador
- 14.1.7 Venezuela
- 14.1.8 Rest of South America
- 15. North America Blockchain Supply Chain Market Analysis, Insights and Forecast, 2019-2031
- 15.1. Market Analysis, Insights and Forecast - By Country/Sub-region
- 15.1.1 United States
- 15.1.2 Canada
- 15.1.3 Mexico
- 16. MEA Blockchain Supply Chain Market Analysis, Insights and Forecast, 2019-2031
- 16.1. Market Analysis, Insights and Forecast - By Country/Sub-region
- 16.1.1 United Arab Emirates
- 16.1.2 Saudi Arabia
- 16.1.3 South Africa
- 16.1.4 Rest of Middle East and Africa
- 17. Competitive Analysis
- 17.1. Global Market Share Analysis 2024
- 17.2. Company Profiles
- 17.2.1 Digital Treasury Corporatio
- 17.2.1.1. Overview
- 17.2.1.2. Products
- 17.2.1.3. SWOT Analysis
- 17.2.1.4. Recent Developments
- 17.2.1.5. Financials (Based on Availability)
- 17.2.2 Accenture PLC
- 17.2.2.1. Overview
- 17.2.2.2. Products
- 17.2.2.3. SWOT Analysis
- 17.2.2.4. Recent Developments
- 17.2.2.5. Financials (Based on Availability)
- 17.2.3 Bitfury Group Limited
- 17.2.3.1. Overview
- 17.2.3.2. Products
- 17.2.3.3. SWOT Analysis
- 17.2.3.4. Recent Developments
- 17.2.3.5. Financials (Based on Availability)
- 17.2.4 BTL Group
- 17.2.4.1. Overview
- 17.2.4.2. Products
- 17.2.4.3. SWOT Analysis
- 17.2.4.4. Recent Developments
- 17.2.4.5. Financials (Based on Availability)
- 17.2.5 TIBCO Software Inc
- 17.2.5.1. Overview
- 17.2.5.2. Products
- 17.2.5.3. SWOT Analysis
- 17.2.5.4. Recent Developments
- 17.2.5.5. Financials (Based on Availability)
- 17.2.6 IBM Corporation
- 17.2.6.1. Overview
- 17.2.6.2. Products
- 17.2.6.3. SWOT Analysis
- 17.2.6.4. Recent Developments
- 17.2.6.5. Financials (Based on Availability)
- 17.2.7 Microsoft Corporation
- 17.2.7.1. Overview
- 17.2.7.2. Products
- 17.2.7.3. SWOT Analysis
- 17.2.7.4. Recent Developments
- 17.2.7.5. Financials (Based on Availability)
- 17.2.8 Amazon Web Services Inc
- 17.2.8.1. Overview
- 17.2.8.2. Products
- 17.2.8.3. SWOT Analysis
- 17.2.8.4. Recent Developments
- 17.2.8.5. Financials (Based on Availability)
- 17.2.9 Huawei Technologies Co Ltd
- 17.2.9.1. Overview
- 17.2.9.2. Products
- 17.2.9.3. SWOT Analysis
- 17.2.9.4. Recent Developments
- 17.2.9.5. Financials (Based on Availability)
- 17.2.10 Oracle Corporation
- 17.2.10.1. Overview
- 17.2.10.2. Products
- 17.2.10.3. SWOT Analysis
- 17.2.10.4. Recent Developments
- 17.2.10.5. Financials (Based on Availability)
- 17.2.11 VeChain Foundation
- 17.2.11.1. Overview
- 17.2.11.2. Products
- 17.2.11.3. SWOT Analysis
- 17.2.11.4. Recent Developments
- 17.2.11.5. Financials (Based on Availability)
- 17.2.12 Omnichain Inc
- 17.2.12.1. Overview
- 17.2.12.2. Products
- 17.2.12.3. SWOT Analysis
- 17.2.12.4. Recent Developments
- 17.2.12.5. Financials (Based on Availability)
- 17.2.13 Guardtime Inc
- 17.2.13.1. Overview
- 17.2.13.2. Products
- 17.2.13.3. SWOT Analysis
- 17.2.13.4. Recent Developments
- 17.2.13.5. Financials (Based on Availability)
- 17.2.14 Auxesis Group
- 17.2.14.1. Overview
- 17.2.14.2. Products
- 17.2.14.3. SWOT Analysis
- 17.2.14.4. Recent Developments
- 17.2.14.5. Financials (Based on Availability)
- 17.2.15 SAP SE
- 17.2.15.1. Overview
- 17.2.15.2. Products
- 17.2.15.3. SWOT Analysis
- 17.2.15.4. Recent Developments
- 17.2.15.5. Financials (Based on Availability)
- 17.2.1 Digital Treasury Corporatio
List of Figures
- Figure 1: Global Blockchain Supply Chain Market Revenue Breakdown (Million, %) by Region 2024 & 2032
- Figure 2: North America Blockchain Supply Chain Market Revenue (Million), by Country 2024 & 2032
- Figure 3: North America Blockchain Supply Chain Market Revenue Share (%), by Country 2024 & 2032
- Figure 4: Europe Blockchain Supply Chain Market Revenue (Million), by Country 2024 & 2032
- Figure 5: Europe Blockchain Supply Chain Market Revenue Share (%), by Country 2024 & 2032
- Figure 6: Asia Pacific Blockchain Supply Chain Market Revenue (Million), by Country 2024 & 2032
- Figure 7: Asia Pacific Blockchain Supply Chain Market Revenue Share (%), by Country 2024 & 2032
- Figure 8: South America Blockchain Supply Chain Market Revenue (Million), by Country 2024 & 2032
- Figure 9: South America Blockchain Supply Chain Market Revenue Share (%), by Country 2024 & 2032
- Figure 10: North America Blockchain Supply Chain Market Revenue (Million), by Country 2024 & 2032
- Figure 11: North America Blockchain Supply Chain Market Revenue Share (%), by Country 2024 & 2032
- Figure 12: MEA Blockchain Supply Chain Market Revenue (Million), by Country 2024 & 2032
- Figure 13: MEA Blockchain Supply Chain Market Revenue Share (%), by Country 2024 & 2032
- Figure 14: North America Blockchain Supply Chain Market Revenue (Million), by Application 2024 & 2032
- Figure 15: North America Blockchain Supply Chain Market Revenue Share (%), by Application 2024 & 2032
- Figure 16: North America Blockchain Supply Chain Market Revenue (Million), by Industry Vertical 2024 & 2032
- Figure 17: North America Blockchain Supply Chain Market Revenue Share (%), by Industry Vertical 2024 & 2032
- Figure 18: North America Blockchain Supply Chain Market Revenue (Million), by Component 2024 & 2032
- Figure 19: North America Blockchain Supply Chain Market Revenue Share (%), by Component 2024 & 2032
- Figure 20: North America Blockchain Supply Chain Market Revenue (Million), by Country 2024 & 2032
- Figure 21: North America Blockchain Supply Chain Market Revenue Share (%), by Country 2024 & 2032
- Figure 22: Europe Blockchain Supply Chain Market Revenue (Million), by Application 2024 & 2032
- Figure 23: Europe Blockchain Supply Chain Market Revenue Share (%), by Application 2024 & 2032
- Figure 24: Europe Blockchain Supply Chain Market Revenue (Million), by Industry Vertical 2024 & 2032
- Figure 25: Europe Blockchain Supply Chain Market Revenue Share (%), by Industry Vertical 2024 & 2032
- Figure 26: Europe Blockchain Supply Chain Market Revenue (Million), by Component 2024 & 2032
- Figure 27: Europe Blockchain Supply Chain Market Revenue Share (%), by Component 2024 & 2032
- Figure 28: Europe Blockchain Supply Chain Market Revenue (Million), by Country 2024 & 2032
- Figure 29: Europe Blockchain Supply Chain Market Revenue Share (%), by Country 2024 & 2032
- Figure 30: Asia Blockchain Supply Chain Market Revenue (Million), by Application 2024 & 2032
- Figure 31: Asia Blockchain Supply Chain Market Revenue Share (%), by Application 2024 & 2032
- Figure 32: Asia Blockchain Supply Chain Market Revenue (Million), by Industry Vertical 2024 & 2032
- Figure 33: Asia Blockchain Supply Chain Market Revenue Share (%), by Industry Vertical 2024 & 2032
- Figure 34: Asia Blockchain Supply Chain Market Revenue (Million), by Component 2024 & 2032
- Figure 35: Asia Blockchain Supply Chain Market Revenue Share (%), by Component 2024 & 2032
- Figure 36: Asia Blockchain Supply Chain Market Revenue (Million), by Country 2024 & 2032
- Figure 37: Asia Blockchain Supply Chain Market Revenue Share (%), by Country 2024 & 2032
- Figure 38: Latin America Blockchain Supply Chain Market Revenue (Million), by Application 2024 & 2032
- Figure 39: Latin America Blockchain Supply Chain Market Revenue Share (%), by Application 2024 & 2032
- Figure 40: Latin America Blockchain Supply Chain Market Revenue (Million), by Industry Vertical 2024 & 2032
- Figure 41: Latin America Blockchain Supply Chain Market Revenue Share (%), by Industry Vertical 2024 & 2032
- Figure 42: Latin America Blockchain Supply Chain Market Revenue (Million), by Component 2024 & 2032
- Figure 43: Latin America Blockchain Supply Chain Market Revenue Share (%), by Component 2024 & 2032
- Figure 44: Latin America Blockchain Supply Chain Market Revenue (Million), by Country 2024 & 2032
- Figure 45: Latin America Blockchain Supply Chain Market Revenue Share (%), by Country 2024 & 2032
- Figure 46: Middle East and Africa Blockchain Supply Chain Market Revenue (Million), by Application 2024 & 2032
- Figure 47: Middle East and Africa Blockchain Supply Chain Market Revenue Share (%), by Application 2024 & 2032
- Figure 48: Middle East and Africa Blockchain Supply Chain Market Revenue (Million), by Industry Vertical 2024 & 2032
- Figure 49: Middle East and Africa Blockchain Supply Chain Market Revenue Share (%), by Industry Vertical 2024 & 2032
- Figure 50: Middle East and Africa Blockchain Supply Chain Market Revenue (Million), by Component 2024 & 2032
- Figure 51: Middle East and Africa Blockchain Supply Chain Market Revenue Share (%), by Component 2024 & 2032
- Figure 52: Middle East and Africa Blockchain Supply Chain Market Revenue (Million), by Country 2024 & 2032
- Figure 53: Middle East and Africa Blockchain Supply Chain Market Revenue Share (%), by Country 2024 & 2032
List of Tables
- Table 1: Global Blockchain Supply Chain Market Revenue Million Forecast, by Region 2019 & 2032
- Table 2: Global Blockchain Supply Chain Market Revenue Million Forecast, by Application 2019 & 2032
- Table 3: Global Blockchain Supply Chain Market Revenue Million Forecast, by Industry Vertical 2019 & 2032
- Table 4: Global Blockchain Supply Chain Market Revenue Million Forecast, by Component 2019 & 2032
- Table 5: Global Blockchain Supply Chain Market Revenue Million Forecast, by Region 2019 & 2032
- Table 6: Global Blockchain Supply Chain Market Revenue Million Forecast, by Country 2019 & 2032
- Table 7: United States Blockchain Supply Chain Market Revenue (Million) Forecast, by Application 2019 & 2032
- Table 8: Canada Blockchain Supply Chain Market Revenue (Million) Forecast, by Application 2019 & 2032
- Table 9: Mexico Blockchain Supply Chain Market Revenue (Million) Forecast, by Application 2019 & 2032
- Table 10: Global Blockchain Supply Chain Market Revenue Million Forecast, by Country 2019 & 2032
- Table 11: Germany Blockchain Supply Chain Market Revenue (Million) Forecast, by Application 2019 & 2032
- Table 12: United Kingdom Blockchain Supply Chain Market Revenue (Million) Forecast, by Application 2019 & 2032
- Table 13: France Blockchain Supply Chain Market Revenue (Million) Forecast, by Application 2019 & 2032
- Table 14: Spain Blockchain Supply Chain Market Revenue (Million) Forecast, by Application 2019 & 2032
- Table 15: Italy Blockchain Supply Chain Market Revenue (Million) Forecast, by Application 2019 & 2032
- Table 16: Spain Blockchain Supply Chain Market Revenue (Million) Forecast, by Application 2019 & 2032
- Table 17: Belgium Blockchain Supply Chain Market Revenue (Million) Forecast, by Application 2019 & 2032
- Table 18: Netherland Blockchain Supply Chain Market Revenue (Million) Forecast, by Application 2019 & 2032
- Table 19: Nordics Blockchain Supply Chain Market Revenue (Million) Forecast, by Application 2019 & 2032
- Table 20: Rest of Europe Blockchain Supply Chain Market Revenue (Million) Forecast, by Application 2019 & 2032
- Table 21: Global Blockchain Supply Chain Market Revenue Million Forecast, by Country 2019 & 2032
- Table 22: China Blockchain Supply Chain Market Revenue (Million) Forecast, by Application 2019 & 2032
- Table 23: Japan Blockchain Supply Chain Market Revenue (Million) Forecast, by Application 2019 & 2032
- Table 24: India Blockchain Supply Chain Market Revenue (Million) Forecast, by Application 2019 & 2032
- Table 25: South Korea Blockchain Supply Chain Market Revenue (Million) Forecast, by Application 2019 & 2032
- Table 26: Southeast Asia Blockchain Supply Chain Market Revenue (Million) Forecast, by Application 2019 & 2032
- Table 27: Australia Blockchain Supply Chain Market Revenue (Million) Forecast, by Application 2019 & 2032
- Table 28: Indonesia Blockchain Supply Chain Market Revenue (Million) Forecast, by Application 2019 & 2032
- Table 29: Phillipes Blockchain Supply Chain Market Revenue (Million) Forecast, by Application 2019 & 2032
- Table 30: Singapore Blockchain Supply Chain Market Revenue (Million) Forecast, by Application 2019 & 2032
- Table 31: Thailandc Blockchain Supply Chain Market Revenue (Million) Forecast, by Application 2019 & 2032
- Table 32: Rest of Asia Pacific Blockchain Supply Chain Market Revenue (Million) Forecast, by Application 2019 & 2032
- Table 33: Global Blockchain Supply Chain Market Revenue Million Forecast, by Country 2019 & 2032
- Table 34: Brazil Blockchain Supply Chain Market Revenue (Million) Forecast, by Application 2019 & 2032
- Table 35: Argentina Blockchain Supply Chain Market Revenue (Million) Forecast, by Application 2019 & 2032
- Table 36: Peru Blockchain Supply Chain Market Revenue (Million) Forecast, by Application 2019 & 2032
- Table 37: Chile Blockchain Supply Chain Market Revenue (Million) Forecast, by Application 2019 & 2032
- Table 38: Colombia Blockchain Supply Chain Market Revenue (Million) Forecast, by Application 2019 & 2032
- Table 39: Ecuador Blockchain Supply Chain Market Revenue (Million) Forecast, by Application 2019 & 2032
- Table 40: Venezuela Blockchain Supply Chain Market Revenue (Million) Forecast, by Application 2019 & 2032
- Table 41: Rest of South America Blockchain Supply Chain Market Revenue (Million) Forecast, by Application 2019 & 2032
- Table 42: Global Blockchain Supply Chain Market Revenue Million Forecast, by Country 2019 & 2032
- Table 43: United States Blockchain Supply Chain Market Revenue (Million) Forecast, by Application 2019 & 2032
- Table 44: Canada Blockchain Supply Chain Market Revenue (Million) Forecast, by Application 2019 & 2032
- Table 45: Mexico Blockchain Supply Chain Market Revenue (Million) Forecast, by Application 2019 & 2032
- Table 46: Global Blockchain Supply Chain Market Revenue Million Forecast, by Country 2019 & 2032
- Table 47: United Arab Emirates Blockchain Supply Chain Market Revenue (Million) Forecast, by Application 2019 & 2032
- Table 48: Saudi Arabia Blockchain Supply Chain Market Revenue (Million) Forecast, by Application 2019 & 2032
- Table 49: South Africa Blockchain Supply Chain Market Revenue (Million) Forecast, by Application 2019 & 2032
- Table 50: Rest of Middle East and Africa Blockchain Supply Chain Market Revenue (Million) Forecast, by Application 2019 & 2032
- Table 51: Global Blockchain Supply Chain Market Revenue Million Forecast, by Application 2019 & 2032
- Table 52: Global Blockchain Supply Chain Market Revenue Million Forecast, by Industry Vertical 2019 & 2032
- Table 53: Global Blockchain Supply Chain Market Revenue Million Forecast, by Component 2019 & 2032
- Table 54: Global Blockchain Supply Chain Market Revenue Million Forecast, by Country 2019 & 2032
- Table 55: United States Blockchain Supply Chain Market Revenue (Million) Forecast, by Application 2019 & 2032
- Table 56: Canada Blockchain Supply Chain Market Revenue (Million) Forecast, by Application 2019 & 2032
- Table 57: Global Blockchain Supply Chain Market Revenue Million Forecast, by Application 2019 & 2032
- Table 58: Global Blockchain Supply Chain Market Revenue Million Forecast, by Industry Vertical 2019 & 2032
- Table 59: Global Blockchain Supply Chain Market Revenue Million Forecast, by Component 2019 & 2032
- Table 60: Global Blockchain Supply Chain Market Revenue Million Forecast, by Country 2019 & 2032
- Table 61: Germany Blockchain Supply Chain Market Revenue (Million) Forecast, by Application 2019 & 2032
- Table 62: United Kingdom Blockchain Supply Chain Market Revenue (Million) Forecast, by Application 2019 & 2032
- Table 63: France Blockchain Supply Chain Market Revenue (Million) Forecast, by Application 2019 & 2032
- Table 64: Spain Blockchain Supply Chain Market Revenue (Million) Forecast, by Application 2019 & 2032
- Table 65: Global Blockchain Supply Chain Market Revenue Million Forecast, by Application 2019 & 2032
- Table 66: Global Blockchain Supply Chain Market Revenue Million Forecast, by Industry Vertical 2019 & 2032
- Table 67: Global Blockchain Supply Chain Market Revenue Million Forecast, by Component 2019 & 2032
- Table 68: Global Blockchain Supply Chain Market Revenue Million Forecast, by Country 2019 & 2032
- Table 69: China Blockchain Supply Chain Market Revenue (Million) Forecast, by Application 2019 & 2032
- Table 70: Japan Blockchain Supply Chain Market Revenue (Million) Forecast, by Application 2019 & 2032
- Table 71: India Blockchain Supply Chain Market Revenue (Million) Forecast, by Application 2019 & 2032
- Table 72: Australia Blockchain Supply Chain Market Revenue (Million) Forecast, by Application 2019 & 2032
- Table 73: Global Blockchain Supply Chain Market Revenue Million Forecast, by Application 2019 & 2032
- Table 74: Global Blockchain Supply Chain Market Revenue Million Forecast, by Industry Vertical 2019 & 2032
- Table 75: Global Blockchain Supply Chain Market Revenue Million Forecast, by Component 2019 & 2032
- Table 76: Global Blockchain Supply Chain Market Revenue Million Forecast, by Country 2019 & 2032
- Table 77: Brazil Blockchain Supply Chain Market Revenue (Million) Forecast, by Application 2019 & 2032
- Table 78: Mexico Blockchain Supply Chain Market Revenue (Million) Forecast, by Application 2019 & 2032
- Table 79: Argentina Blockchain Supply Chain Market Revenue (Million) Forecast, by Application 2019 & 2032
- Table 80: Global Blockchain Supply Chain Market Revenue Million Forecast, by Application 2019 & 2032
- Table 81: Global Blockchain Supply Chain Market Revenue Million Forecast, by Industry Vertical 2019 & 2032
- Table 82: Global Blockchain Supply Chain Market Revenue Million Forecast, by Component 2019 & 2032
- Table 83: Global Blockchain Supply Chain Market Revenue Million Forecast, by Country 2019 & 2032
- Table 84: United Arab Emirates Blockchain Supply Chain Market Revenue (Million) Forecast, by Application 2019 & 2032
- Table 85: Saudi Arabia Blockchain Supply Chain Market Revenue (Million) Forecast, by Application 2019 & 2032
- Table 86: South Africa Blockchain Supply Chain Market Revenue (Million) Forecast, by Application 2019 & 2032
Frequently Asked Questions
1. What is the projected Compound Annual Growth Rate (CAGR) of the Blockchain Supply Chain Market?
The projected CAGR is approximately 49.87%.
2. Which companies are prominent players in the Blockchain Supply Chain Market?
Key companies in the market include Digital Treasury Corporatio, Accenture PLC, Bitfury Group Limited, BTL Group, TIBCO Software Inc, IBM Corporation, Microsoft Corporation, Amazon Web Services Inc, Huawei Technologies Co Ltd, Oracle Corporation, VeChain Foundation, Omnichain Inc, Guardtime Inc, Auxesis Group, SAP SE.
3. What are the main segments of the Blockchain Supply Chain Market?
The market segments include Application , Industry Vertical , Component.
4. Can you provide details about the market size?
The market size is estimated to be USD 0.84 Million as of 2022.
5. What are some drivers contributing to market growth?
Augmented Demand for Improved Security of Supply Chain Transactions; Growing Requirement for Supply Chain Transparency; Rising use of Blockchain in Retail & Consumer Goods sector.
6. What are the notable trends driving market growth?
Retail & Consumer Goods to Dominate the Market.
7. Are there any restraints impacting market growth?
Absence of Awareness of the Blockchain Technology.
8. Can you provide examples of recent developments in the market?
November 2023, MY E.G. Service’s blockchain unit in Malaysia, Zetrix, made an announcement regarding the commencement of an initial project to offer supply chain bankrolling products in conjunction with Chinese banks for international importers in addition to exporters.
9. What pricing options are available for accessing the report?
Pricing options include single-user, multi-user, and enterprise licenses priced at USD 4750, USD 5250, and USD 8750 respectively.
10. Is the market size provided in terms of value or volume?
The market size is provided in terms of value, measured in Million.
11. Are there any specific market keywords associated with the report?
Yes, the market keyword associated with the report is "Blockchain Supply Chain Market," which aids in identifying and referencing the specific market segment covered.
12. How do I determine which pricing option suits my needs best?
The pricing options vary based on user requirements and access needs. Individual users may opt for single-user licenses, while businesses requiring broader access may choose multi-user or enterprise licenses for cost-effective access to the report.
13. Are there any additional resources or data provided in the Blockchain Supply Chain Market report?
While the report offers comprehensive insights, it's advisable to review the specific contents or supplementary materials provided to ascertain if additional resources or data are available.
14. How can I stay updated on further developments or reports in the Blockchain Supply Chain Market?
To stay informed about further developments, trends, and reports in the Blockchain Supply Chain Market, consider subscribing to industry newsletters, following relevant companies and organizations, or regularly checking reputable industry news sources and publications.
Methodology
Step 1 - Identification of Relevant Samples Size from Population Database


Step 2 - Approaches for Defining Global Market Size (Value, Volume* & Price*)

Note*: In applicable scenarios
Step 3 - Data Sources
Primary Research
- Web Analytics
- Survey Reports
- Research Institute
- Latest Research Reports
- Opinion Leaders
Secondary Research
- Annual Reports
- White Paper
- Latest Press Release
- Industry Association
- Paid Database
- Investor Presentations

Step 4 - Data Triangulation
Involves using different sources of information in order to increase the validity of a study
These sources are likely to be stakeholders in a program - participants, other researchers, program staff, other community members, and so on.
Then we put all data in single framework & apply various statistical tools to find out the dynamic on the market.
During the analysis stage, feedback from the stakeholder groups would be compared to determine areas of agreement as well as areas of divergence
