

Key Insights
The global biological implants market is experiencing robust growth, projected to reach a substantial size driven by several key factors. An aging global population necessitates increased joint replacements and cardiovascular interventions, fueling demand for orthopedic, cardiovascular, and dental implants. Technological advancements, such as the development of biocompatible materials and minimally invasive surgical techniques, are further enhancing market expansion. The rising prevalence of chronic diseases like osteoporosis and osteoarthritis also significantly contributes to the market's growth trajectory. Furthermore, increasing healthcare expenditure and improved healthcare infrastructure, particularly in developing economies, are creating opportunities for market expansion. While the market faces restraints such as high implant costs, potential complications associated with surgery, and regulatory hurdles, the overall trend remains positive, indicating a sustained period of growth.
The market segmentation reveals a diverse landscape. Cardiovascular implants represent a significant portion of the market due to the high prevalence of heart conditions globally. Orthopedic implants, driven by the increasing incidence of osteoarthritis and trauma cases, also constitute a large segment. Spinal implants are gaining traction with the growing number of spinal injuries and degenerative disorders. The adoption of biocompatible materials like titanium alloys and polymers is prevalent, and further innovation in material science is expected to drive market growth in the coming years. Geographically, North America and Europe currently hold a significant market share due to advanced healthcare infrastructure and high adoption rates. However, Asia Pacific is projected to witness rapid expansion owing to increasing healthcare expenditure and a rising aging population in countries like China and India. The competitive landscape is characterized by both large multinational corporations and specialized smaller companies, indicating an active and innovative market.

Biological Implants Industry: A Comprehensive Market Report (2019-2033)
This insightful report provides a detailed analysis of the Biological Implants market, projecting a market value of $XX Billion by 2033. It offers a comprehensive overview of market dynamics, key players, technological advancements, and future growth prospects, encompassing the period from 2019 to 2033. The report is crucial for stakeholders seeking to understand this rapidly evolving sector and make informed strategic decisions.
Biological Implants Industry Market Composition & Trends
The global biological implants market, valued at $XX Billion in 2024, exhibits a moderately consolidated structure. Major players like Smith & Nephew PLC, Edwards Lifesciences Corporation, and Stryker Corporation hold significant market share, driving intense competition and fostering innovation. The market is influenced by a complex interplay of factors including stringent regulatory landscapes (FDA approvals, CE markings), the emergence of biocompatible materials, and increasing demand driven by aging populations and rising incidences of chronic diseases. Substitute products, such as regenerative medicine therapies, pose a growing challenge, while strategic mergers and acquisitions (M&A) are reshaping the competitive landscape.
- Market Concentration: High, with a few dominant players controlling a substantial market share.
- Innovation Catalysts: Growing demand for minimally invasive procedures, advancements in biomaterials, and personalized medicine approaches.
- Regulatory Landscape: Stringent regulatory approvals (FDA, CE) significantly impact market entry and product lifecycle.
- Substitute Products: Regenerative medicine and other minimally invasive procedures pose a competitive threat.
- End-User Profiles: Hospitals, ambulatory surgical centers, and clinics are the primary end-users.
- M&A Activities: Significant M&A activity observed, with deal values exceeding $XX Billion in the last five years, driving consolidation and market expansion.
Biological Implants Industry Evolution
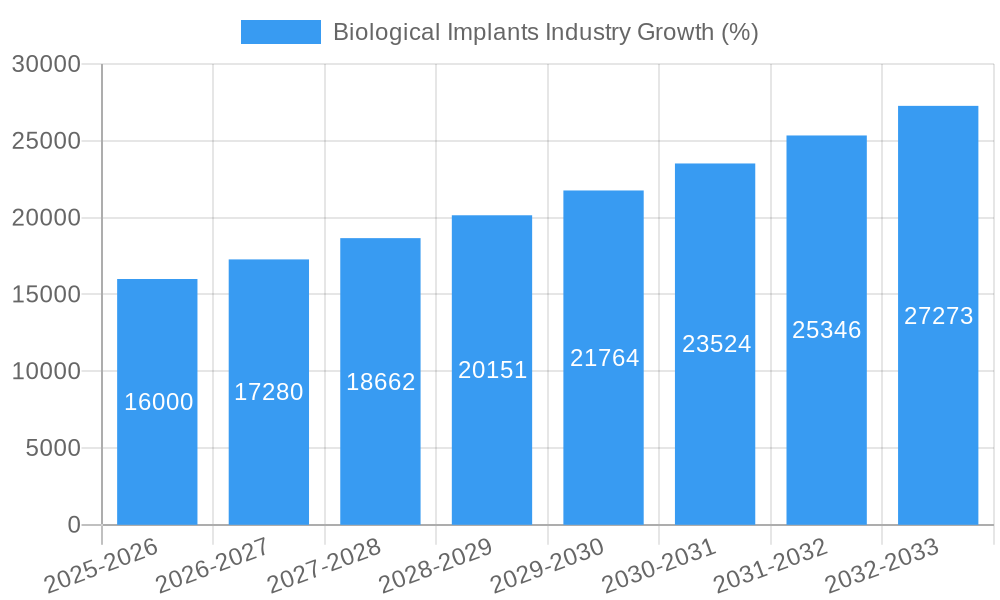
The biological implants market has witnessed robust growth over the historical period (2019-2024), driven by technological advancements, rising prevalence of chronic diseases requiring implants, and increasing healthcare expenditure globally. The market exhibited a CAGR of XX% during this period. Technological advancements, such as the development of biocompatible materials (e.g., biodegradable polymers, advanced metallic alloys) and minimally invasive surgical techniques, have significantly enhanced implant performance and patient outcomes. This has been complemented by a growing preference for technologically advanced implants with enhanced functionalities and improved durability. Simultaneously, shifting consumer demands toward personalized medicine and improved post-operative care have driven further innovation and market expansion. The forecast period (2025-2033) is expected to see continued growth, driven by an aging global population and increased demand for advanced implants in developing economies. A projected CAGR of XX% is anticipated during this timeframe. This growth will be supported by increased investment in R&D, the emergence of innovative implant designs, and expanding access to healthcare across the globe. The market is expected to reach $XX Billion by 2033.
Leading Regions, Countries, or Segments in Biological Implants Industry
The North American market currently dominates the global biological implants market, driven by high healthcare expenditure, advanced healthcare infrastructure, and a large patient pool. However, the Asia-Pacific region is poised for significant growth due to increasing healthcare awareness, rising disposable incomes, and a burgeoning elderly population. Within the segment breakdown:
- By Type of Bio-implants: Orthopedic implants currently hold the largest market share, followed by cardiovascular and dental implants. Growth in orthopedic implants is fuelled by the high incidence of musculoskeletal disorders and trauma. Cardiovascular implants are driven by the increasing prevalence of heart diseases.
- By Material: Biomaterial metals and alloys currently dominate, owing to their strength and durability. However, polymers are gaining traction due to their biocompatibility and enhanced functionalities.
Key Drivers:
- High Healthcare Expenditure: North America and Western Europe are characterized by high per capita healthcare spending, fueling demand for advanced implants.
- Technological Advancements: Continuous innovation in biomaterials and implant designs drives market growth.
- Government Initiatives and Regulatory Support: Favorable regulatory frameworks in key regions facilitate market expansion.
- Growing Prevalence of Chronic Diseases: The rising incidence of orthopedic disorders, cardiovascular diseases, and dental problems boosts demand for implants.
- Rising Disposable Incomes: In developing economies, rising disposable incomes enhance access to healthcare services, increasing demand for implants.
Biological Implants Industry Product Innovations
Recent years have witnessed significant product innovations, including the development of bioresorbable implants, smart implants with embedded sensors, and 3D-printed implants offering customized solutions for patients. These innovations enhance implant performance, reduce complications, and improve patient outcomes. Unique selling propositions (USPs) include minimized invasiveness, enhanced biocompatibility, and improved integration with surrounding tissues. The integration of smart technologies allows for remote monitoring and personalized treatment strategies. These advancements drive market growth by improving patient care and enabling efficient treatment methods.
Propelling Factors for Biological Implants Industry Growth
Technological advancements, particularly in biomaterials and minimally invasive surgical techniques, are major growth drivers. The aging global population and the rising prevalence of chronic diseases significantly increase the demand for biological implants. Furthermore, supportive government regulations and increasing healthcare investments in both developed and developing countries fuel market expansion.
Obstacles in the Biological Implants Industry Market
Stringent regulatory requirements, high research and development costs, and the potential for complications and rejection after implant surgeries pose significant challenges. Supply chain disruptions and intense competition among established players create further hurdles for market growth. The high cost of implants also presents a major barrier to wider accessibility, particularly in low- and middle-income countries.
Future Opportunities in Biological Implants Industry
Emerging markets in Asia and Africa, the development of personalized implants using 3D printing, and the incorporation of smart technologies offer lucrative opportunities. Growing demand for minimally invasive procedures and the integration of artificial intelligence for improved diagnosis and treatment planning open further avenues for growth. The development of biocompatible and biodegradable materials will continue to play a significant role in shaping the future of the biological implants industry.
Major Players in the Biological Implants Industry Ecosystem
- Smith & Nephew PLC
- Edwards Lifesciences Corporation
- LifeNet Health
- Endo International Plc
- Abbott Laboratories
- Bausch & Lomb Incorporated
- MiMeDX
- Stryker Corporation
- BIOTRONIK Inc
- Boston Scientific Corporation
- Zimmer Biomet
- aap Implantate AG
Key Developments in Biological Implants Industry Industry
- June 2022: ZimVie launched the FDA-cleared T3 pro tampered implant and Encode emergence Healing Abutment in the United States, expanding its product portfolio and market reach.
- April 2022: The Orthopaedic Implant Company received FDA clearance and launched the high-valve dorsal scanning plate, strengthening its position in the orthopedic trauma market.
Strategic Biological Implants Industry Market Forecast
The biological implants market is poised for continued robust growth, driven by technological innovations, an aging population, and increasing healthcare expenditure. The market’s future potential is substantial, with significant growth projected in emerging markets and through the adoption of advanced implant technologies, leading to improved patient outcomes and market expansion. This positive outlook underscores the immense potential and ongoing evolution within the biological implants sector.
Biological Implants Industry Segmentation
-
1. Type of Bio-implants
- 1.1. Cardiovascular Implants
- 1.2. Spinal implants
- 1.3. Orthopedic Implants
- 1.4. Dental Implants
- 1.5. Ophthalmic Implants
- 1.6. Other Implants
-
2. Material
- 2.1. Biomaterial Metal and Alloys
- 2.2. Polymers
- 2.3. Other Materials
Biological Implants Industry Segmentation By Geography
-
1. North America
- 1.1. United States
- 1.2. Canada
- 1.3. Mexico
-
2. Europe
- 2.1. Germany
- 2.2. United Kingdom
- 2.3. France
- 2.4. Italy
- 2.5. Spain
- 2.6. Rest of Europe
-
3. Asia Pacific
- 3.1. China
- 3.2. Japan
- 3.3. India
- 3.4. Australia
- 3.5. South Korea
- 3.6. Rest of Asia Pacific
-
4. Middle East and Africa
- 4.1. GCC
- 4.2. South Africa
- 4.3. Rest of Middle East and Africa
-
5. South America
- 5.1. Brazil
- 5.2. Argentina
- 5.3. Rest of South America

Biological Implants Industry REPORT HIGHLIGHTS
| Aspects | Details |
|---|---|
| Study Period | 2019-2033 |
| Base Year | 2024 |
| Estimated Year | 2025 |
| Forecast Period | 2025-2033 |
| Historical Period | 2019-2024 |
| Growth Rate | CAGR of 8.00% from 2019-2033 |
| Segmentation |
|
Table of Contents
- 1. Introduction
- 1.1. Research Scope
- 1.2. Market Segmentation
- 1.3. Research Methodology
- 1.4. Definitions and Assumptions
- 2. Executive Summary
- 2.1. Introduction
- 3. Market Dynamics
- 3.1. Introduction
- 3.2. Market Drivers
- 3.2.1. Increasing Burden of Chronic Diseases and Lifestyle Disorders; Rising Preference toward Minimally Invasive Surgeries
- 3.3. Market Restrains
- 3.3.1. High Cost of Bio-implants; Unfavorable Reimbursement Policies
- 3.4. Market Trends
- 3.4.1. Cardiovascular Implants Segment is Expected to Hold the Large Share in the Bio-Implant Market Over the Forecast Period.
- 4. Market Factor Analysis
- 4.1. Porters Five Forces
- 4.2. Supply/Value Chain
- 4.3. PESTEL analysis
- 4.4. Market Entropy
- 4.5. Patent/Trademark Analysis
- 5. Global Biological Implants Industry Analysis, Insights and Forecast, 2019-2031
- 5.1. Market Analysis, Insights and Forecast - by Type of Bio-implants
- 5.1.1. Cardiovascular Implants
- 5.1.2. Spinal implants
- 5.1.3. Orthopedic Implants
- 5.1.4. Dental Implants
- 5.1.5. Ophthalmic Implants
- 5.1.6. Other Implants
- 5.2. Market Analysis, Insights and Forecast - by Material
- 5.2.1. Biomaterial Metal and Alloys
- 5.2.2. Polymers
- 5.2.3. Other Materials
- 5.3. Market Analysis, Insights and Forecast - by Region
- 5.3.1. North America
- 5.3.2. Europe
- 5.3.3. Asia Pacific
- 5.3.4. Middle East and Africa
- 5.3.5. South America
- 5.1. Market Analysis, Insights and Forecast - by Type of Bio-implants
- 6. North America Biological Implants Industry Analysis, Insights and Forecast, 2019-2031
- 6.1. Market Analysis, Insights and Forecast - by Type of Bio-implants
- 6.1.1. Cardiovascular Implants
- 6.1.2. Spinal implants
- 6.1.3. Orthopedic Implants
- 6.1.4. Dental Implants
- 6.1.5. Ophthalmic Implants
- 6.1.6. Other Implants
- 6.2. Market Analysis, Insights and Forecast - by Material
- 6.2.1. Biomaterial Metal and Alloys
- 6.2.2. Polymers
- 6.2.3. Other Materials
- 6.1. Market Analysis, Insights and Forecast - by Type of Bio-implants
- 7. Europe Biological Implants Industry Analysis, Insights and Forecast, 2019-2031
- 7.1. Market Analysis, Insights and Forecast - by Type of Bio-implants
- 7.1.1. Cardiovascular Implants
- 7.1.2. Spinal implants
- 7.1.3. Orthopedic Implants
- 7.1.4. Dental Implants
- 7.1.5. Ophthalmic Implants
- 7.1.6. Other Implants
- 7.2. Market Analysis, Insights and Forecast - by Material
- 7.2.1. Biomaterial Metal and Alloys
- 7.2.2. Polymers
- 7.2.3. Other Materials
- 7.1. Market Analysis, Insights and Forecast - by Type of Bio-implants
- 8. Asia Pacific Biological Implants Industry Analysis, Insights and Forecast, 2019-2031
- 8.1. Market Analysis, Insights and Forecast - by Type of Bio-implants
- 8.1.1. Cardiovascular Implants
- 8.1.2. Spinal implants
- 8.1.3. Orthopedic Implants
- 8.1.4. Dental Implants
- 8.1.5. Ophthalmic Implants
- 8.1.6. Other Implants
- 8.2. Market Analysis, Insights and Forecast - by Material
- 8.2.1. Biomaterial Metal and Alloys
- 8.2.2. Polymers
- 8.2.3. Other Materials
- 8.1. Market Analysis, Insights and Forecast - by Type of Bio-implants
- 9. Middle East and Africa Biological Implants Industry Analysis, Insights and Forecast, 2019-2031
- 9.1. Market Analysis, Insights and Forecast - by Type of Bio-implants
- 9.1.1. Cardiovascular Implants
- 9.1.2. Spinal implants
- 9.1.3. Orthopedic Implants
- 9.1.4. Dental Implants
- 9.1.5. Ophthalmic Implants
- 9.1.6. Other Implants
- 9.2. Market Analysis, Insights and Forecast - by Material
- 9.2.1. Biomaterial Metal and Alloys
- 9.2.2. Polymers
- 9.2.3. Other Materials
- 9.1. Market Analysis, Insights and Forecast - by Type of Bio-implants
- 10. South America Biological Implants Industry Analysis, Insights and Forecast, 2019-2031
- 10.1. Market Analysis, Insights and Forecast - by Type of Bio-implants
- 10.1.1. Cardiovascular Implants
- 10.1.2. Spinal implants
- 10.1.3. Orthopedic Implants
- 10.1.4. Dental Implants
- 10.1.5. Ophthalmic Implants
- 10.1.6. Other Implants
- 10.2. Market Analysis, Insights and Forecast - by Material
- 10.2.1. Biomaterial Metal and Alloys
- 10.2.2. Polymers
- 10.2.3. Other Materials
- 10.1. Market Analysis, Insights and Forecast - by Type of Bio-implants
- 11. North Americ Biological Implants Industry Analysis, Insights and Forecast, 2019-2031
- 11.1. Market Analysis, Insights and Forecast - By Country/Sub-region
- 11.1.1 United States
- 11.1.2 Canada
- 11.1.3 Mexico
- 12. South America Biological Implants Industry Analysis, Insights and Forecast, 2019-2031
- 12.1. Market Analysis, Insights and Forecast - By Country/Sub-region
- 12.1.1 Brazil
- 12.1.2 Mexico
- 12.1.3 Rest of South America
- 13. Europe Biological Implants Industry Analysis, Insights and Forecast, 2019-2031
- 13.1. Market Analysis, Insights and Forecast - By Country/Sub-region
- 13.1.1 Germany
- 13.1.2 United Kingdom
- 13.1.3 France
- 13.1.4 Italy
- 13.1.5 Spain
- 13.1.6 Rest of Europe
- 14. Asia Pacific Biological Implants Industry Analysis, Insights and Forecast, 2019-2031
- 14.1. Market Analysis, Insights and Forecast - By Country/Sub-region
- 14.1.1 China
- 14.1.2 Japan
- 14.1.3 India
- 14.1.4 South Korea
- 14.1.5 Taiwan
- 14.1.6 Australia
- 14.1.7 Rest of Asia-Pacific
- 15. MEA Biological Implants Industry Analysis, Insights and Forecast, 2019-2031
- 15.1. Market Analysis, Insights and Forecast - By Country/Sub-region
- 15.1.1 Middle East
- 15.1.2 Africa
- 16. Competitive Analysis
- 16.1. Global Market Share Analysis 2024
- 16.2. Company Profiles
- 16.2.1 Smith & Nephew PLC
- 16.2.1.1. Overview
- 16.2.1.2. Products
- 16.2.1.3. SWOT Analysis
- 16.2.1.4. Recent Developments
- 16.2.1.5. Financials (Based on Availability)
- 16.2.2 Edwards Lifesciences Corporation
- 16.2.2.1. Overview
- 16.2.2.2. Products
- 16.2.2.3. SWOT Analysis
- 16.2.2.4. Recent Developments
- 16.2.2.5. Financials (Based on Availability)
- 16.2.3 LifeNet Health
- 16.2.3.1. Overview
- 16.2.3.2. Products
- 16.2.3.3. SWOT Analysis
- 16.2.3.4. Recent Developments
- 16.2.3.5. Financials (Based on Availability)
- 16.2.4 Endo International Plc*List Not Exhaustive
- 16.2.4.1. Overview
- 16.2.4.2. Products
- 16.2.4.3. SWOT Analysis
- 16.2.4.4. Recent Developments
- 16.2.4.5. Financials (Based on Availability)
- 16.2.5 Abbott Laboratories
- 16.2.5.1. Overview
- 16.2.5.2. Products
- 16.2.5.3. SWOT Analysis
- 16.2.5.4. Recent Developments
- 16.2.5.5. Financials (Based on Availability)
- 16.2.6 Bausch & Lomb Incorporated
- 16.2.6.1. Overview
- 16.2.6.2. Products
- 16.2.6.3. SWOT Analysis
- 16.2.6.4. Recent Developments
- 16.2.6.5. Financials (Based on Availability)
- 16.2.7 MiMeDX
- 16.2.7.1. Overview
- 16.2.7.2. Products
- 16.2.7.3. SWOT Analysis
- 16.2.7.4. Recent Developments
- 16.2.7.5. Financials (Based on Availability)
- 16.2.8 Stryker Corporation
- 16.2.8.1. Overview
- 16.2.8.2. Products
- 16.2.8.3. SWOT Analysis
- 16.2.8.4. Recent Developments
- 16.2.8.5. Financials (Based on Availability)
- 16.2.9 BIOTRONIK Inc
- 16.2.9.1. Overview
- 16.2.9.2. Products
- 16.2.9.3. SWOT Analysis
- 16.2.9.4. Recent Developments
- 16.2.9.5. Financials (Based on Availability)
- 16.2.10 Boston Scientific Corporation
- 16.2.10.1. Overview
- 16.2.10.2. Products
- 16.2.10.3. SWOT Analysis
- 16.2.10.4. Recent Developments
- 16.2.10.5. Financials (Based on Availability)
- 16.2.11 Zimmer Biomet
- 16.2.11.1. Overview
- 16.2.11.2. Products
- 16.2.11.3. SWOT Analysis
- 16.2.11.4. Recent Developments
- 16.2.11.5. Financials (Based on Availability)
- 16.2.12 aap Implantate AG
- 16.2.12.1. Overview
- 16.2.12.2. Products
- 16.2.12.3. SWOT Analysis
- 16.2.12.4. Recent Developments
- 16.2.12.5. Financials (Based on Availability)
- 16.2.1 Smith & Nephew PLC
List of Figures
- Figure 1: Global Biological Implants Industry Revenue Breakdown (Billion, %) by Region 2024 & 2032
- Figure 2: North Americ Biological Implants Industry Revenue (Billion), by Country 2024 & 2032
- Figure 3: North Americ Biological Implants Industry Revenue Share (%), by Country 2024 & 2032
- Figure 4: South America Biological Implants Industry Revenue (Billion), by Country 2024 & 2032
- Figure 5: South America Biological Implants Industry Revenue Share (%), by Country 2024 & 2032
- Figure 6: Europe Biological Implants Industry Revenue (Billion), by Country 2024 & 2032
- Figure 7: Europe Biological Implants Industry Revenue Share (%), by Country 2024 & 2032
- Figure 8: Asia Pacific Biological Implants Industry Revenue (Billion), by Country 2024 & 2032
- Figure 9: Asia Pacific Biological Implants Industry Revenue Share (%), by Country 2024 & 2032
- Figure 10: MEA Biological Implants Industry Revenue (Billion), by Country 2024 & 2032
- Figure 11: MEA Biological Implants Industry Revenue Share (%), by Country 2024 & 2032
- Figure 12: North America Biological Implants Industry Revenue (Billion), by Type of Bio-implants 2024 & 2032
- Figure 13: North America Biological Implants Industry Revenue Share (%), by Type of Bio-implants 2024 & 2032
- Figure 14: North America Biological Implants Industry Revenue (Billion), by Material 2024 & 2032
- Figure 15: North America Biological Implants Industry Revenue Share (%), by Material 2024 & 2032
- Figure 16: North America Biological Implants Industry Revenue (Billion), by Country 2024 & 2032
- Figure 17: North America Biological Implants Industry Revenue Share (%), by Country 2024 & 2032
- Figure 18: Europe Biological Implants Industry Revenue (Billion), by Type of Bio-implants 2024 & 2032
- Figure 19: Europe Biological Implants Industry Revenue Share (%), by Type of Bio-implants 2024 & 2032
- Figure 20: Europe Biological Implants Industry Revenue (Billion), by Material 2024 & 2032
- Figure 21: Europe Biological Implants Industry Revenue Share (%), by Material 2024 & 2032
- Figure 22: Europe Biological Implants Industry Revenue (Billion), by Country 2024 & 2032
- Figure 23: Europe Biological Implants Industry Revenue Share (%), by Country 2024 & 2032
- Figure 24: Asia Pacific Biological Implants Industry Revenue (Billion), by Type of Bio-implants 2024 & 2032
- Figure 25: Asia Pacific Biological Implants Industry Revenue Share (%), by Type of Bio-implants 2024 & 2032
- Figure 26: Asia Pacific Biological Implants Industry Revenue (Billion), by Material 2024 & 2032
- Figure 27: Asia Pacific Biological Implants Industry Revenue Share (%), by Material 2024 & 2032
- Figure 28: Asia Pacific Biological Implants Industry Revenue (Billion), by Country 2024 & 2032
- Figure 29: Asia Pacific Biological Implants Industry Revenue Share (%), by Country 2024 & 2032
- Figure 30: Middle East and Africa Biological Implants Industry Revenue (Billion), by Type of Bio-implants 2024 & 2032
- Figure 31: Middle East and Africa Biological Implants Industry Revenue Share (%), by Type of Bio-implants 2024 & 2032
- Figure 32: Middle East and Africa Biological Implants Industry Revenue (Billion), by Material 2024 & 2032
- Figure 33: Middle East and Africa Biological Implants Industry Revenue Share (%), by Material 2024 & 2032
- Figure 34: Middle East and Africa Biological Implants Industry Revenue (Billion), by Country 2024 & 2032
- Figure 35: Middle East and Africa Biological Implants Industry Revenue Share (%), by Country 2024 & 2032
- Figure 36: South America Biological Implants Industry Revenue (Billion), by Type of Bio-implants 2024 & 2032
- Figure 37: South America Biological Implants Industry Revenue Share (%), by Type of Bio-implants 2024 & 2032
- Figure 38: South America Biological Implants Industry Revenue (Billion), by Material 2024 & 2032
- Figure 39: South America Biological Implants Industry Revenue Share (%), by Material 2024 & 2032
- Figure 40: South America Biological Implants Industry Revenue (Billion), by Country 2024 & 2032
- Figure 41: South America Biological Implants Industry Revenue Share (%), by Country 2024 & 2032
List of Tables
- Table 1: Global Biological Implants Industry Revenue Billion Forecast, by Region 2019 & 2032
- Table 2: Global Biological Implants Industry Revenue Billion Forecast, by Type of Bio-implants 2019 & 2032
- Table 3: Global Biological Implants Industry Revenue Billion Forecast, by Material 2019 & 2032
- Table 4: Global Biological Implants Industry Revenue Billion Forecast, by Region 2019 & 2032
- Table 5: Global Biological Implants Industry Revenue Billion Forecast, by Country 2019 & 2032
- Table 6: United States Biological Implants Industry Revenue (Billion) Forecast, by Application 2019 & 2032
- Table 7: Canada Biological Implants Industry Revenue (Billion) Forecast, by Application 2019 & 2032
- Table 8: Mexico Biological Implants Industry Revenue (Billion) Forecast, by Application 2019 & 2032
- Table 9: Global Biological Implants Industry Revenue Billion Forecast, by Country 2019 & 2032
- Table 10: Brazil Biological Implants Industry Revenue (Billion) Forecast, by Application 2019 & 2032
- Table 11: Mexico Biological Implants Industry Revenue (Billion) Forecast, by Application 2019 & 2032
- Table 12: Rest of South America Biological Implants Industry Revenue (Billion) Forecast, by Application 2019 & 2032
- Table 13: Global Biological Implants Industry Revenue Billion Forecast, by Country 2019 & 2032
- Table 14: Germany Biological Implants Industry Revenue (Billion) Forecast, by Application 2019 & 2032
- Table 15: United Kingdom Biological Implants Industry Revenue (Billion) Forecast, by Application 2019 & 2032
- Table 16: France Biological Implants Industry Revenue (Billion) Forecast, by Application 2019 & 2032
- Table 17: Italy Biological Implants Industry Revenue (Billion) Forecast, by Application 2019 & 2032
- Table 18: Spain Biological Implants Industry Revenue (Billion) Forecast, by Application 2019 & 2032
- Table 19: Rest of Europe Biological Implants Industry Revenue (Billion) Forecast, by Application 2019 & 2032
- Table 20: Global Biological Implants Industry Revenue Billion Forecast, by Country 2019 & 2032
- Table 21: China Biological Implants Industry Revenue (Billion) Forecast, by Application 2019 & 2032
- Table 22: Japan Biological Implants Industry Revenue (Billion) Forecast, by Application 2019 & 2032
- Table 23: India Biological Implants Industry Revenue (Billion) Forecast, by Application 2019 & 2032
- Table 24: South Korea Biological Implants Industry Revenue (Billion) Forecast, by Application 2019 & 2032
- Table 25: Taiwan Biological Implants Industry Revenue (Billion) Forecast, by Application 2019 & 2032
- Table 26: Australia Biological Implants Industry Revenue (Billion) Forecast, by Application 2019 & 2032
- Table 27: Rest of Asia-Pacific Biological Implants Industry Revenue (Billion) Forecast, by Application 2019 & 2032
- Table 28: Global Biological Implants Industry Revenue Billion Forecast, by Country 2019 & 2032
- Table 29: Middle East Biological Implants Industry Revenue (Billion) Forecast, by Application 2019 & 2032
- Table 30: Africa Biological Implants Industry Revenue (Billion) Forecast, by Application 2019 & 2032
- Table 31: Global Biological Implants Industry Revenue Billion Forecast, by Type of Bio-implants 2019 & 2032
- Table 32: Global Biological Implants Industry Revenue Billion Forecast, by Material 2019 & 2032
- Table 33: Global Biological Implants Industry Revenue Billion Forecast, by Country 2019 & 2032
- Table 34: United States Biological Implants Industry Revenue (Billion) Forecast, by Application 2019 & 2032
- Table 35: Canada Biological Implants Industry Revenue (Billion) Forecast, by Application 2019 & 2032
- Table 36: Mexico Biological Implants Industry Revenue (Billion) Forecast, by Application 2019 & 2032
- Table 37: Global Biological Implants Industry Revenue Billion Forecast, by Type of Bio-implants 2019 & 2032
- Table 38: Global Biological Implants Industry Revenue Billion Forecast, by Material 2019 & 2032
- Table 39: Global Biological Implants Industry Revenue Billion Forecast, by Country 2019 & 2032
- Table 40: Germany Biological Implants Industry Revenue (Billion) Forecast, by Application 2019 & 2032
- Table 41: United Kingdom Biological Implants Industry Revenue (Billion) Forecast, by Application 2019 & 2032
- Table 42: France Biological Implants Industry Revenue (Billion) Forecast, by Application 2019 & 2032
- Table 43: Italy Biological Implants Industry Revenue (Billion) Forecast, by Application 2019 & 2032
- Table 44: Spain Biological Implants Industry Revenue (Billion) Forecast, by Application 2019 & 2032
- Table 45: Rest of Europe Biological Implants Industry Revenue (Billion) Forecast, by Application 2019 & 2032
- Table 46: Global Biological Implants Industry Revenue Billion Forecast, by Type of Bio-implants 2019 & 2032
- Table 47: Global Biological Implants Industry Revenue Billion Forecast, by Material 2019 & 2032
- Table 48: Global Biological Implants Industry Revenue Billion Forecast, by Country 2019 & 2032
- Table 49: China Biological Implants Industry Revenue (Billion) Forecast, by Application 2019 & 2032
- Table 50: Japan Biological Implants Industry Revenue (Billion) Forecast, by Application 2019 & 2032
- Table 51: India Biological Implants Industry Revenue (Billion) Forecast, by Application 2019 & 2032
- Table 52: Australia Biological Implants Industry Revenue (Billion) Forecast, by Application 2019 & 2032
- Table 53: South Korea Biological Implants Industry Revenue (Billion) Forecast, by Application 2019 & 2032
- Table 54: Rest of Asia Pacific Biological Implants Industry Revenue (Billion) Forecast, by Application 2019 & 2032
- Table 55: Global Biological Implants Industry Revenue Billion Forecast, by Type of Bio-implants 2019 & 2032
- Table 56: Global Biological Implants Industry Revenue Billion Forecast, by Material 2019 & 2032
- Table 57: Global Biological Implants Industry Revenue Billion Forecast, by Country 2019 & 2032
- Table 58: GCC Biological Implants Industry Revenue (Billion) Forecast, by Application 2019 & 2032
- Table 59: South Africa Biological Implants Industry Revenue (Billion) Forecast, by Application 2019 & 2032
- Table 60: Rest of Middle East and Africa Biological Implants Industry Revenue (Billion) Forecast, by Application 2019 & 2032
- Table 61: Global Biological Implants Industry Revenue Billion Forecast, by Type of Bio-implants 2019 & 2032
- Table 62: Global Biological Implants Industry Revenue Billion Forecast, by Material 2019 & 2032
- Table 63: Global Biological Implants Industry Revenue Billion Forecast, by Country 2019 & 2032
- Table 64: Brazil Biological Implants Industry Revenue (Billion) Forecast, by Application 2019 & 2032
- Table 65: Argentina Biological Implants Industry Revenue (Billion) Forecast, by Application 2019 & 2032
- Table 66: Rest of South America Biological Implants Industry Revenue (Billion) Forecast, by Application 2019 & 2032
Frequently Asked Questions
1. What is the projected Compound Annual Growth Rate (CAGR) of the Biological Implants Industry?
The projected CAGR is approximately 8.00%.
2. Which companies are prominent players in the Biological Implants Industry?
Key companies in the market include Smith & Nephew PLC, Edwards Lifesciences Corporation, LifeNet Health, Endo International Plc*List Not Exhaustive, Abbott Laboratories, Bausch & Lomb Incorporated, MiMeDX, Stryker Corporation, BIOTRONIK Inc, Boston Scientific Corporation, Zimmer Biomet, aap Implantate AG.
3. What are the main segments of the Biological Implants Industry?
The market segments include Type of Bio-implants, Material.
4. Can you provide details about the market size?
The market size is estimated to be USD XX Billion as of 2022.
5. What are some drivers contributing to market growth?
Increasing Burden of Chronic Diseases and Lifestyle Disorders; Rising Preference toward Minimally Invasive Surgeries.
6. What are the notable trends driving market growth?
Cardiovascular Implants Segment is Expected to Hold the Large Share in the Bio-Implant Market Over the Forecast Period..
7. Are there any restraints impacting market growth?
High Cost of Bio-implants; Unfavorable Reimbursement Policies.
8. Can you provide examples of recent developments in the market?
June 2022: ZimVie launched the Food and Drug Administration cleared T3 pro tampered implant and Encode emergence Healing Abutment in the United States.
9. What pricing options are available for accessing the report?
Pricing options include single-user, multi-user, and enterprise licenses priced at USD 4750, USD 5250, and USD 8750 respectively.
10. Is the market size provided in terms of value or volume?
The market size is provided in terms of value, measured in Billion.
11. Are there any specific market keywords associated with the report?
Yes, the market keyword associated with the report is "Biological Implants Industry," which aids in identifying and referencing the specific market segment covered.
12. How do I determine which pricing option suits my needs best?
The pricing options vary based on user requirements and access needs. Individual users may opt for single-user licenses, while businesses requiring broader access may choose multi-user or enterprise licenses for cost-effective access to the report.
13. Are there any additional resources or data provided in the Biological Implants Industry report?
While the report offers comprehensive insights, it's advisable to review the specific contents or supplementary materials provided to ascertain if additional resources or data are available.
14. How can I stay updated on further developments or reports in the Biological Implants Industry?
To stay informed about further developments, trends, and reports in the Biological Implants Industry, consider subscribing to industry newsletters, following relevant companies and organizations, or regularly checking reputable industry news sources and publications.
Methodology
Step 1 - Identification of Relevant Samples Size from Population Database


Step 2 - Approaches for Defining Global Market Size (Value, Volume* & Price*)

Note*: In applicable scenarios
Step 3 - Data Sources
Primary Research
- Web Analytics
- Survey Reports
- Research Institute
- Latest Research Reports
- Opinion Leaders
Secondary Research
- Annual Reports
- White Paper
- Latest Press Release
- Industry Association
- Paid Database
- Investor Presentations

Step 4 - Data Triangulation
Involves using different sources of information in order to increase the validity of a study
These sources are likely to be stakeholders in a program - participants, other researchers, program staff, other community members, and so on.
Then we put all data in single framework & apply various statistical tools to find out the dynamic on the market.
During the analysis stage, feedback from the stakeholder groups would be compared to determine areas of agreement as well as areas of divergence
