

Key Insights
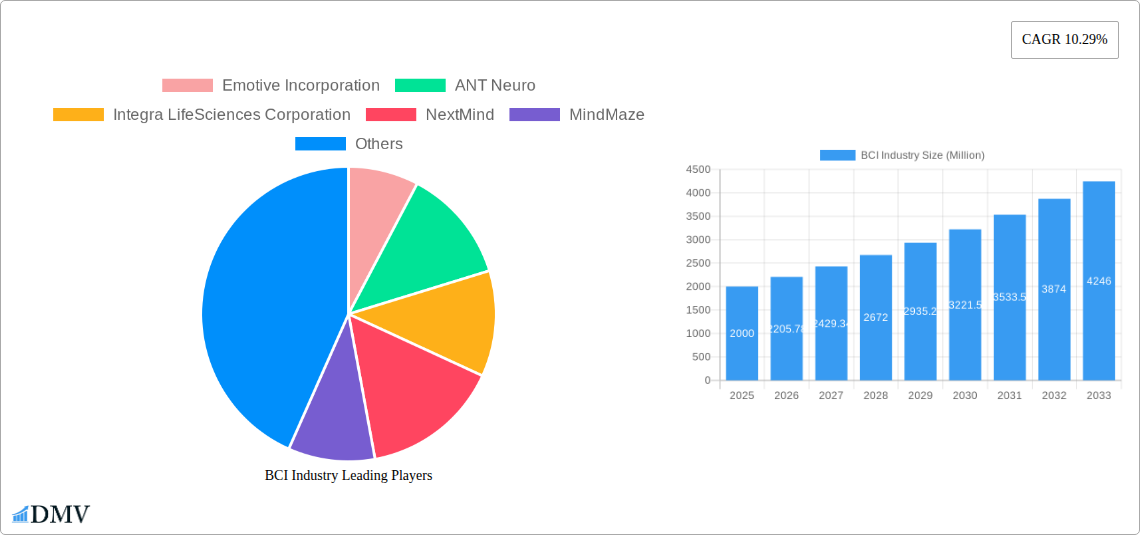
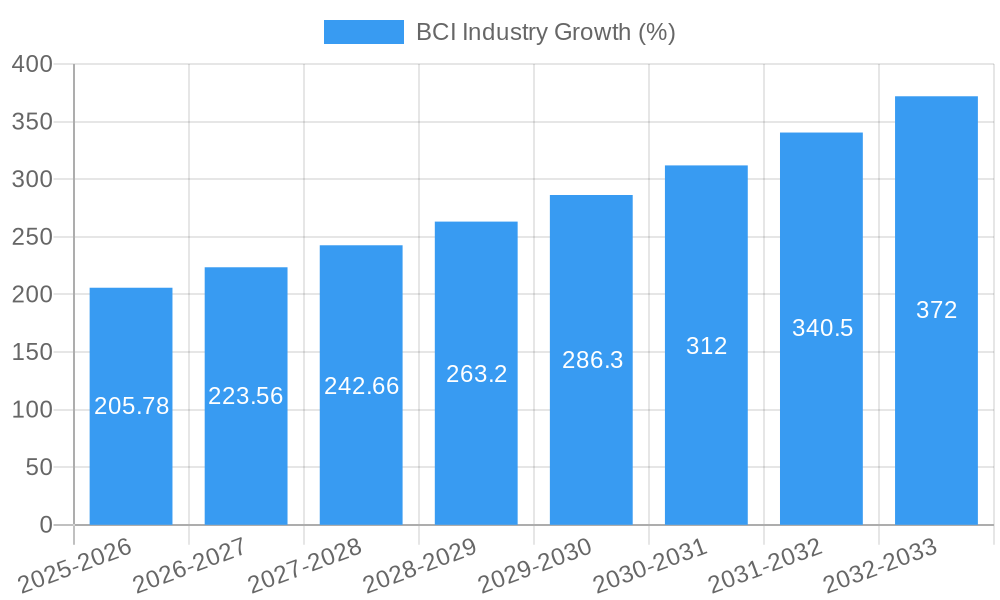
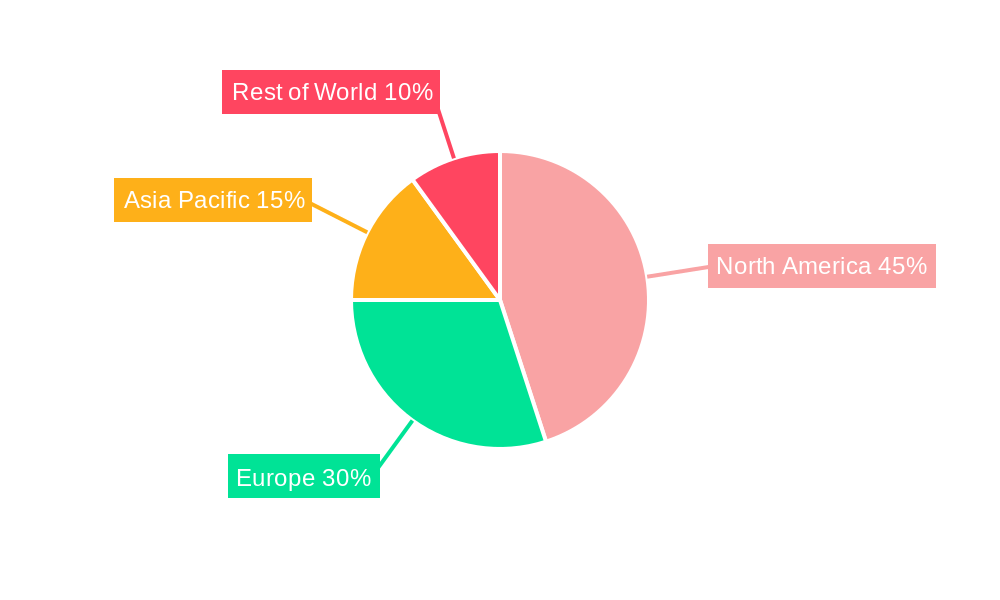
The Brain-Computer Interface (BCI) market is experiencing significant growth, projected to reach $2.0 billion in 2025 and exhibiting a Compound Annual Growth Rate (CAGR) of 10.29% from 2025 to 2033. This expansion is driven by several key factors. Firstly, advancements in neurotechnology are leading to the development of more sophisticated and user-friendly BCIs, making them accessible to a wider range of applications. Secondly, the increasing prevalence of neurological disorders and disabilities, such as paralysis and Alzheimer's disease, is creating a significant demand for innovative therapeutic solutions that BCIs offer. Furthermore, rising investments in research and development, coupled with growing collaborations between technology companies, research institutions, and healthcare providers, are fueling market growth. The non-invasive BCI segment is expected to dominate the market due to its ease of use and reduced invasiveness compared to its invasive counterpart. Applications in restoration of disabilities, particularly in the field of motor rehabilitation, are currently leading the market, with significant potential for expansion into brain function repair and other areas as technology matures. Geographical distribution shows a strong presence in North America and Europe initially, owing to advanced healthcare infrastructure and robust regulatory frameworks, followed by increasing adoption in Asia Pacific driven by growing healthcare expenditure and technological advancements.
The competitive landscape is characterized by a mix of established medical device companies and emerging technology startups. Companies like Medtronic, Integra LifeSciences, and Natus Medical contribute their expertise in medical device manufacturing and distribution, while innovative companies such as Emotiv and NextMind are pushing the boundaries of BCI technology and applications. The market's future hinges on addressing challenges such as the high cost of BCIs, ensuring data security and privacy concerns related to brain data, and overcoming technological limitations in achieving seamless integration with the human nervous system. Continued investment in research and development, focusing on improving accuracy, reliability, and affordability of BCIs, will be critical in unlocking the full potential of this transformative technology. Strategic partnerships and regulatory approvals will also play a vital role in expanding market access and fostering widespread adoption of BCI technologies.
Brain-Computer Interface (BCI) Industry Market Report: 2019-2033
This comprehensive report provides an in-depth analysis of the Brain-Computer Interface (BCI) industry, projecting a market value exceeding $XX Million by 2033. The study covers the historical period (2019-2024), the base year (2025), and forecasts to 2033, offering invaluable insights for stakeholders navigating this rapidly evolving field. The report meticulously examines market segmentation (by type and application), key players, technological advancements, and growth drivers, equipping readers with a strategic understanding of this transformative industry.
BCI Industry Market Composition & Trends
This section evaluates the competitive landscape, innovation drivers, regulatory hurdles, and market dynamics within the BCI industry. The global BCI market, currently valued at $XX Million (2025), demonstrates a [Growth Rate]% Compound Annual Growth Rate (CAGR) from 2025 to 2033. Market concentration is relatively [High/Medium/Low], with key players holding significant shares. The landscape is characterized by both significant mergers and acquisitions (M&A) activity and a robust pipeline of innovative products. Over the historical period (2019-2024), M&A activity totalled approximately $XX Million in deal value, with the largest deal being [Mention Deal and Value if available, otherwise use "xx"].
- Market Share Distribution (2025): [Insert estimated market share distribution among top 5 players if available, otherwise use placeholder data. Example: Company A - 20%, Company B - 15%, Company C - 12%, Company D - 10%, Company E - 8%]
- Innovation Catalysts: Advancements in neurotechnology, machine learning, and miniaturization are driving innovation.
- Regulatory Landscape: Varying regulatory frameworks across regions present both opportunities and challenges. [mention specific examples or challenges in major regions if available].
- Substitute Products: While BCI technology is unique, certain applications face competition from alternative assistive technologies.
- End-User Profiles: Key end-users include patients with neurological disorders, researchers, and the military.
- M&A Activities: Consolidation is expected to increase, driven by the need for technological expertise and market expansion.
BCI Industry Evolution
The BCI market has witnessed transformative growth, driven by technological breakthroughs and increased consumer awareness. The historical period (2019-2024) showed a steady growth trajectory, with adoption rates increasing significantly in specific applications like [mention specific application with quantifiable data if available]. The forecast period (2025-2033) projects continued expansion, with a projected market size exceeding $XX Million. This growth is fuelled by advancements in [mention specific technological advancements, for example: high-resolution sensors, advanced signal processing algorithms, and improved biocompatibility].
Technological advancements are constantly reshaping the BCI landscape. The development of more sophisticated algorithms for signal processing, coupled with the miniaturization of hardware components, is lowering barriers to entry and expanding the potential applications. This has led to a growing demand for non-invasive BCIs, making the technology more accessible and affordable for a wider range of users. Shifting consumer demands towards personalized and effective healthcare solutions further underpin the industry's growth. The rising prevalence of neurological disorders and the growing interest in improving human-computer interaction are crucial factors boosting market expansion. [Include data about adoption metrics if available, otherwise use a prediction like: "Adoption rates are predicted to increase by XX% by 2033"].
Leading Regions, Countries, or Segments in BCI Industry
The [Region Name] region currently dominates the BCI market, driven by factors such as [mention specific reasons like high investments in R&D, supportive regulatory frameworks, and a strong presence of major players]. However, other regions are showing rapid growth potential.
Key Drivers:
By Type:
- Invasive Brain-computer Interface: High precision and better signal quality drive market growth, but invasive procedures limit adoption.
- Non-invasive Brain-computer Interface: Growing preference due to its ease of use and reduced risk, although signal quality is a limitation.
- Other Types: This segment exhibits growth potential, although it remains relatively niche at present.
By Application:
- Restoration of Disabilities: Significant growth due to a large patient population and supportive government initiatives.
- Repair of Brain Function: This application is expected to show substantial growth due to advancements in neuroscience and rehabilitation technologies.
- Other Applications: This segment holds the potential for disruption, with applications emerging in gaming, entertainment, and human-computer interaction.
Dominance Factors: Strong regulatory support, significant investments in research and development, and the presence of leading companies in the specified regions have contributed to the market dominance. [Include further analysis on the factors contributing to dominance in specific regions/segments].
BCI Industry Product Innovations
Recent innovations in BCI technology have focused on improving signal quality, reducing invasiveness, and expanding the range of applications. New generations of implantable devices offer improved biocompatibility and longevity, while non-invasive methods are becoming more sensitive and user-friendly. This progress, coupled with the development of advanced algorithms for signal processing and interpretation, has propelled the market forward. Unique selling propositions (USPs) now include enhanced user experience, improved data accuracy, and increased accessibility.
Propelling Factors for BCI Growth
Several factors drive the growth of the BCI market. Technological advancements, particularly in sensor technology and machine learning, are central to this expansion. Furthermore, increasing government funding for research and development fuels innovation. The rising prevalence of neurological disorders presents a substantial market opportunity, while expanding applications in areas like gaming and virtual reality offer fresh avenues for growth.
Obstacles in the BCI Industry Market
Despite its potential, the BCI industry faces hurdles. Regulatory complexities and stringent approval processes can slow down product development and market entry. Supply chain disruptions, particularly for specialized components, can impact production and availability. High costs associated with device development and implantation limit access and affordability. Moreover, intense competition among established players and new entrants further complicates the market landscape, creating challenges for market penetration. [Quantifiable impacts, e.g., cost analysis, can be incorporated here if available].
Future Opportunities in BCI Industry
Future opportunities include the development of more sophisticated and user-friendly non-invasive BCIs, expansion into new therapeutic applications, and the creation of integrated BCI systems for broader use cases. The integration of BCI technology with other emerging fields like artificial intelligence (AI) and augmented reality (AR) promises significant advancements. New markets are emerging in areas like gaming and entertainment, offering further opportunities for growth.
Major Players in the BCI Industry Ecosystem
- Emotive Incorporation
- ANT Neuro
- Integra LifeSciences Corporation
- NextMind
- MindMaze
- NIRx Medical Technologies
- Natus Medical Inc
- Compumedics Ltd
- Medtronic PLC
- Advanced Brain Monitoring Inc
- NeuroSky
- Brain Products GmbH
- Cadwell Industries Inc
- g tec medical engineering GmbH
- Nihon Kohden Corporation
Key Developments in BCI Industry
- [Insert bullet points detailing key developments with year/month and impact. Example: "October 2023: Company X launched a new non-invasive BCI headset, increasing competition in the market."]
Strategic BCI Industry Market Forecast
The BCI market is poised for sustained growth, propelled by continued technological innovation, expanding applications, and increasing investments. Future opportunities lie in addressing unmet clinical needs, developing more accessible and affordable devices, and exploring new applications beyond healthcare. The market's trajectory suggests significant expansion over the forecast period, exceeding $XX Million by 2033, creating substantial opportunities for both established players and new entrants.
BCI Industry Segmentation
-
1. Type
- 1.1. Invasive Brain-computer Interface
- 1.2. Non-invasive Brain-computer Interface
- 1.3. Other Types
-
2. Application
- 2.1. Restoration of Disabilities
- 2.2. Repair of Brain Function
- 2.3. Other Applications
BCI Industry Segmentation By Geography
-
1. North America
- 1.1. United States
- 1.2. Canada
- 1.3. Mexico
-
2. Europe
- 2.1. Germany
- 2.2. United Kingdom
- 2.3. France
- 2.4. Italy
- 2.5. Spain
- 2.6. Rest of Europe
-
3. Asia Pacific
- 3.1. China
- 3.2. Japan
- 3.3. India
- 3.4. Australia
- 3.5. South Korea
- 3.6. Rest of Asia Pacific
-
4. Middle East and Africa
- 4.1. GCC
- 4.2. South Africa
- 4.3. Rest of Middle East and Africa
-
5. South America
- 5.1. Brazil
- 5.2. Argentina
- 5.3. Rest of South America
BCI Industry REPORT HIGHLIGHTS
| Aspects | Details |
|---|---|
| Study Period | 2019-2033 |
| Base Year | 2024 |
| Estimated Year | 2025 |
| Forecast Period | 2025-2033 |
| Historical Period | 2019-2024 |
| Growth Rate | CAGR of 10.29% from 2019-2033 |
| Segmentation |
|
Table of Contents
- 1. Introduction
- 1.1. Research Scope
- 1.2. Market Segmentation
- 1.3. Research Methodology
- 1.4. Definitions and Assumptions
- 2. Executive Summary
- 2.1. Introduction
- 3. Market Dynamics
- 3.1. Introduction
- 3.2. Market Drivers
- 3.2.1. Increasing Prevalence of Neurodegenerative Disorders; Rising R&D Activities by Government to Improve the Brain-computer Interface Technology; Various Technological Advancements such as Miniaturization of Devices
- 3.3. Market Restrains
- 3.3.1. High Cost of Brain-computer Interface Devices; Lack of Expertise in Implementing the Systems
- 3.4. Market Trends
- 3.4.1. The Non-invasive Brain-computer Interface Segment is Expected to Dominate the Market During the Forecast Period
- 4. Market Factor Analysis
- 4.1. Porters Five Forces
- 4.2. Supply/Value Chain
- 4.3. PESTEL analysis
- 4.4. Market Entropy
- 4.5. Patent/Trademark Analysis
- 5. Global BCI Industry Analysis, Insights and Forecast, 2019-2031
- 5.1. Market Analysis, Insights and Forecast - by Type
- 5.1.1. Invasive Brain-computer Interface
- 5.1.2. Non-invasive Brain-computer Interface
- 5.1.3. Other Types
- 5.2. Market Analysis, Insights and Forecast - by Application
- 5.2.1. Restoration of Disabilities
- 5.2.2. Repair of Brain Function
- 5.2.3. Other Applications
- 5.3. Market Analysis, Insights and Forecast - by Region
- 5.3.1. North America
- 5.3.2. Europe
- 5.3.3. Asia Pacific
- 5.3.4. Middle East and Africa
- 5.3.5. South America
- 5.1. Market Analysis, Insights and Forecast - by Type
- 6. North America BCI Industry Analysis, Insights and Forecast, 2019-2031
- 6.1. Market Analysis, Insights and Forecast - by Type
- 6.1.1. Invasive Brain-computer Interface
- 6.1.2. Non-invasive Brain-computer Interface
- 6.1.3. Other Types
- 6.2. Market Analysis, Insights and Forecast - by Application
- 6.2.1. Restoration of Disabilities
- 6.2.2. Repair of Brain Function
- 6.2.3. Other Applications
- 6.1. Market Analysis, Insights and Forecast - by Type
- 7. Europe BCI Industry Analysis, Insights and Forecast, 2019-2031
- 7.1. Market Analysis, Insights and Forecast - by Type
- 7.1.1. Invasive Brain-computer Interface
- 7.1.2. Non-invasive Brain-computer Interface
- 7.1.3. Other Types
- 7.2. Market Analysis, Insights and Forecast - by Application
- 7.2.1. Restoration of Disabilities
- 7.2.2. Repair of Brain Function
- 7.2.3. Other Applications
- 7.1. Market Analysis, Insights and Forecast - by Type
- 8. Asia Pacific BCI Industry Analysis, Insights and Forecast, 2019-2031
- 8.1. Market Analysis, Insights and Forecast - by Type
- 8.1.1. Invasive Brain-computer Interface
- 8.1.2. Non-invasive Brain-computer Interface
- 8.1.3. Other Types
- 8.2. Market Analysis, Insights and Forecast - by Application
- 8.2.1. Restoration of Disabilities
- 8.2.2. Repair of Brain Function
- 8.2.3. Other Applications
- 8.1. Market Analysis, Insights and Forecast - by Type
- 9. Middle East and Africa BCI Industry Analysis, Insights and Forecast, 2019-2031
- 9.1. Market Analysis, Insights and Forecast - by Type
- 9.1.1. Invasive Brain-computer Interface
- 9.1.2. Non-invasive Brain-computer Interface
- 9.1.3. Other Types
- 9.2. Market Analysis, Insights and Forecast - by Application
- 9.2.1. Restoration of Disabilities
- 9.2.2. Repair of Brain Function
- 9.2.3. Other Applications
- 9.1. Market Analysis, Insights and Forecast - by Type
- 10. South America BCI Industry Analysis, Insights and Forecast, 2019-2031
- 10.1. Market Analysis, Insights and Forecast - by Type
- 10.1.1. Invasive Brain-computer Interface
- 10.1.2. Non-invasive Brain-computer Interface
- 10.1.3. Other Types
- 10.2. Market Analysis, Insights and Forecast - by Application
- 10.2.1. Restoration of Disabilities
- 10.2.2. Repair of Brain Function
- 10.2.3. Other Applications
- 10.1. Market Analysis, Insights and Forecast - by Type
- 11. North America BCI Industry Analysis, Insights and Forecast, 2019-2031
- 11.1. Market Analysis, Insights and Forecast - By Country/Sub-region
- 11.1.1 United States
- 11.1.2 Canada
- 11.1.3 Mexico
- 12. Europe BCI Industry Analysis, Insights and Forecast, 2019-2031
- 12.1. Market Analysis, Insights and Forecast - By Country/Sub-region
- 12.1.1 Germany
- 12.1.2 United Kingdom
- 12.1.3 France
- 12.1.4 Italy
- 12.1.5 Spain
- 12.1.6 Rest of Europe
- 13. Asia Pacific BCI Industry Analysis, Insights and Forecast, 2019-2031
- 13.1. Market Analysis, Insights and Forecast - By Country/Sub-region
- 13.1.1 China
- 13.1.2 Japan
- 13.1.3 India
- 13.1.4 Australia
- 13.1.5 South Korea
- 13.1.6 Rest of Asia Pacific
- 14. Middle East and Africa BCI Industry Analysis, Insights and Forecast, 2019-2031
- 14.1. Market Analysis, Insights and Forecast - By Country/Sub-region
- 14.1.1 GCC
- 14.1.2 South Africa
- 14.1.3 Rest of Middle East and Africa
- 15. South America BCI Industry Analysis, Insights and Forecast, 2019-2031
- 15.1. Market Analysis, Insights and Forecast - By Country/Sub-region
- 15.1.1 Brazil
- 15.1.2 Argentina
- 15.1.3 Rest of South America
- 16. Competitive Analysis
- 16.1. Global Market Share Analysis 2024
- 16.2. Company Profiles
- 16.2.1 Emotive Incorporation
- 16.2.1.1. Overview
- 16.2.1.2. Products
- 16.2.1.3. SWOT Analysis
- 16.2.1.4. Recent Developments
- 16.2.1.5. Financials (Based on Availability)
- 16.2.2 ANT Neuro
- 16.2.2.1. Overview
- 16.2.2.2. Products
- 16.2.2.3. SWOT Analysis
- 16.2.2.4. Recent Developments
- 16.2.2.5. Financials (Based on Availability)
- 16.2.3 Integra LifeSciences Corporation
- 16.2.3.1. Overview
- 16.2.3.2. Products
- 16.2.3.3. SWOT Analysis
- 16.2.3.4. Recent Developments
- 16.2.3.5. Financials (Based on Availability)
- 16.2.4 NextMind
- 16.2.4.1. Overview
- 16.2.4.2. Products
- 16.2.4.3. SWOT Analysis
- 16.2.4.4. Recent Developments
- 16.2.4.5. Financials (Based on Availability)
- 16.2.5 MindMaze
- 16.2.5.1. Overview
- 16.2.5.2. Products
- 16.2.5.3. SWOT Analysis
- 16.2.5.4. Recent Developments
- 16.2.5.5. Financials (Based on Availability)
- 16.2.6 NIRx Medical Technologies
- 16.2.6.1. Overview
- 16.2.6.2. Products
- 16.2.6.3. SWOT Analysis
- 16.2.6.4. Recent Developments
- 16.2.6.5. Financials (Based on Availability)
- 16.2.7 Natus Medical Inc
- 16.2.7.1. Overview
- 16.2.7.2. Products
- 16.2.7.3. SWOT Analysis
- 16.2.7.4. Recent Developments
- 16.2.7.5. Financials (Based on Availability)
- 16.2.8 Compumedics Ltd
- 16.2.8.1. Overview
- 16.2.8.2. Products
- 16.2.8.3. SWOT Analysis
- 16.2.8.4. Recent Developments
- 16.2.8.5. Financials (Based on Availability)
- 16.2.9 Medtronic PLC
- 16.2.9.1. Overview
- 16.2.9.2. Products
- 16.2.9.3. SWOT Analysis
- 16.2.9.4. Recent Developments
- 16.2.9.5. Financials (Based on Availability)
- 16.2.10 Advanced Brain Monitoring Inc
- 16.2.10.1. Overview
- 16.2.10.2. Products
- 16.2.10.3. SWOT Analysis
- 16.2.10.4. Recent Developments
- 16.2.10.5. Financials (Based on Availability)
- 16.2.11 NeuroSky
- 16.2.11.1. Overview
- 16.2.11.2. Products
- 16.2.11.3. SWOT Analysis
- 16.2.11.4. Recent Developments
- 16.2.11.5. Financials (Based on Availability)
- 16.2.12 Brain Products GmbH
- 16.2.12.1. Overview
- 16.2.12.2. Products
- 16.2.12.3. SWOT Analysis
- 16.2.12.4. Recent Developments
- 16.2.12.5. Financials (Based on Availability)
- 16.2.13 Cadwell Industries Inc
- 16.2.13.1. Overview
- 16.2.13.2. Products
- 16.2.13.3. SWOT Analysis
- 16.2.13.4. Recent Developments
- 16.2.13.5. Financials (Based on Availability)
- 16.2.14 g tec medical engineering GmbH
- 16.2.14.1. Overview
- 16.2.14.2. Products
- 16.2.14.3. SWOT Analysis
- 16.2.14.4. Recent Developments
- 16.2.14.5. Financials (Based on Availability)
- 16.2.15 Nihon Kohden Corporation
- 16.2.15.1. Overview
- 16.2.15.2. Products
- 16.2.15.3. SWOT Analysis
- 16.2.15.4. Recent Developments
- 16.2.15.5. Financials (Based on Availability)
- 16.2.1 Emotive Incorporation
List of Figures
- Figure 1: Global BCI Industry Revenue Breakdown (Million, %) by Region 2024 & 2032
- Figure 2: Global BCI Industry Volume Breakdown (K Unit, %) by Region 2024 & 2032
- Figure 3: North America BCI Industry Revenue (Million), by Country 2024 & 2032
- Figure 4: North America BCI Industry Volume (K Unit), by Country 2024 & 2032
- Figure 5: North America BCI Industry Revenue Share (%), by Country 2024 & 2032
- Figure 6: North America BCI Industry Volume Share (%), by Country 2024 & 2032
- Figure 7: Europe BCI Industry Revenue (Million), by Country 2024 & 2032
- Figure 8: Europe BCI Industry Volume (K Unit), by Country 2024 & 2032
- Figure 9: Europe BCI Industry Revenue Share (%), by Country 2024 & 2032
- Figure 10: Europe BCI Industry Volume Share (%), by Country 2024 & 2032
- Figure 11: Asia Pacific BCI Industry Revenue (Million), by Country 2024 & 2032
- Figure 12: Asia Pacific BCI Industry Volume (K Unit), by Country 2024 & 2032
- Figure 13: Asia Pacific BCI Industry Revenue Share (%), by Country 2024 & 2032
- Figure 14: Asia Pacific BCI Industry Volume Share (%), by Country 2024 & 2032
- Figure 15: Middle East and Africa BCI Industry Revenue (Million), by Country 2024 & 2032
- Figure 16: Middle East and Africa BCI Industry Volume (K Unit), by Country 2024 & 2032
- Figure 17: Middle East and Africa BCI Industry Revenue Share (%), by Country 2024 & 2032
- Figure 18: Middle East and Africa BCI Industry Volume Share (%), by Country 2024 & 2032
- Figure 19: South America BCI Industry Revenue (Million), by Country 2024 & 2032
- Figure 20: South America BCI Industry Volume (K Unit), by Country 2024 & 2032
- Figure 21: South America BCI Industry Revenue Share (%), by Country 2024 & 2032
- Figure 22: South America BCI Industry Volume Share (%), by Country 2024 & 2032
- Figure 23: North America BCI Industry Revenue (Million), by Type 2024 & 2032
- Figure 24: North America BCI Industry Volume (K Unit), by Type 2024 & 2032
- Figure 25: North America BCI Industry Revenue Share (%), by Type 2024 & 2032
- Figure 26: North America BCI Industry Volume Share (%), by Type 2024 & 2032
- Figure 27: North America BCI Industry Revenue (Million), by Application 2024 & 2032
- Figure 28: North America BCI Industry Volume (K Unit), by Application 2024 & 2032
- Figure 29: North America BCI Industry Revenue Share (%), by Application 2024 & 2032
- Figure 30: North America BCI Industry Volume Share (%), by Application 2024 & 2032
- Figure 31: North America BCI Industry Revenue (Million), by Country 2024 & 2032
- Figure 32: North America BCI Industry Volume (K Unit), by Country 2024 & 2032
- Figure 33: North America BCI Industry Revenue Share (%), by Country 2024 & 2032
- Figure 34: North America BCI Industry Volume Share (%), by Country 2024 & 2032
- Figure 35: Europe BCI Industry Revenue (Million), by Type 2024 & 2032
- Figure 36: Europe BCI Industry Volume (K Unit), by Type 2024 & 2032
- Figure 37: Europe BCI Industry Revenue Share (%), by Type 2024 & 2032
- Figure 38: Europe BCI Industry Volume Share (%), by Type 2024 & 2032
- Figure 39: Europe BCI Industry Revenue (Million), by Application 2024 & 2032
- Figure 40: Europe BCI Industry Volume (K Unit), by Application 2024 & 2032
- Figure 41: Europe BCI Industry Revenue Share (%), by Application 2024 & 2032
- Figure 42: Europe BCI Industry Volume Share (%), by Application 2024 & 2032
- Figure 43: Europe BCI Industry Revenue (Million), by Country 2024 & 2032
- Figure 44: Europe BCI Industry Volume (K Unit), by Country 2024 & 2032
- Figure 45: Europe BCI Industry Revenue Share (%), by Country 2024 & 2032
- Figure 46: Europe BCI Industry Volume Share (%), by Country 2024 & 2032
- Figure 47: Asia Pacific BCI Industry Revenue (Million), by Type 2024 & 2032
- Figure 48: Asia Pacific BCI Industry Volume (K Unit), by Type 2024 & 2032
- Figure 49: Asia Pacific BCI Industry Revenue Share (%), by Type 2024 & 2032
- Figure 50: Asia Pacific BCI Industry Volume Share (%), by Type 2024 & 2032
- Figure 51: Asia Pacific BCI Industry Revenue (Million), by Application 2024 & 2032
- Figure 52: Asia Pacific BCI Industry Volume (K Unit), by Application 2024 & 2032
- Figure 53: Asia Pacific BCI Industry Revenue Share (%), by Application 2024 & 2032
- Figure 54: Asia Pacific BCI Industry Volume Share (%), by Application 2024 & 2032
- Figure 55: Asia Pacific BCI Industry Revenue (Million), by Country 2024 & 2032
- Figure 56: Asia Pacific BCI Industry Volume (K Unit), by Country 2024 & 2032
- Figure 57: Asia Pacific BCI Industry Revenue Share (%), by Country 2024 & 2032
- Figure 58: Asia Pacific BCI Industry Volume Share (%), by Country 2024 & 2032
- Figure 59: Middle East and Africa BCI Industry Revenue (Million), by Type 2024 & 2032
- Figure 60: Middle East and Africa BCI Industry Volume (K Unit), by Type 2024 & 2032
- Figure 61: Middle East and Africa BCI Industry Revenue Share (%), by Type 2024 & 2032
- Figure 62: Middle East and Africa BCI Industry Volume Share (%), by Type 2024 & 2032
- Figure 63: Middle East and Africa BCI Industry Revenue (Million), by Application 2024 & 2032
- Figure 64: Middle East and Africa BCI Industry Volume (K Unit), by Application 2024 & 2032
- Figure 65: Middle East and Africa BCI Industry Revenue Share (%), by Application 2024 & 2032
- Figure 66: Middle East and Africa BCI Industry Volume Share (%), by Application 2024 & 2032
- Figure 67: Middle East and Africa BCI Industry Revenue (Million), by Country 2024 & 2032
- Figure 68: Middle East and Africa BCI Industry Volume (K Unit), by Country 2024 & 2032
- Figure 69: Middle East and Africa BCI Industry Revenue Share (%), by Country 2024 & 2032
- Figure 70: Middle East and Africa BCI Industry Volume Share (%), by Country 2024 & 2032
- Figure 71: South America BCI Industry Revenue (Million), by Type 2024 & 2032
- Figure 72: South America BCI Industry Volume (K Unit), by Type 2024 & 2032
- Figure 73: South America BCI Industry Revenue Share (%), by Type 2024 & 2032
- Figure 74: South America BCI Industry Volume Share (%), by Type 2024 & 2032
- Figure 75: South America BCI Industry Revenue (Million), by Application 2024 & 2032
- Figure 76: South America BCI Industry Volume (K Unit), by Application 2024 & 2032
- Figure 77: South America BCI Industry Revenue Share (%), by Application 2024 & 2032
- Figure 78: South America BCI Industry Volume Share (%), by Application 2024 & 2032
- Figure 79: South America BCI Industry Revenue (Million), by Country 2024 & 2032
- Figure 80: South America BCI Industry Volume (K Unit), by Country 2024 & 2032
- Figure 81: South America BCI Industry Revenue Share (%), by Country 2024 & 2032
- Figure 82: South America BCI Industry Volume Share (%), by Country 2024 & 2032
List of Tables
- Table 1: Global BCI Industry Revenue Million Forecast, by Region 2019 & 2032
- Table 2: Global BCI Industry Volume K Unit Forecast, by Region 2019 & 2032
- Table 3: Global BCI Industry Revenue Million Forecast, by Type 2019 & 2032
- Table 4: Global BCI Industry Volume K Unit Forecast, by Type 2019 & 2032
- Table 5: Global BCI Industry Revenue Million Forecast, by Application 2019 & 2032
- Table 6: Global BCI Industry Volume K Unit Forecast, by Application 2019 & 2032
- Table 7: Global BCI Industry Revenue Million Forecast, by Region 2019 & 2032
- Table 8: Global BCI Industry Volume K Unit Forecast, by Region 2019 & 2032
- Table 9: Global BCI Industry Revenue Million Forecast, by Country 2019 & 2032
- Table 10: Global BCI Industry Volume K Unit Forecast, by Country 2019 & 2032
- Table 11: United States BCI Industry Revenue (Million) Forecast, by Application 2019 & 2032
- Table 12: United States BCI Industry Volume (K Unit) Forecast, by Application 2019 & 2032
- Table 13: Canada BCI Industry Revenue (Million) Forecast, by Application 2019 & 2032
- Table 14: Canada BCI Industry Volume (K Unit) Forecast, by Application 2019 & 2032
- Table 15: Mexico BCI Industry Revenue (Million) Forecast, by Application 2019 & 2032
- Table 16: Mexico BCI Industry Volume (K Unit) Forecast, by Application 2019 & 2032
- Table 17: Global BCI Industry Revenue Million Forecast, by Country 2019 & 2032
- Table 18: Global BCI Industry Volume K Unit Forecast, by Country 2019 & 2032
- Table 19: Germany BCI Industry Revenue (Million) Forecast, by Application 2019 & 2032
- Table 20: Germany BCI Industry Volume (K Unit) Forecast, by Application 2019 & 2032
- Table 21: United Kingdom BCI Industry Revenue (Million) Forecast, by Application 2019 & 2032
- Table 22: United Kingdom BCI Industry Volume (K Unit) Forecast, by Application 2019 & 2032
- Table 23: France BCI Industry Revenue (Million) Forecast, by Application 2019 & 2032
- Table 24: France BCI Industry Volume (K Unit) Forecast, by Application 2019 & 2032
- Table 25: Italy BCI Industry Revenue (Million) Forecast, by Application 2019 & 2032
- Table 26: Italy BCI Industry Volume (K Unit) Forecast, by Application 2019 & 2032
- Table 27: Spain BCI Industry Revenue (Million) Forecast, by Application 2019 & 2032
- Table 28: Spain BCI Industry Volume (K Unit) Forecast, by Application 2019 & 2032
- Table 29: Rest of Europe BCI Industry Revenue (Million) Forecast, by Application 2019 & 2032
- Table 30: Rest of Europe BCI Industry Volume (K Unit) Forecast, by Application 2019 & 2032
- Table 31: Global BCI Industry Revenue Million Forecast, by Country 2019 & 2032
- Table 32: Global BCI Industry Volume K Unit Forecast, by Country 2019 & 2032
- Table 33: China BCI Industry Revenue (Million) Forecast, by Application 2019 & 2032
- Table 34: China BCI Industry Volume (K Unit) Forecast, by Application 2019 & 2032
- Table 35: Japan BCI Industry Revenue (Million) Forecast, by Application 2019 & 2032
- Table 36: Japan BCI Industry Volume (K Unit) Forecast, by Application 2019 & 2032
- Table 37: India BCI Industry Revenue (Million) Forecast, by Application 2019 & 2032
- Table 38: India BCI Industry Volume (K Unit) Forecast, by Application 2019 & 2032
- Table 39: Australia BCI Industry Revenue (Million) Forecast, by Application 2019 & 2032
- Table 40: Australia BCI Industry Volume (K Unit) Forecast, by Application 2019 & 2032
- Table 41: South Korea BCI Industry Revenue (Million) Forecast, by Application 2019 & 2032
- Table 42: South Korea BCI Industry Volume (K Unit) Forecast, by Application 2019 & 2032
- Table 43: Rest of Asia Pacific BCI Industry Revenue (Million) Forecast, by Application 2019 & 2032
- Table 44: Rest of Asia Pacific BCI Industry Volume (K Unit) Forecast, by Application 2019 & 2032
- Table 45: Global BCI Industry Revenue Million Forecast, by Country 2019 & 2032
- Table 46: Global BCI Industry Volume K Unit Forecast, by Country 2019 & 2032
- Table 47: GCC BCI Industry Revenue (Million) Forecast, by Application 2019 & 2032
- Table 48: GCC BCI Industry Volume (K Unit) Forecast, by Application 2019 & 2032
- Table 49: South Africa BCI Industry Revenue (Million) Forecast, by Application 2019 & 2032
- Table 50: South Africa BCI Industry Volume (K Unit) Forecast, by Application 2019 & 2032
- Table 51: Rest of Middle East and Africa BCI Industry Revenue (Million) Forecast, by Application 2019 & 2032
- Table 52: Rest of Middle East and Africa BCI Industry Volume (K Unit) Forecast, by Application 2019 & 2032
- Table 53: Global BCI Industry Revenue Million Forecast, by Country 2019 & 2032
- Table 54: Global BCI Industry Volume K Unit Forecast, by Country 2019 & 2032
- Table 55: Brazil BCI Industry Revenue (Million) Forecast, by Application 2019 & 2032
- Table 56: Brazil BCI Industry Volume (K Unit) Forecast, by Application 2019 & 2032
- Table 57: Argentina BCI Industry Revenue (Million) Forecast, by Application 2019 & 2032
- Table 58: Argentina BCI Industry Volume (K Unit) Forecast, by Application 2019 & 2032
- Table 59: Rest of South America BCI Industry Revenue (Million) Forecast, by Application 2019 & 2032
- Table 60: Rest of South America BCI Industry Volume (K Unit) Forecast, by Application 2019 & 2032
- Table 61: Global BCI Industry Revenue Million Forecast, by Type 2019 & 2032
- Table 62: Global BCI Industry Volume K Unit Forecast, by Type 2019 & 2032
- Table 63: Global BCI Industry Revenue Million Forecast, by Application 2019 & 2032
- Table 64: Global BCI Industry Volume K Unit Forecast, by Application 2019 & 2032
- Table 65: Global BCI Industry Revenue Million Forecast, by Country 2019 & 2032
- Table 66: Global BCI Industry Volume K Unit Forecast, by Country 2019 & 2032
- Table 67: United States BCI Industry Revenue (Million) Forecast, by Application 2019 & 2032
- Table 68: United States BCI Industry Volume (K Unit) Forecast, by Application 2019 & 2032
- Table 69: Canada BCI Industry Revenue (Million) Forecast, by Application 2019 & 2032
- Table 70: Canada BCI Industry Volume (K Unit) Forecast, by Application 2019 & 2032
- Table 71: Mexico BCI Industry Revenue (Million) Forecast, by Application 2019 & 2032
- Table 72: Mexico BCI Industry Volume (K Unit) Forecast, by Application 2019 & 2032
- Table 73: Global BCI Industry Revenue Million Forecast, by Type 2019 & 2032
- Table 74: Global BCI Industry Volume K Unit Forecast, by Type 2019 & 2032
- Table 75: Global BCI Industry Revenue Million Forecast, by Application 2019 & 2032
- Table 76: Global BCI Industry Volume K Unit Forecast, by Application 2019 & 2032
- Table 77: Global BCI Industry Revenue Million Forecast, by Country 2019 & 2032
- Table 78: Global BCI Industry Volume K Unit Forecast, by Country 2019 & 2032
- Table 79: Germany BCI Industry Revenue (Million) Forecast, by Application 2019 & 2032
- Table 80: Germany BCI Industry Volume (K Unit) Forecast, by Application 2019 & 2032
- Table 81: United Kingdom BCI Industry Revenue (Million) Forecast, by Application 2019 & 2032
- Table 82: United Kingdom BCI Industry Volume (K Unit) Forecast, by Application 2019 & 2032
- Table 83: France BCI Industry Revenue (Million) Forecast, by Application 2019 & 2032
- Table 84: France BCI Industry Volume (K Unit) Forecast, by Application 2019 & 2032
- Table 85: Italy BCI Industry Revenue (Million) Forecast, by Application 2019 & 2032
- Table 86: Italy BCI Industry Volume (K Unit) Forecast, by Application 2019 & 2032
- Table 87: Spain BCI Industry Revenue (Million) Forecast, by Application 2019 & 2032
- Table 88: Spain BCI Industry Volume (K Unit) Forecast, by Application 2019 & 2032
- Table 89: Rest of Europe BCI Industry Revenue (Million) Forecast, by Application 2019 & 2032
- Table 90: Rest of Europe BCI Industry Volume (K Unit) Forecast, by Application 2019 & 2032
- Table 91: Global BCI Industry Revenue Million Forecast, by Type 2019 & 2032
- Table 92: Global BCI Industry Volume K Unit Forecast, by Type 2019 & 2032
- Table 93: Global BCI Industry Revenue Million Forecast, by Application 2019 & 2032
- Table 94: Global BCI Industry Volume K Unit Forecast, by Application 2019 & 2032
- Table 95: Global BCI Industry Revenue Million Forecast, by Country 2019 & 2032
- Table 96: Global BCI Industry Volume K Unit Forecast, by Country 2019 & 2032
- Table 97: China BCI Industry Revenue (Million) Forecast, by Application 2019 & 2032
- Table 98: China BCI Industry Volume (K Unit) Forecast, by Application 2019 & 2032
- Table 99: Japan BCI Industry Revenue (Million) Forecast, by Application 2019 & 2032
- Table 100: Japan BCI Industry Volume (K Unit) Forecast, by Application 2019 & 2032
- Table 101: India BCI Industry Revenue (Million) Forecast, by Application 2019 & 2032
- Table 102: India BCI Industry Volume (K Unit) Forecast, by Application 2019 & 2032
- Table 103: Australia BCI Industry Revenue (Million) Forecast, by Application 2019 & 2032
- Table 104: Australia BCI Industry Volume (K Unit) Forecast, by Application 2019 & 2032
- Table 105: South Korea BCI Industry Revenue (Million) Forecast, by Application 2019 & 2032
- Table 106: South Korea BCI Industry Volume (K Unit) Forecast, by Application 2019 & 2032
- Table 107: Rest of Asia Pacific BCI Industry Revenue (Million) Forecast, by Application 2019 & 2032
- Table 108: Rest of Asia Pacific BCI Industry Volume (K Unit) Forecast, by Application 2019 & 2032
- Table 109: Global BCI Industry Revenue Million Forecast, by Type 2019 & 2032
- Table 110: Global BCI Industry Volume K Unit Forecast, by Type 2019 & 2032
- Table 111: Global BCI Industry Revenue Million Forecast, by Application 2019 & 2032
- Table 112: Global BCI Industry Volume K Unit Forecast, by Application 2019 & 2032
- Table 113: Global BCI Industry Revenue Million Forecast, by Country 2019 & 2032
- Table 114: Global BCI Industry Volume K Unit Forecast, by Country 2019 & 2032
- Table 115: GCC BCI Industry Revenue (Million) Forecast, by Application 2019 & 2032
- Table 116: GCC BCI Industry Volume (K Unit) Forecast, by Application 2019 & 2032
- Table 117: South Africa BCI Industry Revenue (Million) Forecast, by Application 2019 & 2032
- Table 118: South Africa BCI Industry Volume (K Unit) Forecast, by Application 2019 & 2032
- Table 119: Rest of Middle East and Africa BCI Industry Revenue (Million) Forecast, by Application 2019 & 2032
- Table 120: Rest of Middle East and Africa BCI Industry Volume (K Unit) Forecast, by Application 2019 & 2032
- Table 121: Global BCI Industry Revenue Million Forecast, by Type 2019 & 2032
- Table 122: Global BCI Industry Volume K Unit Forecast, by Type 2019 & 2032
- Table 123: Global BCI Industry Revenue Million Forecast, by Application 2019 & 2032
- Table 124: Global BCI Industry Volume K Unit Forecast, by Application 2019 & 2032
- Table 125: Global BCI Industry Revenue Million Forecast, by Country 2019 & 2032
- Table 126: Global BCI Industry Volume K Unit Forecast, by Country 2019 & 2032
- Table 127: Brazil BCI Industry Revenue (Million) Forecast, by Application 2019 & 2032
- Table 128: Brazil BCI Industry Volume (K Unit) Forecast, by Application 2019 & 2032
- Table 129: Argentina BCI Industry Revenue (Million) Forecast, by Application 2019 & 2032
- Table 130: Argentina BCI Industry Volume (K Unit) Forecast, by Application 2019 & 2032
- Table 131: Rest of South America BCI Industry Revenue (Million) Forecast, by Application 2019 & 2032
- Table 132: Rest of South America BCI Industry Volume (K Unit) Forecast, by Application 2019 & 2032
Frequently Asked Questions
1. What is the projected Compound Annual Growth Rate (CAGR) of the BCI Industry?
The projected CAGR is approximately 10.29%.
2. Which companies are prominent players in the BCI Industry?
Key companies in the market include Emotive Incorporation, ANT Neuro, Integra LifeSciences Corporation, NextMind, MindMaze, NIRx Medical Technologies, Natus Medical Inc, Compumedics Ltd, Medtronic PLC, Advanced Brain Monitoring Inc, NeuroSky, Brain Products GmbH, Cadwell Industries Inc, g tec medical engineering GmbH, Nihon Kohden Corporation.
3. What are the main segments of the BCI Industry?
The market segments include Type, Application.
4. Can you provide details about the market size?
The market size is estimated to be USD 2.00 Million as of 2022.
5. What are some drivers contributing to market growth?
Increasing Prevalence of Neurodegenerative Disorders; Rising R&D Activities by Government to Improve the Brain-computer Interface Technology; Various Technological Advancements such as Miniaturization of Devices.
6. What are the notable trends driving market growth?
The Non-invasive Brain-computer Interface Segment is Expected to Dominate the Market During the Forecast Period.
7. Are there any restraints impacting market growth?
High Cost of Brain-computer Interface Devices; Lack of Expertise in Implementing the Systems.
8. Can you provide examples of recent developments in the market?
N/A
9. What pricing options are available for accessing the report?
Pricing options include single-user, multi-user, and enterprise licenses priced at USD 4750, USD 5250, and USD 8750 respectively.
10. Is the market size provided in terms of value or volume?
The market size is provided in terms of value, measured in Million and volume, measured in K Unit.
11. Are there any specific market keywords associated with the report?
Yes, the market keyword associated with the report is "BCI Industry," which aids in identifying and referencing the specific market segment covered.
12. How do I determine which pricing option suits my needs best?
The pricing options vary based on user requirements and access needs. Individual users may opt for single-user licenses, while businesses requiring broader access may choose multi-user or enterprise licenses for cost-effective access to the report.
13. Are there any additional resources or data provided in the BCI Industry report?
While the report offers comprehensive insights, it's advisable to review the specific contents or supplementary materials provided to ascertain if additional resources or data are available.
14. How can I stay updated on further developments or reports in the BCI Industry?
To stay informed about further developments, trends, and reports in the BCI Industry, consider subscribing to industry newsletters, following relevant companies and organizations, or regularly checking reputable industry news sources and publications.
Methodology
Step 1 - Identification of Relevant Samples Size from Population Database


Step 2 - Approaches for Defining Global Market Size (Value, Volume* & Price*)

Note*: In applicable scenarios
Step 3 - Data Sources
Primary Research
- Web Analytics
- Survey Reports
- Research Institute
- Latest Research Reports
- Opinion Leaders
Secondary Research
- Annual Reports
- White Paper
- Latest Press Release
- Industry Association
- Paid Database
- Investor Presentations

Step 4 - Data Triangulation
Involves using different sources of information in order to increase the validity of a study
These sources are likely to be stakeholders in a program - participants, other researchers, program staff, other community members, and so on.
Then we put all data in single framework & apply various statistical tools to find out the dynamic on the market.
During the analysis stage, feedback from the stakeholder groups would be compared to determine areas of agreement as well as areas of divergence
