

Key Insights
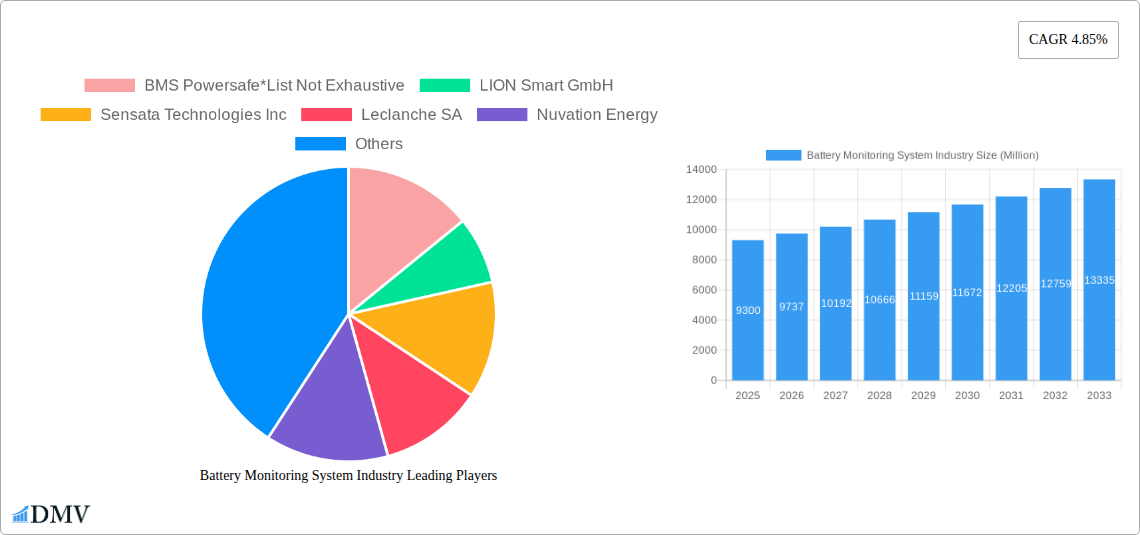
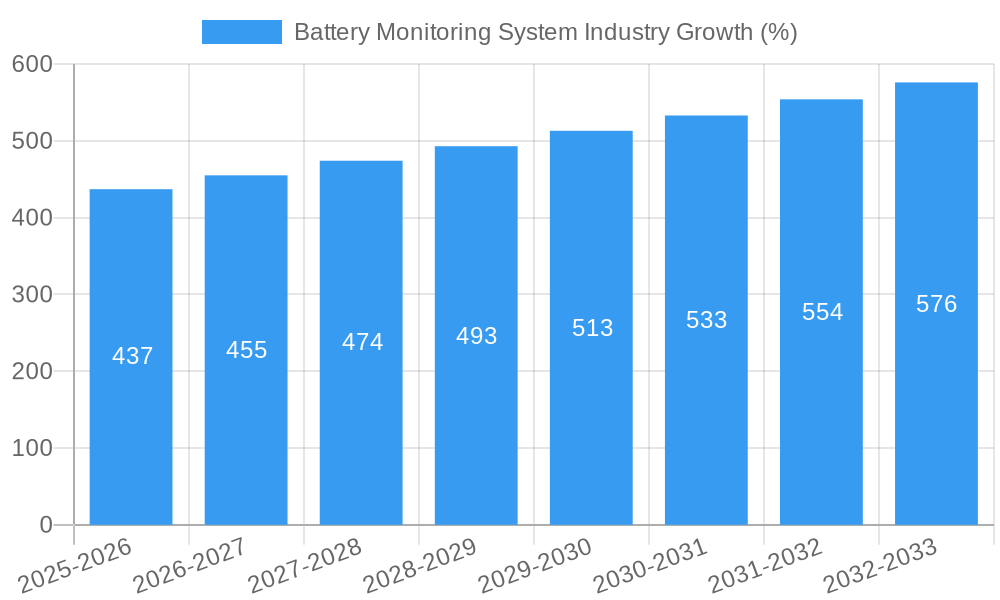
The Battery Monitoring System (BMS) market is experiencing robust growth, projected to reach \$9.30 billion in 2025 and maintain a Compound Annual Growth Rate (CAGR) of 4.85% from 2025 to 2033. This expansion is driven by several key factors. The burgeoning electric vehicle (EV) industry is a major catalyst, demanding sophisticated BMS solutions for safety, performance, and longevity. Furthermore, the increasing adoption of renewable energy sources, such as solar and wind power, necessitates efficient energy storage and management, fueling demand for advanced BMS technology in stationary and portable applications. Growth in grid-scale energy storage systems further contributes to market expansion. Technological advancements, such as improved sensor technology, enhanced algorithms for predictive maintenance, and the integration of artificial intelligence (AI) for optimized battery performance, are also contributing to market growth. While the high initial investment cost of implementing BMS can be a restraint, particularly for smaller companies, the long-term benefits in terms of cost savings, improved safety, and extended battery life are driving widespread adoption. The market is segmented by application (stationary, portable, transportation), reflecting the diverse usage of BMS across various sectors. Key players like BMS Powersafe, LION Smart GmbH, Sensata Technologies, and others are actively competing and innovating within this dynamic landscape, driving further market development and refining the technology for improved efficiency and reliability.
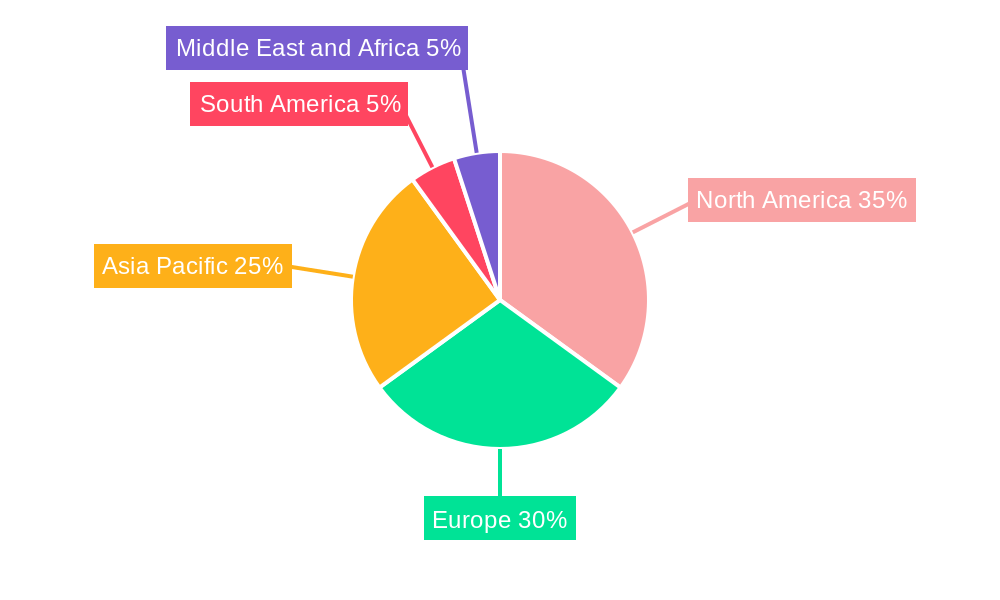
The geographical distribution of the BMS market reflects the global shift towards electrification and renewable energy. North America and Europe currently hold significant market share, driven by strong government support for EV adoption and renewable energy initiatives. However, the Asia-Pacific region, particularly China and India, is expected to witness significant growth in the coming years, fueled by rapid industrialization, increasing urbanization, and rising demand for electric mobility. South America and the Middle East and Africa are also poised for moderate growth, driven by increasing infrastructure investments and government policies promoting sustainable energy solutions. The forecast period (2025-2033) anticipates continued expansion, driven by the aforementioned factors, solidifying the BMS market's position as a crucial component in the global transition to cleaner and more sustainable energy solutions.
Battery Monitoring System (BMS) Industry Report: 2019-2033
This comprehensive report provides an in-depth analysis of the global Battery Monitoring System (BMS) industry, offering invaluable insights for stakeholders seeking to navigate this rapidly evolving market. With a study period spanning 2019-2033, a base year of 2025, and a forecast period of 2025-2033, this report delivers a holistic view of past performance, current trends, and future projections. The market is expected to reach xx Million by 2033.
Battery Monitoring System Industry Market Composition & Trends
This section delves into the intricate structure of the BMS market, examining market concentration, innovation drivers, regulatory landscapes, substitute products, end-user profiles, and M&A activities. The global BMS market exhibits a moderately concentrated landscape, with key players holding significant market share. However, the entry of new players and technological advancements are fostering increased competition.
- Market Share Distribution: The top 5 players account for approximately xx% of the global market share in 2025, with a projected xx% by 2033.
- Innovation Catalysts: The increasing demand for electric vehicles (EVs) and energy storage systems (ESS) is a primary driver of innovation, pushing the development of advanced BMS technologies with enhanced functionalities.
- Regulatory Landscape: Stringent safety regulations and emission standards are shaping the BMS market, driving the adoption of sophisticated and reliable systems. Government incentives and subsidies for EVs further contribute to market growth.
- Substitute Products: While currently limited, alternative technologies for battery monitoring are emerging, posing a potential long-term threat. However, the maturity and reliability of BMS currently limit this challenge.
- End-User Profiles: Key end-users include automotive manufacturers, energy storage providers, industrial equipment manufacturers, and consumer electronics companies. Each segment displays unique needs and preferences.
- M&A Activities: The industry has witnessed significant M&A activity in recent years, with total deal values exceeding xx Million in the period 2019-2024. These activities are driven by strategic expansion, technological acquisition, and market consolidation. Examples include the Battrixx acquisition of Varos Technology in March 2022.
Battery Monitoring System Industry Evolution
This section analyzes the transformative journey of the BMS industry, tracking market growth trajectories, technological advancements, and the evolution of consumer demands. The market has demonstrated significant growth over the historical period (2019-2024), with a Compound Annual Growth Rate (CAGR) of xx%. This growth is projected to continue throughout the forecast period (2025-2033), driven by the rising adoption of EVs, energy storage solutions, and portable electronics. Technological advancements such as the integration of AI and IoT capabilities are further enhancing BMS performance and functionality. Consumers increasingly demand longer battery life, improved safety features, and higher energy efficiency, shaping the direction of BMS development. The adoption rate of advanced BMS features, such as predictive maintenance and remote diagnostics, is also increasing significantly, showcasing a shift towards sophisticated monitoring solutions.
Leading Regions, Countries, or Segments in Battery Monitoring System Industry
The transportation segment currently dominates the BMS market, driven by the rapid expansion of the electric vehicle industry. Asia-Pacific is the leading region, followed by North America and Europe.
- Key Drivers for Transportation Segment Dominance:
- Massive investments in EV infrastructure and manufacturing.
- Stringent emission regulations pushing for EV adoption.
- Increasing consumer demand for electric vehicles.
- Government incentives and subsidies supporting EV development.
- Regional Dominance Analysis: Asia-Pacific’s dominance stems from its large EV market, substantial manufacturing base, and supportive government policies. North America and Europe also exhibit strong growth, driven by a combination of technological advancements and rising environmental concerns.
Battery Monitoring System Industry Product Innovations
Recent advancements in BMS technology have resulted in smaller, lighter, and more efficient systems. Improved algorithms and advanced sensor technology provide enhanced accuracy in monitoring battery health and performance. The integration of AI and machine learning allows for predictive maintenance and optimized battery management, extending battery lifespan and minimizing downtime. Unique selling propositions often revolve around features like improved safety mechanisms, enhanced communication protocols, and robust diagnostic capabilities.
Propelling Factors for Battery Monitoring System Industry Growth
Several factors contribute to the growth of the BMS market. The increasing adoption of electric vehicles and hybrid electric vehicles (HEVs) is a key driver, demanding sophisticated BMS for optimal performance and safety. The rising demand for energy storage systems in residential and commercial applications further boosts the market. Government regulations promoting renewable energy and reducing carbon emissions incentivize the use of battery-powered systems, indirectly driving the need for reliable BMS.
Obstacles in the Battery Monitoring System Industry Market
Despite its significant growth potential, the BMS market faces challenges. Supply chain disruptions related to raw materials and semiconductor shortages can hinder production and increase costs. Intense competition from established players and emerging startups adds pressure on pricing and margins. Regulatory complexities and evolving safety standards demand continuous innovation and adaptation. These challenges, if not effectively managed, can impede market growth.
Future Opportunities in Battery Monitoring System Industry
The BMS market is poised for growth in several areas. The expansion of the electric vehicle market into new segments, such as commercial vehicles and two-wheelers, presents significant opportunities. The increasing demand for energy storage systems in grid-scale applications and renewable energy integration opens further avenues for growth. Technological advancements, such as solid-state battery technology, create opportunities for specialized BMS solutions. The development of advanced functionalities, like improved predictive diagnostics and integration with smart grids, will shape future innovation.
Major Players in the Battery Monitoring System Industry Ecosystem
- BMS Powersafe
- LION Smart GmbH
- Sensata Technologies Inc
- Leclanche SA
- Nuvation Energy
- RCRS Innovations Pvt Ltd
- Renesas Electronics Corporation
- Eberspaecher Vecture Inc
- Texas Instruments Incorporated
- Elithion Inc
Key Developments in Battery Monitoring System Industry Industry
- May 2022: A leading global vehicle manufacturer selected BorgWarner's BMS for its B-segment, C-segment, and light commercial vehicle platforms, signifying a major adoption of advanced BMS technology in the automotive sector.
- March 2022: Battrixx’s acquisition of Varos Technology signals a strategic move towards integrating advanced AI-driven analytics into BMS solutions, leading to improvements in battery life prediction and performance monitoring.
Strategic Battery Monitoring System Industry Market Forecast
The BMS market is expected to experience robust growth in the coming years, driven by the aforementioned factors. Continued technological advancements, increasing demand for electric vehicles, and growing investments in renewable energy storage will shape market dynamics. The market presents a compelling investment opportunity for both established players and newcomers, provided they possess the necessary technological expertise and strategic foresight to overcome the challenges outlined in this report.
Battery Monitoring System Industry Segmentation
-
1. Application
- 1.1. Stationary
- 1.2. Portable
- 1.3. Transportation
Battery Monitoring System Industry Segmentation By Geography
-
1. North America
- 1.1. United States
- 1.2. Canada
- 1.3. Rest of North America
-
2. Europe
- 2.1. Germany
- 2.2. Francy
- 2.3. Italy
- 2.4. United Kingdom
- 2.5. Russian Federation
- 2.6. Rest of Europe
-
3. Asia Pacific
- 3.1. China
- 3.2. India
- 3.3. Japan
- 3.4. South Korea
- 3.5. Rest of Asia Pacific
-
4. South America
- 4.1. Brazil
- 4.2. Argentina
- 4.3. Rest of South America
-
5. Middle East and Africa
- 5.1. Saudi Arabia
- 5.2. United Arab Emirates
- 5.3. South Africa
- 5.4. Rest of Middle East and Africa
Battery Monitoring System Industry REPORT HIGHLIGHTS
| Aspects | Details |
|---|---|
| Study Period | 2019-2033 |
| Base Year | 2024 |
| Estimated Year | 2025 |
| Forecast Period | 2025-2033 |
| Historical Period | 2019-2024 |
| Growth Rate | CAGR of 4.85% from 2019-2033 |
| Segmentation |
|
Table of Contents
- 1. Introduction
- 1.1. Research Scope
- 1.2. Market Segmentation
- 1.3. Research Methodology
- 1.4. Definitions and Assumptions
- 2. Executive Summary
- 2.1. Introduction
- 3. Market Dynamics
- 3.1. Introduction
- 3.2. Market Drivers
- 3.2.1. 4.; Global Inclination towards Renewable-based Power Generation4.; Growing Power Demand in Line with the Increasing Population
- 3.3. Market Restrains
- 3.3.1. 4.; High Initial Cost
- 3.4. Market Trends
- 3.4.1. Transportation Segment Expected to Dominate the Market
- 4. Market Factor Analysis
- 4.1. Porters Five Forces
- 4.2. Supply/Value Chain
- 4.3. PESTEL analysis
- 4.4. Market Entropy
- 4.5. Patent/Trademark Analysis
- 5. Global Battery Monitoring System Industry Analysis, Insights and Forecast, 2019-2031
- 5.1. Market Analysis, Insights and Forecast - by Application
- 5.1.1. Stationary
- 5.1.2. Portable
- 5.1.3. Transportation
- 5.2. Market Analysis, Insights and Forecast - by Region
- 5.2.1. North America
- 5.2.2. Europe
- 5.2.3. Asia Pacific
- 5.2.4. South America
- 5.2.5. Middle East and Africa
- 5.1. Market Analysis, Insights and Forecast - by Application
- 6. North America Battery Monitoring System Industry Analysis, Insights and Forecast, 2019-2031
- 6.1. Market Analysis, Insights and Forecast - by Application
- 6.1.1. Stationary
- 6.1.2. Portable
- 6.1.3. Transportation
- 6.1. Market Analysis, Insights and Forecast - by Application
- 7. Europe Battery Monitoring System Industry Analysis, Insights and Forecast, 2019-2031
- 7.1. Market Analysis, Insights and Forecast - by Application
- 7.1.1. Stationary
- 7.1.2. Portable
- 7.1.3. Transportation
- 7.1. Market Analysis, Insights and Forecast - by Application
- 8. Asia Pacific Battery Monitoring System Industry Analysis, Insights and Forecast, 2019-2031
- 8.1. Market Analysis, Insights and Forecast - by Application
- 8.1.1. Stationary
- 8.1.2. Portable
- 8.1.3. Transportation
- 8.1. Market Analysis, Insights and Forecast - by Application
- 9. South America Battery Monitoring System Industry Analysis, Insights and Forecast, 2019-2031
- 9.1. Market Analysis, Insights and Forecast - by Application
- 9.1.1. Stationary
- 9.1.2. Portable
- 9.1.3. Transportation
- 9.1. Market Analysis, Insights and Forecast - by Application
- 10. Middle East and Africa Battery Monitoring System Industry Analysis, Insights and Forecast, 2019-2031
- 10.1. Market Analysis, Insights and Forecast - by Application
- 10.1.1. Stationary
- 10.1.2. Portable
- 10.1.3. Transportation
- 10.1. Market Analysis, Insights and Forecast - by Application
- 11. North America Battery Monitoring System Industry Analysis, Insights and Forecast, 2019-2031
- 11.1. Market Analysis, Insights and Forecast - By Country/Sub-region
- 11.1.1 United States
- 11.1.2 Canada
- 11.1.3 Rest of North America
- 12. Europe Battery Monitoring System Industry Analysis, Insights and Forecast, 2019-2031
- 12.1. Market Analysis, Insights and Forecast - By Country/Sub-region
- 12.1.1 Germany
- 12.1.2 Francy
- 12.1.3 Italy
- 12.1.4 United Kingdom
- 12.1.5 Russian Federation
- 12.1.6 Rest of Europe
- 13. Asia Pacific Battery Monitoring System Industry Analysis, Insights and Forecast, 2019-2031
- 13.1. Market Analysis, Insights and Forecast - By Country/Sub-region
- 13.1.1 China
- 13.1.2 India
- 13.1.3 Japan
- 13.1.4 South Korea
- 13.1.5 Rest of Asia Pacific
- 14. South America Battery Monitoring System Industry Analysis, Insights and Forecast, 2019-2031
- 14.1. Market Analysis, Insights and Forecast - By Country/Sub-region
- 14.1.1 Brazil
- 14.1.2 Argentina
- 14.1.3 Rest of South America
- 15. Middle East and Africa Battery Monitoring System Industry Analysis, Insights and Forecast, 2019-2031
- 15.1. Market Analysis, Insights and Forecast - By Country/Sub-region
- 15.1.1 Saudi Arabia
- 15.1.2 United Arab Emirates
- 15.1.3 South Africa
- 15.1.4 Rest of Middle East and Africa
- 16. Competitive Analysis
- 16.1. Global Market Share Analysis 2024
- 16.2. Company Profiles
- 16.2.1 BMS Powersafe*List Not Exhaustive
- 16.2.1.1. Overview
- 16.2.1.2. Products
- 16.2.1.3. SWOT Analysis
- 16.2.1.4. Recent Developments
- 16.2.1.5. Financials (Based on Availability)
- 16.2.2 LION Smart GmbH
- 16.2.2.1. Overview
- 16.2.2.2. Products
- 16.2.2.3. SWOT Analysis
- 16.2.2.4. Recent Developments
- 16.2.2.5. Financials (Based on Availability)
- 16.2.3 Sensata Technologies Inc
- 16.2.3.1. Overview
- 16.2.3.2. Products
- 16.2.3.3. SWOT Analysis
- 16.2.3.4. Recent Developments
- 16.2.3.5. Financials (Based on Availability)
- 16.2.4 Leclanche SA
- 16.2.4.1. Overview
- 16.2.4.2. Products
- 16.2.4.3. SWOT Analysis
- 16.2.4.4. Recent Developments
- 16.2.4.5. Financials (Based on Availability)
- 16.2.5 Nuvation Energy
- 16.2.5.1. Overview
- 16.2.5.2. Products
- 16.2.5.3. SWOT Analysis
- 16.2.5.4. Recent Developments
- 16.2.5.5. Financials (Based on Availability)
- 16.2.6 RCRS Innovations Pvt Ltd
- 16.2.6.1. Overview
- 16.2.6.2. Products
- 16.2.6.3. SWOT Analysis
- 16.2.6.4. Recent Developments
- 16.2.6.5. Financials (Based on Availability)
- 16.2.7 Renesas Electronics Corporation
- 16.2.7.1. Overview
- 16.2.7.2. Products
- 16.2.7.3. SWOT Analysis
- 16.2.7.4. Recent Developments
- 16.2.7.5. Financials (Based on Availability)
- 16.2.8 Eberspaecher Vecture Inc
- 16.2.8.1. Overview
- 16.2.8.2. Products
- 16.2.8.3. SWOT Analysis
- 16.2.8.4. Recent Developments
- 16.2.8.5. Financials (Based on Availability)
- 16.2.9 Texas Instruments Incorporated
- 16.2.9.1. Overview
- 16.2.9.2. Products
- 16.2.9.3. SWOT Analysis
- 16.2.9.4. Recent Developments
- 16.2.9.5. Financials (Based on Availability)
- 16.2.10 Elithion Inc
- 16.2.10.1. Overview
- 16.2.10.2. Products
- 16.2.10.3. SWOT Analysis
- 16.2.10.4. Recent Developments
- 16.2.10.5. Financials (Based on Availability)
- 16.2.1 BMS Powersafe*List Not Exhaustive
List of Figures
- Figure 1: Global Battery Monitoring System Industry Revenue Breakdown (Million, %) by Region 2024 & 2032
- Figure 2: Global Battery Monitoring System Industry Volume Breakdown (K Units, %) by Region 2024 & 2032
- Figure 3: North America Battery Monitoring System Industry Revenue (Million), by Country 2024 & 2032
- Figure 4: North America Battery Monitoring System Industry Volume (K Units), by Country 2024 & 2032
- Figure 5: North America Battery Monitoring System Industry Revenue Share (%), by Country 2024 & 2032
- Figure 6: North America Battery Monitoring System Industry Volume Share (%), by Country 2024 & 2032
- Figure 7: Europe Battery Monitoring System Industry Revenue (Million), by Country 2024 & 2032
- Figure 8: Europe Battery Monitoring System Industry Volume (K Units), by Country 2024 & 2032
- Figure 9: Europe Battery Monitoring System Industry Revenue Share (%), by Country 2024 & 2032
- Figure 10: Europe Battery Monitoring System Industry Volume Share (%), by Country 2024 & 2032
- Figure 11: Asia Pacific Battery Monitoring System Industry Revenue (Million), by Country 2024 & 2032
- Figure 12: Asia Pacific Battery Monitoring System Industry Volume (K Units), by Country 2024 & 2032
- Figure 13: Asia Pacific Battery Monitoring System Industry Revenue Share (%), by Country 2024 & 2032
- Figure 14: Asia Pacific Battery Monitoring System Industry Volume Share (%), by Country 2024 & 2032
- Figure 15: South America Battery Monitoring System Industry Revenue (Million), by Country 2024 & 2032
- Figure 16: South America Battery Monitoring System Industry Volume (K Units), by Country 2024 & 2032
- Figure 17: South America Battery Monitoring System Industry Revenue Share (%), by Country 2024 & 2032
- Figure 18: South America Battery Monitoring System Industry Volume Share (%), by Country 2024 & 2032
- Figure 19: Middle East and Africa Battery Monitoring System Industry Revenue (Million), by Country 2024 & 2032
- Figure 20: Middle East and Africa Battery Monitoring System Industry Volume (K Units), by Country 2024 & 2032
- Figure 21: Middle East and Africa Battery Monitoring System Industry Revenue Share (%), by Country 2024 & 2032
- Figure 22: Middle East and Africa Battery Monitoring System Industry Volume Share (%), by Country 2024 & 2032
- Figure 23: North America Battery Monitoring System Industry Revenue (Million), by Application 2024 & 2032
- Figure 24: North America Battery Monitoring System Industry Volume (K Units), by Application 2024 & 2032
- Figure 25: North America Battery Monitoring System Industry Revenue Share (%), by Application 2024 & 2032
- Figure 26: North America Battery Monitoring System Industry Volume Share (%), by Application 2024 & 2032
- Figure 27: North America Battery Monitoring System Industry Revenue (Million), by Country 2024 & 2032
- Figure 28: North America Battery Monitoring System Industry Volume (K Units), by Country 2024 & 2032
- Figure 29: North America Battery Monitoring System Industry Revenue Share (%), by Country 2024 & 2032
- Figure 30: North America Battery Monitoring System Industry Volume Share (%), by Country 2024 & 2032
- Figure 31: Europe Battery Monitoring System Industry Revenue (Million), by Application 2024 & 2032
- Figure 32: Europe Battery Monitoring System Industry Volume (K Units), by Application 2024 & 2032
- Figure 33: Europe Battery Monitoring System Industry Revenue Share (%), by Application 2024 & 2032
- Figure 34: Europe Battery Monitoring System Industry Volume Share (%), by Application 2024 & 2032
- Figure 35: Europe Battery Monitoring System Industry Revenue (Million), by Country 2024 & 2032
- Figure 36: Europe Battery Monitoring System Industry Volume (K Units), by Country 2024 & 2032
- Figure 37: Europe Battery Monitoring System Industry Revenue Share (%), by Country 2024 & 2032
- Figure 38: Europe Battery Monitoring System Industry Volume Share (%), by Country 2024 & 2032
- Figure 39: Asia Pacific Battery Monitoring System Industry Revenue (Million), by Application 2024 & 2032
- Figure 40: Asia Pacific Battery Monitoring System Industry Volume (K Units), by Application 2024 & 2032
- Figure 41: Asia Pacific Battery Monitoring System Industry Revenue Share (%), by Application 2024 & 2032
- Figure 42: Asia Pacific Battery Monitoring System Industry Volume Share (%), by Application 2024 & 2032
- Figure 43: Asia Pacific Battery Monitoring System Industry Revenue (Million), by Country 2024 & 2032
- Figure 44: Asia Pacific Battery Monitoring System Industry Volume (K Units), by Country 2024 & 2032
- Figure 45: Asia Pacific Battery Monitoring System Industry Revenue Share (%), by Country 2024 & 2032
- Figure 46: Asia Pacific Battery Monitoring System Industry Volume Share (%), by Country 2024 & 2032
- Figure 47: South America Battery Monitoring System Industry Revenue (Million), by Application 2024 & 2032
- Figure 48: South America Battery Monitoring System Industry Volume (K Units), by Application 2024 & 2032
- Figure 49: South America Battery Monitoring System Industry Revenue Share (%), by Application 2024 & 2032
- Figure 50: South America Battery Monitoring System Industry Volume Share (%), by Application 2024 & 2032
- Figure 51: South America Battery Monitoring System Industry Revenue (Million), by Country 2024 & 2032
- Figure 52: South America Battery Monitoring System Industry Volume (K Units), by Country 2024 & 2032
- Figure 53: South America Battery Monitoring System Industry Revenue Share (%), by Country 2024 & 2032
- Figure 54: South America Battery Monitoring System Industry Volume Share (%), by Country 2024 & 2032
- Figure 55: Middle East and Africa Battery Monitoring System Industry Revenue (Million), by Application 2024 & 2032
- Figure 56: Middle East and Africa Battery Monitoring System Industry Volume (K Units), by Application 2024 & 2032
- Figure 57: Middle East and Africa Battery Monitoring System Industry Revenue Share (%), by Application 2024 & 2032
- Figure 58: Middle East and Africa Battery Monitoring System Industry Volume Share (%), by Application 2024 & 2032
- Figure 59: Middle East and Africa Battery Monitoring System Industry Revenue (Million), by Country 2024 & 2032
- Figure 60: Middle East and Africa Battery Monitoring System Industry Volume (K Units), by Country 2024 & 2032
- Figure 61: Middle East and Africa Battery Monitoring System Industry Revenue Share (%), by Country 2024 & 2032
- Figure 62: Middle East and Africa Battery Monitoring System Industry Volume Share (%), by Country 2024 & 2032
List of Tables
- Table 1: Global Battery Monitoring System Industry Revenue Million Forecast, by Region 2019 & 2032
- Table 2: Global Battery Monitoring System Industry Volume K Units Forecast, by Region 2019 & 2032
- Table 3: Global Battery Monitoring System Industry Revenue Million Forecast, by Application 2019 & 2032
- Table 4: Global Battery Monitoring System Industry Volume K Units Forecast, by Application 2019 & 2032
- Table 5: Global Battery Monitoring System Industry Revenue Million Forecast, by Region 2019 & 2032
- Table 6: Global Battery Monitoring System Industry Volume K Units Forecast, by Region 2019 & 2032
- Table 7: Global Battery Monitoring System Industry Revenue Million Forecast, by Country 2019 & 2032
- Table 8: Global Battery Monitoring System Industry Volume K Units Forecast, by Country 2019 & 2032
- Table 9: United States Battery Monitoring System Industry Revenue (Million) Forecast, by Application 2019 & 2032
- Table 10: United States Battery Monitoring System Industry Volume (K Units) Forecast, by Application 2019 & 2032
- Table 11: Canada Battery Monitoring System Industry Revenue (Million) Forecast, by Application 2019 & 2032
- Table 12: Canada Battery Monitoring System Industry Volume (K Units) Forecast, by Application 2019 & 2032
- Table 13: Rest of North America Battery Monitoring System Industry Revenue (Million) Forecast, by Application 2019 & 2032
- Table 14: Rest of North America Battery Monitoring System Industry Volume (K Units) Forecast, by Application 2019 & 2032
- Table 15: Global Battery Monitoring System Industry Revenue Million Forecast, by Country 2019 & 2032
- Table 16: Global Battery Monitoring System Industry Volume K Units Forecast, by Country 2019 & 2032
- Table 17: Germany Battery Monitoring System Industry Revenue (Million) Forecast, by Application 2019 & 2032
- Table 18: Germany Battery Monitoring System Industry Volume (K Units) Forecast, by Application 2019 & 2032
- Table 19: Francy Battery Monitoring System Industry Revenue (Million) Forecast, by Application 2019 & 2032
- Table 20: Francy Battery Monitoring System Industry Volume (K Units) Forecast, by Application 2019 & 2032
- Table 21: Italy Battery Monitoring System Industry Revenue (Million) Forecast, by Application 2019 & 2032
- Table 22: Italy Battery Monitoring System Industry Volume (K Units) Forecast, by Application 2019 & 2032
- Table 23: United Kingdom Battery Monitoring System Industry Revenue (Million) Forecast, by Application 2019 & 2032
- Table 24: United Kingdom Battery Monitoring System Industry Volume (K Units) Forecast, by Application 2019 & 2032
- Table 25: Russian Federation Battery Monitoring System Industry Revenue (Million) Forecast, by Application 2019 & 2032
- Table 26: Russian Federation Battery Monitoring System Industry Volume (K Units) Forecast, by Application 2019 & 2032
- Table 27: Rest of Europe Battery Monitoring System Industry Revenue (Million) Forecast, by Application 2019 & 2032
- Table 28: Rest of Europe Battery Monitoring System Industry Volume (K Units) Forecast, by Application 2019 & 2032
- Table 29: Global Battery Monitoring System Industry Revenue Million Forecast, by Country 2019 & 2032
- Table 30: Global Battery Monitoring System Industry Volume K Units Forecast, by Country 2019 & 2032
- Table 31: China Battery Monitoring System Industry Revenue (Million) Forecast, by Application 2019 & 2032
- Table 32: China Battery Monitoring System Industry Volume (K Units) Forecast, by Application 2019 & 2032
- Table 33: India Battery Monitoring System Industry Revenue (Million) Forecast, by Application 2019 & 2032
- Table 34: India Battery Monitoring System Industry Volume (K Units) Forecast, by Application 2019 & 2032
- Table 35: Japan Battery Monitoring System Industry Revenue (Million) Forecast, by Application 2019 & 2032
- Table 36: Japan Battery Monitoring System Industry Volume (K Units) Forecast, by Application 2019 & 2032
- Table 37: South Korea Battery Monitoring System Industry Revenue (Million) Forecast, by Application 2019 & 2032
- Table 38: South Korea Battery Monitoring System Industry Volume (K Units) Forecast, by Application 2019 & 2032
- Table 39: Rest of Asia Pacific Battery Monitoring System Industry Revenue (Million) Forecast, by Application 2019 & 2032
- Table 40: Rest of Asia Pacific Battery Monitoring System Industry Volume (K Units) Forecast, by Application 2019 & 2032
- Table 41: Global Battery Monitoring System Industry Revenue Million Forecast, by Country 2019 & 2032
- Table 42: Global Battery Monitoring System Industry Volume K Units Forecast, by Country 2019 & 2032
- Table 43: Brazil Battery Monitoring System Industry Revenue (Million) Forecast, by Application 2019 & 2032
- Table 44: Brazil Battery Monitoring System Industry Volume (K Units) Forecast, by Application 2019 & 2032
- Table 45: Argentina Battery Monitoring System Industry Revenue (Million) Forecast, by Application 2019 & 2032
- Table 46: Argentina Battery Monitoring System Industry Volume (K Units) Forecast, by Application 2019 & 2032
- Table 47: Rest of South America Battery Monitoring System Industry Revenue (Million) Forecast, by Application 2019 & 2032
- Table 48: Rest of South America Battery Monitoring System Industry Volume (K Units) Forecast, by Application 2019 & 2032
- Table 49: Global Battery Monitoring System Industry Revenue Million Forecast, by Country 2019 & 2032
- Table 50: Global Battery Monitoring System Industry Volume K Units Forecast, by Country 2019 & 2032
- Table 51: Saudi Arabia Battery Monitoring System Industry Revenue (Million) Forecast, by Application 2019 & 2032
- Table 52: Saudi Arabia Battery Monitoring System Industry Volume (K Units) Forecast, by Application 2019 & 2032
- Table 53: United Arab Emirates Battery Monitoring System Industry Revenue (Million) Forecast, by Application 2019 & 2032
- Table 54: United Arab Emirates Battery Monitoring System Industry Volume (K Units) Forecast, by Application 2019 & 2032
- Table 55: South Africa Battery Monitoring System Industry Revenue (Million) Forecast, by Application 2019 & 2032
- Table 56: South Africa Battery Monitoring System Industry Volume (K Units) Forecast, by Application 2019 & 2032
- Table 57: Rest of Middle East and Africa Battery Monitoring System Industry Revenue (Million) Forecast, by Application 2019 & 2032
- Table 58: Rest of Middle East and Africa Battery Monitoring System Industry Volume (K Units) Forecast, by Application 2019 & 2032
- Table 59: Global Battery Monitoring System Industry Revenue Million Forecast, by Application 2019 & 2032
- Table 60: Global Battery Monitoring System Industry Volume K Units Forecast, by Application 2019 & 2032
- Table 61: Global Battery Monitoring System Industry Revenue Million Forecast, by Country 2019 & 2032
- Table 62: Global Battery Monitoring System Industry Volume K Units Forecast, by Country 2019 & 2032
- Table 63: United States Battery Monitoring System Industry Revenue (Million) Forecast, by Application 2019 & 2032
- Table 64: United States Battery Monitoring System Industry Volume (K Units) Forecast, by Application 2019 & 2032
- Table 65: Canada Battery Monitoring System Industry Revenue (Million) Forecast, by Application 2019 & 2032
- Table 66: Canada Battery Monitoring System Industry Volume (K Units) Forecast, by Application 2019 & 2032
- Table 67: Rest of North America Battery Monitoring System Industry Revenue (Million) Forecast, by Application 2019 & 2032
- Table 68: Rest of North America Battery Monitoring System Industry Volume (K Units) Forecast, by Application 2019 & 2032
- Table 69: Global Battery Monitoring System Industry Revenue Million Forecast, by Application 2019 & 2032
- Table 70: Global Battery Monitoring System Industry Volume K Units Forecast, by Application 2019 & 2032
- Table 71: Global Battery Monitoring System Industry Revenue Million Forecast, by Country 2019 & 2032
- Table 72: Global Battery Monitoring System Industry Volume K Units Forecast, by Country 2019 & 2032
- Table 73: Germany Battery Monitoring System Industry Revenue (Million) Forecast, by Application 2019 & 2032
- Table 74: Germany Battery Monitoring System Industry Volume (K Units) Forecast, by Application 2019 & 2032
- Table 75: Francy Battery Monitoring System Industry Revenue (Million) Forecast, by Application 2019 & 2032
- Table 76: Francy Battery Monitoring System Industry Volume (K Units) Forecast, by Application 2019 & 2032
- Table 77: Italy Battery Monitoring System Industry Revenue (Million) Forecast, by Application 2019 & 2032
- Table 78: Italy Battery Monitoring System Industry Volume (K Units) Forecast, by Application 2019 & 2032
- Table 79: United Kingdom Battery Monitoring System Industry Revenue (Million) Forecast, by Application 2019 & 2032
- Table 80: United Kingdom Battery Monitoring System Industry Volume (K Units) Forecast, by Application 2019 & 2032
- Table 81: Russian Federation Battery Monitoring System Industry Revenue (Million) Forecast, by Application 2019 & 2032
- Table 82: Russian Federation Battery Monitoring System Industry Volume (K Units) Forecast, by Application 2019 & 2032
- Table 83: Rest of Europe Battery Monitoring System Industry Revenue (Million) Forecast, by Application 2019 & 2032
- Table 84: Rest of Europe Battery Monitoring System Industry Volume (K Units) Forecast, by Application 2019 & 2032
- Table 85: Global Battery Monitoring System Industry Revenue Million Forecast, by Application 2019 & 2032
- Table 86: Global Battery Monitoring System Industry Volume K Units Forecast, by Application 2019 & 2032
- Table 87: Global Battery Monitoring System Industry Revenue Million Forecast, by Country 2019 & 2032
- Table 88: Global Battery Monitoring System Industry Volume K Units Forecast, by Country 2019 & 2032
- Table 89: China Battery Monitoring System Industry Revenue (Million) Forecast, by Application 2019 & 2032
- Table 90: China Battery Monitoring System Industry Volume (K Units) Forecast, by Application 2019 & 2032
- Table 91: India Battery Monitoring System Industry Revenue (Million) Forecast, by Application 2019 & 2032
- Table 92: India Battery Monitoring System Industry Volume (K Units) Forecast, by Application 2019 & 2032
- Table 93: Japan Battery Monitoring System Industry Revenue (Million) Forecast, by Application 2019 & 2032
- Table 94: Japan Battery Monitoring System Industry Volume (K Units) Forecast, by Application 2019 & 2032
- Table 95: South Korea Battery Monitoring System Industry Revenue (Million) Forecast, by Application 2019 & 2032
- Table 96: South Korea Battery Monitoring System Industry Volume (K Units) Forecast, by Application 2019 & 2032
- Table 97: Rest of Asia Pacific Battery Monitoring System Industry Revenue (Million) Forecast, by Application 2019 & 2032
- Table 98: Rest of Asia Pacific Battery Monitoring System Industry Volume (K Units) Forecast, by Application 2019 & 2032
- Table 99: Global Battery Monitoring System Industry Revenue Million Forecast, by Application 2019 & 2032
- Table 100: Global Battery Monitoring System Industry Volume K Units Forecast, by Application 2019 & 2032
- Table 101: Global Battery Monitoring System Industry Revenue Million Forecast, by Country 2019 & 2032
- Table 102: Global Battery Monitoring System Industry Volume K Units Forecast, by Country 2019 & 2032
- Table 103: Brazil Battery Monitoring System Industry Revenue (Million) Forecast, by Application 2019 & 2032
- Table 104: Brazil Battery Monitoring System Industry Volume (K Units) Forecast, by Application 2019 & 2032
- Table 105: Argentina Battery Monitoring System Industry Revenue (Million) Forecast, by Application 2019 & 2032
- Table 106: Argentina Battery Monitoring System Industry Volume (K Units) Forecast, by Application 2019 & 2032
- Table 107: Rest of South America Battery Monitoring System Industry Revenue (Million) Forecast, by Application 2019 & 2032
- Table 108: Rest of South America Battery Monitoring System Industry Volume (K Units) Forecast, by Application 2019 & 2032
- Table 109: Global Battery Monitoring System Industry Revenue Million Forecast, by Application 2019 & 2032
- Table 110: Global Battery Monitoring System Industry Volume K Units Forecast, by Application 2019 & 2032
- Table 111: Global Battery Monitoring System Industry Revenue Million Forecast, by Country 2019 & 2032
- Table 112: Global Battery Monitoring System Industry Volume K Units Forecast, by Country 2019 & 2032
- Table 113: Saudi Arabia Battery Monitoring System Industry Revenue (Million) Forecast, by Application 2019 & 2032
- Table 114: Saudi Arabia Battery Monitoring System Industry Volume (K Units) Forecast, by Application 2019 & 2032
- Table 115: United Arab Emirates Battery Monitoring System Industry Revenue (Million) Forecast, by Application 2019 & 2032
- Table 116: United Arab Emirates Battery Monitoring System Industry Volume (K Units) Forecast, by Application 2019 & 2032
- Table 117: South Africa Battery Monitoring System Industry Revenue (Million) Forecast, by Application 2019 & 2032
- Table 118: South Africa Battery Monitoring System Industry Volume (K Units) Forecast, by Application 2019 & 2032
- Table 119: Rest of Middle East and Africa Battery Monitoring System Industry Revenue (Million) Forecast, by Application 2019 & 2032
- Table 120: Rest of Middle East and Africa Battery Monitoring System Industry Volume (K Units) Forecast, by Application 2019 & 2032
Frequently Asked Questions
1. What is the projected Compound Annual Growth Rate (CAGR) of the Battery Monitoring System Industry?
The projected CAGR is approximately 4.85%.
2. Which companies are prominent players in the Battery Monitoring System Industry?
Key companies in the market include BMS Powersafe*List Not Exhaustive, LION Smart GmbH, Sensata Technologies Inc, Leclanche SA, Nuvation Energy, RCRS Innovations Pvt Ltd, Renesas Electronics Corporation, Eberspaecher Vecture Inc, Texas Instruments Incorporated, Elithion Inc.
3. What are the main segments of the Battery Monitoring System Industry?
The market segments include Application.
4. Can you provide details about the market size?
The market size is estimated to be USD 9.30 Million as of 2022.
5. What are some drivers contributing to market growth?
4.; Global Inclination towards Renewable-based Power Generation4.; Growing Power Demand in Line with the Increasing Population.
6. What are the notable trends driving market growth?
Transportation Segment Expected to Dominate the Market.
7. Are there any restraints impacting market growth?
4.; High Initial Cost.
8. Can you provide examples of recent developments in the market?
In May 2022, a leading global vehicle manufacturer selected BorgWarner's battery management system (BMS) to fit its entire B-segment, C-segment, and light commercial vehicle platforms. Starting mid-2023, the new BorgWarner BMS technology is expected to optimize battery pack performance, safety, and longevity. BorgWarner's battery management system for hybrid and electric vehicles contains a master control unit connected to multiple cell management control units. It is designed to monitor the state of charge, health, and battery temperature of each battery cell and also precisely measure battery pack current and voltage.
9. What pricing options are available for accessing the report?
Pricing options include single-user, multi-user, and enterprise licenses priced at USD 4750, USD 5250, and USD 8750 respectively.
10. Is the market size provided in terms of value or volume?
The market size is provided in terms of value, measured in Million and volume, measured in K Units.
11. Are there any specific market keywords associated with the report?
Yes, the market keyword associated with the report is "Battery Monitoring System Industry," which aids in identifying and referencing the specific market segment covered.
12. How do I determine which pricing option suits my needs best?
The pricing options vary based on user requirements and access needs. Individual users may opt for single-user licenses, while businesses requiring broader access may choose multi-user or enterprise licenses for cost-effective access to the report.
13. Are there any additional resources or data provided in the Battery Monitoring System Industry report?
While the report offers comprehensive insights, it's advisable to review the specific contents or supplementary materials provided to ascertain if additional resources or data are available.
14. How can I stay updated on further developments or reports in the Battery Monitoring System Industry?
To stay informed about further developments, trends, and reports in the Battery Monitoring System Industry, consider subscribing to industry newsletters, following relevant companies and organizations, or regularly checking reputable industry news sources and publications.
Methodology
Step 1 - Identification of Relevant Samples Size from Population Database


Step 2 - Approaches for Defining Global Market Size (Value, Volume* & Price*)

Note*: In applicable scenarios
Step 3 - Data Sources
Primary Research
- Web Analytics
- Survey Reports
- Research Institute
- Latest Research Reports
- Opinion Leaders
Secondary Research
- Annual Reports
- White Paper
- Latest Press Release
- Industry Association
- Paid Database
- Investor Presentations

Step 4 - Data Triangulation
Involves using different sources of information in order to increase the validity of a study
These sources are likely to be stakeholders in a program - participants, other researchers, program staff, other community members, and so on.
Then we put all data in single framework & apply various statistical tools to find out the dynamic on the market.
During the analysis stage, feedback from the stakeholder groups would be compared to determine areas of agreement as well as areas of divergence
