

Key Insights
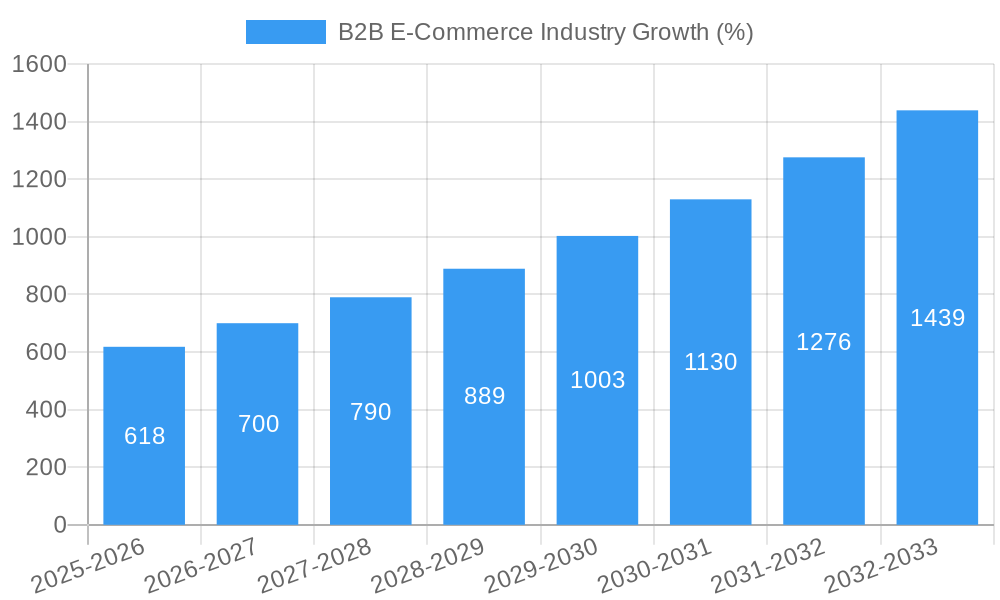
The B2B e-commerce market is experiencing robust growth, projected to maintain a Compound Annual Growth Rate (CAGR) of 12.36% from 2025 to 2033. This expansion is fueled by several key drivers. The increasing adoption of digital technologies across businesses, coupled with the inherent efficiency and cost-effectiveness of online transactions, is significantly accelerating market penetration. Furthermore, the rising demand for improved supply chain visibility and streamlined procurement processes is pushing businesses to embrace B2B e-commerce platforms. Globalization and the expansion of international trade are also contributing factors, enabling businesses to access wider markets and supplier networks. Market segmentation reveals strong growth in both direct sales and marketplace sales channels, reflecting diverse business needs and preferences. While challenges remain, such as cybersecurity concerns and the need for robust digital infrastructure, the long-term outlook for the B2B e-commerce market remains incredibly positive. The competitive landscape is dynamic, with established players like Alibaba, Amazon, and eBay competing alongside specialized B2B marketplaces like IndiaMART and DIYTrade. Regional variations exist, with North America and Europe currently holding significant market share, but rapid growth is anticipated in Asia-Pacific and other emerging markets as digital adoption accelerates. This growth is further fuelled by government initiatives promoting digitalization and e-commerce adoption, alongside increasing mobile penetration driving accessibility.
The study period (2019-2033), with a base year of 2025, indicates a significant historical period of growth already underway. The forecast period (2025-2033) projects a continued upward trajectory, driven by factors like the integration of advanced technologies like AI and machine learning to improve business processes within the e-commerce space. The substantial number of companies operating in this sector, ranging from established giants to specialized niche players, points to the diverse and competitive environment of the B2B e-commerce industry. The geographical spread across North America, Europe, Asia-Pacific, South America, and the Middle East and Africa highlights the global nature of this market and indicates substantial growth opportunities across various regions depending on their level of digital adoption and economic development. Understanding the specific nuances within each region is crucial for strategic market entry and competitive success. The continued development and refinement of B2B e-commerce platforms will be key to adapting to evolving customer needs and technological advancements within the rapidly evolving digital landscape.

B2B E-Commerce Industry: A Comprehensive Market Report (2019-2033)
This insightful report provides a deep dive into the dynamic B2B e-commerce industry, projecting a market valuation exceeding $XX Million by 2033. With a study period spanning 2019-2033, a base year of 2025, and a forecast period from 2025-2033, this analysis offers invaluable insights for stakeholders seeking to navigate this rapidly evolving landscape. Key players like Amazon.com Inc, Alibaba Group, and eBay Inc are examined alongside emerging competitors, providing a comprehensive overview of the competitive arena. The report also delves into critical market segments, including Direct Sales and Marketplace Sales channels, revealing compelling growth projections and underlying trends.
B2B E-Commerce Industry Market Composition & Trends
The B2B e-commerce market exhibits a complex interplay of factors influencing its growth trajectory. Market concentration is moderate, with a few dominant players commanding significant shares but numerous smaller players contributing to a vibrant ecosystem. Innovation catalysts, such as AI-powered personalization and blockchain technology for supply chain transparency, are driving significant disruption. Regulatory landscapes, varying across regions, significantly impact market access and operations. Substitute products, including traditional wholesale models, pose ongoing competition. The end-user profile is diverse, encompassing SMEs to large enterprises, each with unique needs and buying behaviors. M&A activities are frequent, with deal values reaching hundreds of millions of dollars, reflecting the industry's consolidation and expansion.
- Market Share Distribution (2024): Amazon.com Inc (25%), Alibaba Group (20%), eBay Inc (15%), Others (40%).
- M&A Deal Values (2019-2024): Total exceeding $100 Million. Significant deals involving tech integrations and market expansions.
- Key Innovation Catalysts: AI-driven personalization, blockchain for supply chain management, advanced analytics for demand forecasting.
B2B E-Commerce Industry Industry Evolution
The B2B e-commerce industry has experienced phenomenal growth in recent years, fueled by technological advancements and shifting consumer demands. From 2019 to 2024, the market witnessed a Compound Annual Growth Rate (CAGR) of XX%, exceeding initial projections. Technological advancements, such as the rise of mobile commerce and the increasing adoption of cloud-based solutions, have significantly streamlined operations and expanded market reach. Shifting consumer demands towards personalized experiences, faster delivery, and greater transparency are driving innovation and shaping business models. The adoption of B2B marketplaces has surged, with a XX% increase in active users between 2020 and 2024, indicating a paradigm shift in procurement practices. Predictive analytics tools are proving crucial in anticipating market trends and optimizing inventory management, creating efficiency gains for businesses of all sizes. The forecast period (2025-2033) projects continued robust growth, driven by increasing digital adoption, globalization, and evolving customer expectations. The anticipated CAGR for this period is projected to be XX%, ultimately leading to a market exceeding $XX Million.
Leading Regions, Countries, or Segments in B2B E-Commerce Industry
North America and Asia currently dominate the B2B e-commerce landscape. While North America has a strong base in established e-commerce platforms and a mature technological infrastructure, Asia's high growth rate, driven by a burgeoning middle class and increasing internet penetration, has led to an explosion of new marketplaces and players. Marketplace Sales currently outpaces Direct Sales, driven by the convenience and scale offered by platforms like Alibaba and Amazon Business.
- Key Drivers for North America's Dominance:
- High levels of internet penetration and digital literacy.
- Strong technological infrastructure and investment in e-commerce solutions.
- Established regulatory frameworks supporting online transactions.
- Key Drivers for Asia's High Growth:
- Rapid expansion of internet and mobile phone usage.
- A large and rapidly growing middle class with increasing purchasing power.
- Government initiatives promoting digital commerce.
- By Channel Dominance: Marketplace sales leads due to increased convenience and scale, showing an XX% market share advantage.
B2B E-Commerce Industry Product Innovations
Recent innovations include AI-powered recommendation engines that personalize product suggestions, blockchain technologies to ensure supply chain transparency and security, and advanced analytics dashboards providing real-time business intelligence. These innovations enhance customer experience, reduce operational inefficiencies and improve overall business performance. Unique selling propositions increasingly focus on personalized service, customized solutions, and data-driven insights.
Propelling Factors for B2B E-Commerce Industry Growth
Several factors are propelling growth, including advancements in cloud computing, the proliferation of mobile devices and high-speed internet access, and supportive government policies facilitating digital commerce. The increasing adoption of e-procurement systems by large enterprises is significantly impacting sales. Furthermore, the shift towards omnichannel strategies, integrating online and offline sales, is broadening market reach and customer engagement.
Obstacles in the B2B E-Commerce Industry Market
Significant obstacles include cybersecurity concerns, supply chain disruptions leading to inventory management challenges (estimated impact of XX Million in 2024), and intense competition amongst established players and new entrants. Furthermore, variations in regulatory frameworks across different countries and regions pose challenges to scaling operations internationally.
Future Opportunities in B2B E-Commerce Industry
Emerging opportunities lie in the expansion into untapped markets, particularly in developing economies, and the integration of new technologies like augmented reality (AR) and virtual reality (VR) for product visualization and immersive shopping experiences. The growing demand for sustainability and ethical sourcing presents opportunities for businesses prioritizing environmentally conscious practices.
Major Players in the B2B E-Commerce Industry Ecosystem
- DIYTrade com
- IndiaMART InterMESH Ltd
- KOMPASS
- ChinaAseanTrade com
- Flipkart
- Amazon com Inc
- Alibaba Group
- eBay Inc
- eworldtrade com
- Quill Lincolnshire Inc
Key Developments in B2B E-Commerce Industry Industry
- July 2022: Golf Genius and RepSpark integrated platforms, streamlining golf shop ordering.
- August 2022: Razer Merchant Services partnered with Atome, expanding BNPL options. This partnership demonstrates the growing adoption of Buy Now Pay Later (BNPL) services in the B2B sector, impacting payment options and consumer behavior.
Strategic B2B E-Commerce Industry Market Forecast
The B2B e-commerce market is poised for continued robust growth, driven by technological innovation, increasing digital adoption among businesses of all sizes, and the expansion of e-commerce into new geographic markets. Future opportunities lie in the development of more sophisticated AI-powered tools, the expansion of cross-border e-commerce, and the continued integration of online and offline sales channels. The market is projected to reach $XX Million by 2033, representing significant growth potential for established players and new entrants alike.
B2B E-Commerce Industry Segmentation
-
1. Channel
- 1.1. Direct Sales
- 1.2. Marketplace Sales
B2B E-Commerce Industry Segmentation By Geography
- 1. North America
- 2. Europe
- 3. Asia Pacific
- 4. Latin America
- 5. Middle East and Africa

B2B E-Commerce Industry REPORT HIGHLIGHTS
| Aspects | Details |
|---|---|
| Study Period | 2019-2033 |
| Base Year | 2024 |
| Estimated Year | 2025 |
| Forecast Period | 2025-2033 |
| Historical Period | 2019-2024 |
| Growth Rate | CAGR of 12.36% from 2019-2033 |
| Segmentation |
|
Table of Contents
- 1. Introduction
- 1.1. Research Scope
- 1.2. Market Segmentation
- 1.3. Research Methodology
- 1.4. Definitions and Assumptions
- 2. Executive Summary
- 2.1. Introduction
- 3. Market Dynamics
- 3.1. Introduction
- 3.2. Market Drivers
- 3.2.1. Innovative Business Solutions and Increased digitalization in B2B e-commerce; Omnichannel Business Model
- 3.3. Market Restrains
- 3.3.1. Paid version of some applications can challenge further penetration
- 3.4. Market Trends
- 3.4.1. Increase in Digitalization across the B2B e-commerce is driving growth
- 4. Market Factor Analysis
- 4.1. Porters Five Forces
- 4.2. Supply/Value Chain
- 4.3. PESTEL analysis
- 4.4. Market Entropy
- 4.5. Patent/Trademark Analysis
- 5. Global B2B E-Commerce Industry Analysis, Insights and Forecast, 2019-2031
- 5.1. Market Analysis, Insights and Forecast - by Channel
- 5.1.1. Direct Sales
- 5.1.2. Marketplace Sales
- 5.2. Market Analysis, Insights and Forecast - by Region
- 5.2.1. North America
- 5.2.2. Europe
- 5.2.3. Asia Pacific
- 5.2.4. Latin America
- 5.2.5. Middle East and Africa
- 5.1. Market Analysis, Insights and Forecast - by Channel
- 6. North America B2B E-Commerce Industry Analysis, Insights and Forecast, 2019-2031
- 6.1. Market Analysis, Insights and Forecast - by Channel
- 6.1.1. Direct Sales
- 6.1.2. Marketplace Sales
- 6.1. Market Analysis, Insights and Forecast - by Channel
- 7. Europe B2B E-Commerce Industry Analysis, Insights and Forecast, 2019-2031
- 7.1. Market Analysis, Insights and Forecast - by Channel
- 7.1.1. Direct Sales
- 7.1.2. Marketplace Sales
- 7.1. Market Analysis, Insights and Forecast - by Channel
- 8. Asia Pacific B2B E-Commerce Industry Analysis, Insights and Forecast, 2019-2031
- 8.1. Market Analysis, Insights and Forecast - by Channel
- 8.1.1. Direct Sales
- 8.1.2. Marketplace Sales
- 8.1. Market Analysis, Insights and Forecast - by Channel
- 9. Latin America B2B E-Commerce Industry Analysis, Insights and Forecast, 2019-2031
- 9.1. Market Analysis, Insights and Forecast - by Channel
- 9.1.1. Direct Sales
- 9.1.2. Marketplace Sales
- 9.1. Market Analysis, Insights and Forecast - by Channel
- 10. Middle East and Africa B2B E-Commerce Industry Analysis, Insights and Forecast, 2019-2031
- 10.1. Market Analysis, Insights and Forecast - by Channel
- 10.1.1. Direct Sales
- 10.1.2. Marketplace Sales
- 10.1. Market Analysis, Insights and Forecast - by Channel
- 11. North America B2B E-Commerce Industry Analysis, Insights and Forecast, 2019-2031
- 11.1. Market Analysis, Insights and Forecast - By Country/Sub-region
- 11.1.1 United States
- 11.1.2 Canada
- 11.1.3 Mexico
- 12. Europe B2B E-Commerce Industry Analysis, Insights and Forecast, 2019-2031
- 12.1. Market Analysis, Insights and Forecast - By Country/Sub-region
- 12.1.1 Germany
- 12.1.2 United Kingdom
- 12.1.3 France
- 12.1.4 Spain
- 12.1.5 Italy
- 12.1.6 Spain
- 12.1.7 Belgium
- 12.1.8 Netherland
- 12.1.9 Nordics
- 12.1.10 Rest of Europe
- 13. Asia Pacific B2B E-Commerce Industry Analysis, Insights and Forecast, 2019-2031
- 13.1. Market Analysis, Insights and Forecast - By Country/Sub-region
- 13.1.1 China
- 13.1.2 Japan
- 13.1.3 India
- 13.1.4 South Korea
- 13.1.5 Southeast Asia
- 13.1.6 Australia
- 13.1.7 Indonesia
- 13.1.8 Phillipes
- 13.1.9 Singapore
- 13.1.10 Thailandc
- 13.1.11 Rest of Asia Pacific
- 14. South America B2B E-Commerce Industry Analysis, Insights and Forecast, 2019-2031
- 14.1. Market Analysis, Insights and Forecast - By Country/Sub-region
- 14.1.1 Brazil
- 14.1.2 Argentina
- 14.1.3 Peru
- 14.1.4 Chile
- 14.1.5 Colombia
- 14.1.6 Ecuador
- 14.1.7 Venezuela
- 14.1.8 Rest of South America
- 15. North America B2B E-Commerce Industry Analysis, Insights and Forecast, 2019-2031
- 15.1. Market Analysis, Insights and Forecast - By Country/Sub-region
- 15.1.1 United States
- 15.1.2 Canada
- 15.1.3 Mexico
- 16. MEA B2B E-Commerce Industry Analysis, Insights and Forecast, 2019-2031
- 16.1. Market Analysis, Insights and Forecast - By Country/Sub-region
- 16.1.1 United Arab Emirates
- 16.1.2 Saudi Arabia
- 16.1.3 South Africa
- 16.1.4 Rest of Middle East and Africa
- 17. Competitive Analysis
- 17.1. Global Market Share Analysis 2024
- 17.2. Company Profiles
- 17.2.1 DIYTrade com
- 17.2.1.1. Overview
- 17.2.1.2. Products
- 17.2.1.3. SWOT Analysis
- 17.2.1.4. Recent Developments
- 17.2.1.5. Financials (Based on Availability)
- 17.2.2 IndiaMART InterMESH Ltd
- 17.2.2.1. Overview
- 17.2.2.2. Products
- 17.2.2.3. SWOT Analysis
- 17.2.2.4. Recent Developments
- 17.2.2.5. Financials (Based on Availability)
- 17.2.3 KOMPASS
- 17.2.3.1. Overview
- 17.2.3.2. Products
- 17.2.3.3. SWOT Analysis
- 17.2.3.4. Recent Developments
- 17.2.3.5. Financials (Based on Availability)
- 17.2.4 ChinaAseanTrade com
- 17.2.4.1. Overview
- 17.2.4.2. Products
- 17.2.4.3. SWOT Analysis
- 17.2.4.4. Recent Developments
- 17.2.4.5. Financials (Based on Availability)
- 17.2.5 Flipkart
- 17.2.5.1. Overview
- 17.2.5.2. Products
- 17.2.5.3. SWOT Analysis
- 17.2.5.4. Recent Developments
- 17.2.5.5. Financials (Based on Availability)
- 17.2.6 Amazon com Inc
- 17.2.6.1. Overview
- 17.2.6.2. Products
- 17.2.6.3. SWOT Analysis
- 17.2.6.4. Recent Developments
- 17.2.6.5. Financials (Based on Availability)
- 17.2.7 Alibaba Group
- 17.2.7.1. Overview
- 17.2.7.2. Products
- 17.2.7.3. SWOT Analysis
- 17.2.7.4. Recent Developments
- 17.2.7.5. Financials (Based on Availability)
- 17.2.8 eBay Inc
- 17.2.8.1. Overview
- 17.2.8.2. Products
- 17.2.8.3. SWOT Analysis
- 17.2.8.4. Recent Developments
- 17.2.8.5. Financials (Based on Availability)
- 17.2.9 eworldtrade com
- 17.2.9.1. Overview
- 17.2.9.2. Products
- 17.2.9.3. SWOT Analysis
- 17.2.9.4. Recent Developments
- 17.2.9.5. Financials (Based on Availability)
- 17.2.10 Quill Lincolnshire Inc
- 17.2.10.1. Overview
- 17.2.10.2. Products
- 17.2.10.3. SWOT Analysis
- 17.2.10.4. Recent Developments
- 17.2.10.5. Financials (Based on Availability)
- 17.2.1 DIYTrade com
List of Figures
- Figure 1: Global B2B E-Commerce Industry Revenue Breakdown (Million, %) by Region 2024 & 2032
- Figure 2: Global B2B E-Commerce Industry Volume Breakdown (K Unit, %) by Region 2024 & 2032
- Figure 3: North America B2B E-Commerce Industry Revenue (Million), by Country 2024 & 2032
- Figure 4: North America B2B E-Commerce Industry Volume (K Unit), by Country 2024 & 2032
- Figure 5: North America B2B E-Commerce Industry Revenue Share (%), by Country 2024 & 2032
- Figure 6: North America B2B E-Commerce Industry Volume Share (%), by Country 2024 & 2032
- Figure 7: Europe B2B E-Commerce Industry Revenue (Million), by Country 2024 & 2032
- Figure 8: Europe B2B E-Commerce Industry Volume (K Unit), by Country 2024 & 2032
- Figure 9: Europe B2B E-Commerce Industry Revenue Share (%), by Country 2024 & 2032
- Figure 10: Europe B2B E-Commerce Industry Volume Share (%), by Country 2024 & 2032
- Figure 11: Asia Pacific B2B E-Commerce Industry Revenue (Million), by Country 2024 & 2032
- Figure 12: Asia Pacific B2B E-Commerce Industry Volume (K Unit), by Country 2024 & 2032
- Figure 13: Asia Pacific B2B E-Commerce Industry Revenue Share (%), by Country 2024 & 2032
- Figure 14: Asia Pacific B2B E-Commerce Industry Volume Share (%), by Country 2024 & 2032
- Figure 15: South America B2B E-Commerce Industry Revenue (Million), by Country 2024 & 2032
- Figure 16: South America B2B E-Commerce Industry Volume (K Unit), by Country 2024 & 2032
- Figure 17: South America B2B E-Commerce Industry Revenue Share (%), by Country 2024 & 2032
- Figure 18: South America B2B E-Commerce Industry Volume Share (%), by Country 2024 & 2032
- Figure 19: North America B2B E-Commerce Industry Revenue (Million), by Country 2024 & 2032
- Figure 20: North America B2B E-Commerce Industry Volume (K Unit), by Country 2024 & 2032
- Figure 21: North America B2B E-Commerce Industry Revenue Share (%), by Country 2024 & 2032
- Figure 22: North America B2B E-Commerce Industry Volume Share (%), by Country 2024 & 2032
- Figure 23: MEA B2B E-Commerce Industry Revenue (Million), by Country 2024 & 2032
- Figure 24: MEA B2B E-Commerce Industry Volume (K Unit), by Country 2024 & 2032
- Figure 25: MEA B2B E-Commerce Industry Revenue Share (%), by Country 2024 & 2032
- Figure 26: MEA B2B E-Commerce Industry Volume Share (%), by Country 2024 & 2032
- Figure 27: North America B2B E-Commerce Industry Revenue (Million), by Channel 2024 & 2032
- Figure 28: North America B2B E-Commerce Industry Volume (K Unit), by Channel 2024 & 2032
- Figure 29: North America B2B E-Commerce Industry Revenue Share (%), by Channel 2024 & 2032
- Figure 30: North America B2B E-Commerce Industry Volume Share (%), by Channel 2024 & 2032
- Figure 31: North America B2B E-Commerce Industry Revenue (Million), by Country 2024 & 2032
- Figure 32: North America B2B E-Commerce Industry Volume (K Unit), by Country 2024 & 2032
- Figure 33: North America B2B E-Commerce Industry Revenue Share (%), by Country 2024 & 2032
- Figure 34: North America B2B E-Commerce Industry Volume Share (%), by Country 2024 & 2032
- Figure 35: Europe B2B E-Commerce Industry Revenue (Million), by Channel 2024 & 2032
- Figure 36: Europe B2B E-Commerce Industry Volume (K Unit), by Channel 2024 & 2032
- Figure 37: Europe B2B E-Commerce Industry Revenue Share (%), by Channel 2024 & 2032
- Figure 38: Europe B2B E-Commerce Industry Volume Share (%), by Channel 2024 & 2032
- Figure 39: Europe B2B E-Commerce Industry Revenue (Million), by Country 2024 & 2032
- Figure 40: Europe B2B E-Commerce Industry Volume (K Unit), by Country 2024 & 2032
- Figure 41: Europe B2B E-Commerce Industry Revenue Share (%), by Country 2024 & 2032
- Figure 42: Europe B2B E-Commerce Industry Volume Share (%), by Country 2024 & 2032
- Figure 43: Asia Pacific B2B E-Commerce Industry Revenue (Million), by Channel 2024 & 2032
- Figure 44: Asia Pacific B2B E-Commerce Industry Volume (K Unit), by Channel 2024 & 2032
- Figure 45: Asia Pacific B2B E-Commerce Industry Revenue Share (%), by Channel 2024 & 2032
- Figure 46: Asia Pacific B2B E-Commerce Industry Volume Share (%), by Channel 2024 & 2032
- Figure 47: Asia Pacific B2B E-Commerce Industry Revenue (Million), by Country 2024 & 2032
- Figure 48: Asia Pacific B2B E-Commerce Industry Volume (K Unit), by Country 2024 & 2032
- Figure 49: Asia Pacific B2B E-Commerce Industry Revenue Share (%), by Country 2024 & 2032
- Figure 50: Asia Pacific B2B E-Commerce Industry Volume Share (%), by Country 2024 & 2032
- Figure 51: Latin America B2B E-Commerce Industry Revenue (Million), by Channel 2024 & 2032
- Figure 52: Latin America B2B E-Commerce Industry Volume (K Unit), by Channel 2024 & 2032
- Figure 53: Latin America B2B E-Commerce Industry Revenue Share (%), by Channel 2024 & 2032
- Figure 54: Latin America B2B E-Commerce Industry Volume Share (%), by Channel 2024 & 2032
- Figure 55: Latin America B2B E-Commerce Industry Revenue (Million), by Country 2024 & 2032
- Figure 56: Latin America B2B E-Commerce Industry Volume (K Unit), by Country 2024 & 2032
- Figure 57: Latin America B2B E-Commerce Industry Revenue Share (%), by Country 2024 & 2032
- Figure 58: Latin America B2B E-Commerce Industry Volume Share (%), by Country 2024 & 2032
- Figure 59: Middle East and Africa B2B E-Commerce Industry Revenue (Million), by Channel 2024 & 2032
- Figure 60: Middle East and Africa B2B E-Commerce Industry Volume (K Unit), by Channel 2024 & 2032
- Figure 61: Middle East and Africa B2B E-Commerce Industry Revenue Share (%), by Channel 2024 & 2032
- Figure 62: Middle East and Africa B2B E-Commerce Industry Volume Share (%), by Channel 2024 & 2032
- Figure 63: Middle East and Africa B2B E-Commerce Industry Revenue (Million), by Country 2024 & 2032
- Figure 64: Middle East and Africa B2B E-Commerce Industry Volume (K Unit), by Country 2024 & 2032
- Figure 65: Middle East and Africa B2B E-Commerce Industry Revenue Share (%), by Country 2024 & 2032
- Figure 66: Middle East and Africa B2B E-Commerce Industry Volume Share (%), by Country 2024 & 2032
List of Tables
- Table 1: Global B2B E-Commerce Industry Revenue Million Forecast, by Region 2019 & 2032
- Table 2: Global B2B E-Commerce Industry Volume K Unit Forecast, by Region 2019 & 2032
- Table 3: Global B2B E-Commerce Industry Revenue Million Forecast, by Channel 2019 & 2032
- Table 4: Global B2B E-Commerce Industry Volume K Unit Forecast, by Channel 2019 & 2032
- Table 5: Global B2B E-Commerce Industry Revenue Million Forecast, by Region 2019 & 2032
- Table 6: Global B2B E-Commerce Industry Volume K Unit Forecast, by Region 2019 & 2032
- Table 7: Global B2B E-Commerce Industry Revenue Million Forecast, by Country 2019 & 2032
- Table 8: Global B2B E-Commerce Industry Volume K Unit Forecast, by Country 2019 & 2032
- Table 9: United States B2B E-Commerce Industry Revenue (Million) Forecast, by Application 2019 & 2032
- Table 10: United States B2B E-Commerce Industry Volume (K Unit) Forecast, by Application 2019 & 2032
- Table 11: Canada B2B E-Commerce Industry Revenue (Million) Forecast, by Application 2019 & 2032
- Table 12: Canada B2B E-Commerce Industry Volume (K Unit) Forecast, by Application 2019 & 2032
- Table 13: Mexico B2B E-Commerce Industry Revenue (Million) Forecast, by Application 2019 & 2032
- Table 14: Mexico B2B E-Commerce Industry Volume (K Unit) Forecast, by Application 2019 & 2032
- Table 15: Global B2B E-Commerce Industry Revenue Million Forecast, by Country 2019 & 2032
- Table 16: Global B2B E-Commerce Industry Volume K Unit Forecast, by Country 2019 & 2032
- Table 17: Germany B2B E-Commerce Industry Revenue (Million) Forecast, by Application 2019 & 2032
- Table 18: Germany B2B E-Commerce Industry Volume (K Unit) Forecast, by Application 2019 & 2032
- Table 19: United Kingdom B2B E-Commerce Industry Revenue (Million) Forecast, by Application 2019 & 2032
- Table 20: United Kingdom B2B E-Commerce Industry Volume (K Unit) Forecast, by Application 2019 & 2032
- Table 21: France B2B E-Commerce Industry Revenue (Million) Forecast, by Application 2019 & 2032
- Table 22: France B2B E-Commerce Industry Volume (K Unit) Forecast, by Application 2019 & 2032
- Table 23: Spain B2B E-Commerce Industry Revenue (Million) Forecast, by Application 2019 & 2032
- Table 24: Spain B2B E-Commerce Industry Volume (K Unit) Forecast, by Application 2019 & 2032
- Table 25: Italy B2B E-Commerce Industry Revenue (Million) Forecast, by Application 2019 & 2032
- Table 26: Italy B2B E-Commerce Industry Volume (K Unit) Forecast, by Application 2019 & 2032
- Table 27: Spain B2B E-Commerce Industry Revenue (Million) Forecast, by Application 2019 & 2032
- Table 28: Spain B2B E-Commerce Industry Volume (K Unit) Forecast, by Application 2019 & 2032
- Table 29: Belgium B2B E-Commerce Industry Revenue (Million) Forecast, by Application 2019 & 2032
- Table 30: Belgium B2B E-Commerce Industry Volume (K Unit) Forecast, by Application 2019 & 2032
- Table 31: Netherland B2B E-Commerce Industry Revenue (Million) Forecast, by Application 2019 & 2032
- Table 32: Netherland B2B E-Commerce Industry Volume (K Unit) Forecast, by Application 2019 & 2032
- Table 33: Nordics B2B E-Commerce Industry Revenue (Million) Forecast, by Application 2019 & 2032
- Table 34: Nordics B2B E-Commerce Industry Volume (K Unit) Forecast, by Application 2019 & 2032
- Table 35: Rest of Europe B2B E-Commerce Industry Revenue (Million) Forecast, by Application 2019 & 2032
- Table 36: Rest of Europe B2B E-Commerce Industry Volume (K Unit) Forecast, by Application 2019 & 2032
- Table 37: Global B2B E-Commerce Industry Revenue Million Forecast, by Country 2019 & 2032
- Table 38: Global B2B E-Commerce Industry Volume K Unit Forecast, by Country 2019 & 2032
- Table 39: China B2B E-Commerce Industry Revenue (Million) Forecast, by Application 2019 & 2032
- Table 40: China B2B E-Commerce Industry Volume (K Unit) Forecast, by Application 2019 & 2032
- Table 41: Japan B2B E-Commerce Industry Revenue (Million) Forecast, by Application 2019 & 2032
- Table 42: Japan B2B E-Commerce Industry Volume (K Unit) Forecast, by Application 2019 & 2032
- Table 43: India B2B E-Commerce Industry Revenue (Million) Forecast, by Application 2019 & 2032
- Table 44: India B2B E-Commerce Industry Volume (K Unit) Forecast, by Application 2019 & 2032
- Table 45: South Korea B2B E-Commerce Industry Revenue (Million) Forecast, by Application 2019 & 2032
- Table 46: South Korea B2B E-Commerce Industry Volume (K Unit) Forecast, by Application 2019 & 2032
- Table 47: Southeast Asia B2B E-Commerce Industry Revenue (Million) Forecast, by Application 2019 & 2032
- Table 48: Southeast Asia B2B E-Commerce Industry Volume (K Unit) Forecast, by Application 2019 & 2032
- Table 49: Australia B2B E-Commerce Industry Revenue (Million) Forecast, by Application 2019 & 2032
- Table 50: Australia B2B E-Commerce Industry Volume (K Unit) Forecast, by Application 2019 & 2032
- Table 51: Indonesia B2B E-Commerce Industry Revenue (Million) Forecast, by Application 2019 & 2032
- Table 52: Indonesia B2B E-Commerce Industry Volume (K Unit) Forecast, by Application 2019 & 2032
- Table 53: Phillipes B2B E-Commerce Industry Revenue (Million) Forecast, by Application 2019 & 2032
- Table 54: Phillipes B2B E-Commerce Industry Volume (K Unit) Forecast, by Application 2019 & 2032
- Table 55: Singapore B2B E-Commerce Industry Revenue (Million) Forecast, by Application 2019 & 2032
- Table 56: Singapore B2B E-Commerce Industry Volume (K Unit) Forecast, by Application 2019 & 2032
- Table 57: Thailandc B2B E-Commerce Industry Revenue (Million) Forecast, by Application 2019 & 2032
- Table 58: Thailandc B2B E-Commerce Industry Volume (K Unit) Forecast, by Application 2019 & 2032
- Table 59: Rest of Asia Pacific B2B E-Commerce Industry Revenue (Million) Forecast, by Application 2019 & 2032
- Table 60: Rest of Asia Pacific B2B E-Commerce Industry Volume (K Unit) Forecast, by Application 2019 & 2032
- Table 61: Global B2B E-Commerce Industry Revenue Million Forecast, by Country 2019 & 2032
- Table 62: Global B2B E-Commerce Industry Volume K Unit Forecast, by Country 2019 & 2032
- Table 63: Brazil B2B E-Commerce Industry Revenue (Million) Forecast, by Application 2019 & 2032
- Table 64: Brazil B2B E-Commerce Industry Volume (K Unit) Forecast, by Application 2019 & 2032
- Table 65: Argentina B2B E-Commerce Industry Revenue (Million) Forecast, by Application 2019 & 2032
- Table 66: Argentina B2B E-Commerce Industry Volume (K Unit) Forecast, by Application 2019 & 2032
- Table 67: Peru B2B E-Commerce Industry Revenue (Million) Forecast, by Application 2019 & 2032
- Table 68: Peru B2B E-Commerce Industry Volume (K Unit) Forecast, by Application 2019 & 2032
- Table 69: Chile B2B E-Commerce Industry Revenue (Million) Forecast, by Application 2019 & 2032
- Table 70: Chile B2B E-Commerce Industry Volume (K Unit) Forecast, by Application 2019 & 2032
- Table 71: Colombia B2B E-Commerce Industry Revenue (Million) Forecast, by Application 2019 & 2032
- Table 72: Colombia B2B E-Commerce Industry Volume (K Unit) Forecast, by Application 2019 & 2032
- Table 73: Ecuador B2B E-Commerce Industry Revenue (Million) Forecast, by Application 2019 & 2032
- Table 74: Ecuador B2B E-Commerce Industry Volume (K Unit) Forecast, by Application 2019 & 2032
- Table 75: Venezuela B2B E-Commerce Industry Revenue (Million) Forecast, by Application 2019 & 2032
- Table 76: Venezuela B2B E-Commerce Industry Volume (K Unit) Forecast, by Application 2019 & 2032
- Table 77: Rest of South America B2B E-Commerce Industry Revenue (Million) Forecast, by Application 2019 & 2032
- Table 78: Rest of South America B2B E-Commerce Industry Volume (K Unit) Forecast, by Application 2019 & 2032
- Table 79: Global B2B E-Commerce Industry Revenue Million Forecast, by Country 2019 & 2032
- Table 80: Global B2B E-Commerce Industry Volume K Unit Forecast, by Country 2019 & 2032
- Table 81: United States B2B E-Commerce Industry Revenue (Million) Forecast, by Application 2019 & 2032
- Table 82: United States B2B E-Commerce Industry Volume (K Unit) Forecast, by Application 2019 & 2032
- Table 83: Canada B2B E-Commerce Industry Revenue (Million) Forecast, by Application 2019 & 2032
- Table 84: Canada B2B E-Commerce Industry Volume (K Unit) Forecast, by Application 2019 & 2032
- Table 85: Mexico B2B E-Commerce Industry Revenue (Million) Forecast, by Application 2019 & 2032
- Table 86: Mexico B2B E-Commerce Industry Volume (K Unit) Forecast, by Application 2019 & 2032
- Table 87: Global B2B E-Commerce Industry Revenue Million Forecast, by Country 2019 & 2032
- Table 88: Global B2B E-Commerce Industry Volume K Unit Forecast, by Country 2019 & 2032
- Table 89: United Arab Emirates B2B E-Commerce Industry Revenue (Million) Forecast, by Application 2019 & 2032
- Table 90: United Arab Emirates B2B E-Commerce Industry Volume (K Unit) Forecast, by Application 2019 & 2032
- Table 91: Saudi Arabia B2B E-Commerce Industry Revenue (Million) Forecast, by Application 2019 & 2032
- Table 92: Saudi Arabia B2B E-Commerce Industry Volume (K Unit) Forecast, by Application 2019 & 2032
- Table 93: South Africa B2B E-Commerce Industry Revenue (Million) Forecast, by Application 2019 & 2032
- Table 94: South Africa B2B E-Commerce Industry Volume (K Unit) Forecast, by Application 2019 & 2032
- Table 95: Rest of Middle East and Africa B2B E-Commerce Industry Revenue (Million) Forecast, by Application 2019 & 2032
- Table 96: Rest of Middle East and Africa B2B E-Commerce Industry Volume (K Unit) Forecast, by Application 2019 & 2032
- Table 97: Global B2B E-Commerce Industry Revenue Million Forecast, by Channel 2019 & 2032
- Table 98: Global B2B E-Commerce Industry Volume K Unit Forecast, by Channel 2019 & 2032
- Table 99: Global B2B E-Commerce Industry Revenue Million Forecast, by Country 2019 & 2032
- Table 100: Global B2B E-Commerce Industry Volume K Unit Forecast, by Country 2019 & 2032
- Table 101: Global B2B E-Commerce Industry Revenue Million Forecast, by Channel 2019 & 2032
- Table 102: Global B2B E-Commerce Industry Volume K Unit Forecast, by Channel 2019 & 2032
- Table 103: Global B2B E-Commerce Industry Revenue Million Forecast, by Country 2019 & 2032
- Table 104: Global B2B E-Commerce Industry Volume K Unit Forecast, by Country 2019 & 2032
- Table 105: Global B2B E-Commerce Industry Revenue Million Forecast, by Channel 2019 & 2032
- Table 106: Global B2B E-Commerce Industry Volume K Unit Forecast, by Channel 2019 & 2032
- Table 107: Global B2B E-Commerce Industry Revenue Million Forecast, by Country 2019 & 2032
- Table 108: Global B2B E-Commerce Industry Volume K Unit Forecast, by Country 2019 & 2032
- Table 109: Global B2B E-Commerce Industry Revenue Million Forecast, by Channel 2019 & 2032
- Table 110: Global B2B E-Commerce Industry Volume K Unit Forecast, by Channel 2019 & 2032
- Table 111: Global B2B E-Commerce Industry Revenue Million Forecast, by Country 2019 & 2032
- Table 112: Global B2B E-Commerce Industry Volume K Unit Forecast, by Country 2019 & 2032
- Table 113: Global B2B E-Commerce Industry Revenue Million Forecast, by Channel 2019 & 2032
- Table 114: Global B2B E-Commerce Industry Volume K Unit Forecast, by Channel 2019 & 2032
- Table 115: Global B2B E-Commerce Industry Revenue Million Forecast, by Country 2019 & 2032
- Table 116: Global B2B E-Commerce Industry Volume K Unit Forecast, by Country 2019 & 2032
Frequently Asked Questions
1. What is the projected Compound Annual Growth Rate (CAGR) of the B2B E-Commerce Industry?
The projected CAGR is approximately 12.36%.
2. Which companies are prominent players in the B2B E-Commerce Industry?
Key companies in the market include DIYTrade com, IndiaMART InterMESH Ltd, KOMPASS, ChinaAseanTrade com, Flipkart, Amazon com Inc, Alibaba Group, eBay Inc, eworldtrade com, Quill Lincolnshire Inc.
3. What are the main segments of the B2B E-Commerce Industry?
The market segments include Channel.
4. Can you provide details about the market size?
The market size is estimated to be USD XX Million as of 2022.
5. What are some drivers contributing to market growth?
Innovative Business Solutions and Increased digitalization in B2B e-commerce; Omnichannel Business Model.
6. What are the notable trends driving market growth?
Increase in Digitalization across the B2B e-commerce is driving growth.
7. Are there any restraints impacting market growth?
Paid version of some applications can challenge further penetration.
8. Can you provide examples of recent developments in the market?
August 2022 - Razer Merchant Services (RMS), the B2B arm of Razer Fintech, partnered with Atome, an Asia-based Buy Now Pay Later (BNPL) service. This partnership is aimed to enable flexible deferred payment acceptance during checkout at online and offline RMS merchants.
9. What pricing options are available for accessing the report?
Pricing options include single-user, multi-user, and enterprise licenses priced at USD 4750, USD 5250, and USD 8750 respectively.
10. Is the market size provided in terms of value or volume?
The market size is provided in terms of value, measured in Million and volume, measured in K Unit.
11. Are there any specific market keywords associated with the report?
Yes, the market keyword associated with the report is "B2B E-Commerce Industry," which aids in identifying and referencing the specific market segment covered.
12. How do I determine which pricing option suits my needs best?
The pricing options vary based on user requirements and access needs. Individual users may opt for single-user licenses, while businesses requiring broader access may choose multi-user or enterprise licenses for cost-effective access to the report.
13. Are there any additional resources or data provided in the B2B E-Commerce Industry report?
While the report offers comprehensive insights, it's advisable to review the specific contents or supplementary materials provided to ascertain if additional resources or data are available.
14. How can I stay updated on further developments or reports in the B2B E-Commerce Industry?
To stay informed about further developments, trends, and reports in the B2B E-Commerce Industry, consider subscribing to industry newsletters, following relevant companies and organizations, or regularly checking reputable industry news sources and publications.
Methodology
Step 1 - Identification of Relevant Samples Size from Population Database


Step 2 - Approaches for Defining Global Market Size (Value, Volume* & Price*)

Note*: In applicable scenarios
Step 3 - Data Sources
Primary Research
- Web Analytics
- Survey Reports
- Research Institute
- Latest Research Reports
- Opinion Leaders
Secondary Research
- Annual Reports
- White Paper
- Latest Press Release
- Industry Association
- Paid Database
- Investor Presentations

Step 4 - Data Triangulation
Involves using different sources of information in order to increase the validity of a study
These sources are likely to be stakeholders in a program - participants, other researchers, program staff, other community members, and so on.
Then we put all data in single framework & apply various statistical tools to find out the dynamic on the market.
During the analysis stage, feedback from the stakeholder groups would be compared to determine areas of agreement as well as areas of divergence
