

Key Insights
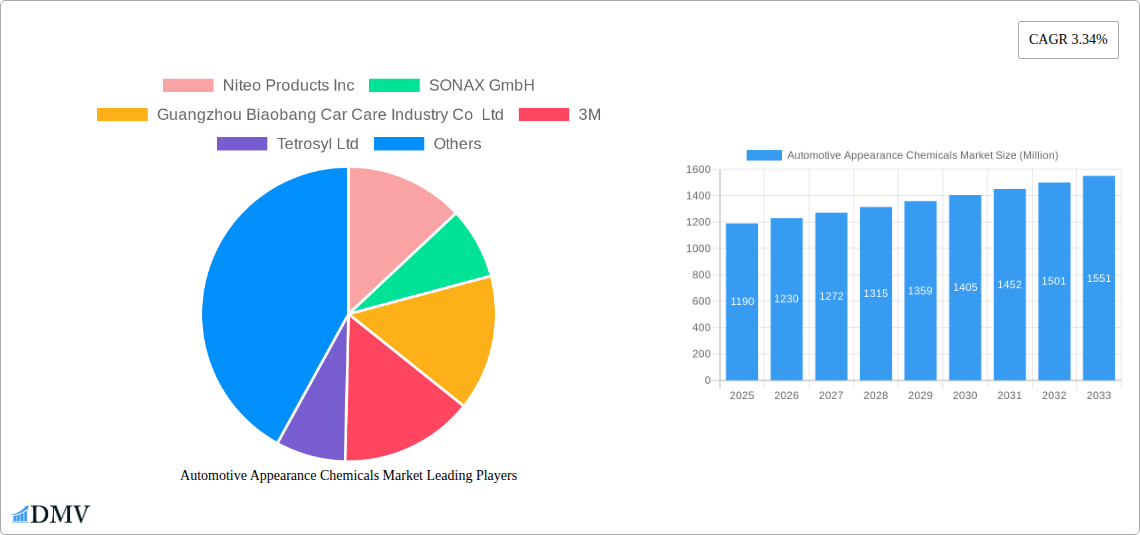
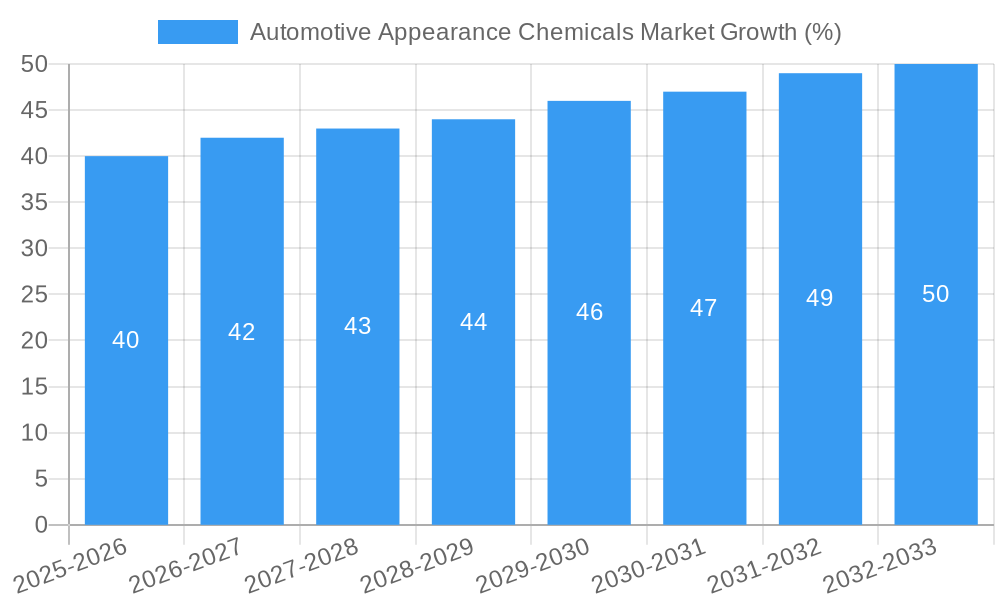
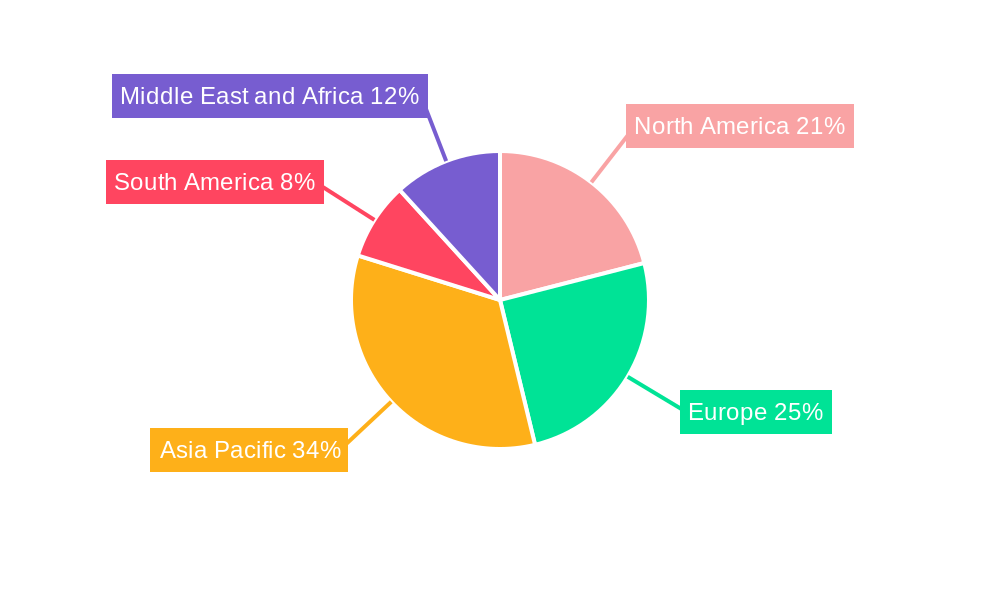
The global automotive appearance chemicals market, valued at $1.19 billion in 2025, is projected to experience steady growth, driven by increasing vehicle ownership, particularly in developing economies like India and China. A Compound Annual Growth Rate (CAGR) of 3.34% is anticipated from 2025 to 2033, indicating a consistent market expansion. Key growth drivers include the rising demand for premium car care products, a growing awareness of vehicle aesthetics among consumers, and the increasing popularity of do-it-yourself (DIY) detailing. Market segmentation reveals that waxes and polishes currently hold a significant share, but the demand for specialized cleaners, like wheel and tire cleaners and leather care products, is rapidly increasing, driven by consumer preference for enhanced vehicle protection and appearance. This trend is further fueled by the introduction of innovative, eco-friendly formulations that cater to environmentally conscious consumers. Geographic analysis suggests that the Asia-Pacific region, especially China and India, will contribute significantly to market growth due to expanding vehicle production and sales. However, factors such as fluctuating raw material prices and the impact of economic downturns pose potential restraints on market expansion. Competition within the market is intense, with major players like 3M, Turtle Wax, and SONAX vying for market share through product innovation and strategic partnerships. The forecast for the coming years indicates a robust, albeit gradually expanding, market fueled by sustained consumer demand and ongoing technological advancements in car care products.
The automotive appearance chemicals market is segmented by product type (waxes, polishes, protectants, wheel and tire cleaners, windshield washer fluids, leather care products, others) and application (passenger cars, light commercial vehicles, heavy commercial vehicles, others). The passenger car segment is expected to remain the largest application segment, owing to higher vehicle ownership numbers compared to commercial vehicles. The competitive landscape is fragmented, with a mix of established multinational corporations and regional players. Future growth will hinge on adapting to evolving consumer preferences, focusing on sustainable products, and leveraging digital marketing channels to reach target audiences effectively. Innovation in product formulations and packaging, coupled with strategic pricing strategies, will be crucial for businesses to maintain a competitive edge in the coming years. The market is expected to see increasing consolidation through mergers and acquisitions as larger players seek to expand their market share and product portfolios.
Automotive Appearance Chemicals Market: A Comprehensive Report (2019-2033)
This insightful report provides a comprehensive analysis of the Automotive Appearance Chemicals Market, offering invaluable data and forecasts for stakeholders seeking to navigate this dynamic industry. The study period spans from 2019 to 2033, with 2025 serving as the base and estimated year. The report delves deep into market trends, competitive landscapes, technological advancements, and future growth projections, providing actionable insights for strategic decision-making. The market size is projected to reach xx Million by 2033.
Automotive Appearance Chemicals Market Composition & Trends
This section meticulously examines the Automotive Appearance Chemicals Market's structure, revealing key trends shaping its evolution. We analyze market concentration, highlighting the market share distribution among key players like 3M, SONAX GmbH, Turtle Wax Inc, and others. We also quantify the impact of mergers and acquisitions (M&A) activities, estimating deal values at xx Million over the past five years. Innovation catalysts, such as the development of eco-friendly formulations and advanced polymers, are assessed alongside their influence on market dynamics. The regulatory landscape, including emission standards and safety regulations, is thoroughly scrutinized for its impact on product development and market access. Substitute products and their competitive threats are also analyzed. Finally, the report profiles end-users, including passenger car owners, commercial vehicle fleets, and detailing service providers, to understand their preferences and purchasing behavior.
- Market Concentration: Highly fragmented, with the top 5 players holding approximately xx% market share in 2025.
- M&A Activity: Significant consolidation observed, with xx major deals valued at approximately xx Million between 2019 and 2024.
- Innovation Catalysts: Focus on eco-friendly, biodegradable products and advanced surface protection technologies.
- Regulatory Landscape: Stringent environmental regulations driving the adoption of sustainable formulations.
- Substitute Products: Competition from alternative cleaning and protection methods, posing a moderate threat.
Automotive Appearance Chemicals Market Industry Evolution
This section traces the Automotive Appearance Chemicals Market's evolution from 2019 to 2033, examining its growth trajectory and the underlying technological and consumer-driven factors. We explore the market's Compound Annual Growth Rate (CAGR) during the historical period (2019-2024) at xx% and project its future growth (2025-2033) at xx%. The increasing demand for premium automotive appearance products, fueled by rising disposable incomes and a preference for enhanced vehicle aesthetics, significantly impacts market growth. Technological advancements, including nanotechnology-based coatings and smart cleaning solutions, are examined for their role in market expansion. Changes in consumer preferences, such as a growing preference for eco-conscious products, are analyzed, highlighting their influence on product innovation and market segmentation.
Leading Regions, Countries, or Segments in Automotive Appearance Chemicals Market
This section identifies the dominant regions, countries, and segments within the Automotive Appearance Chemicals Market. The North American market, specifically the United States, holds a significant share due to high vehicle ownership rates and a strong aftermarket for automotive care products. Within product types, Waxes and Polishes segment maintains a substantial lead due to established consumer preferences and wide availability. The Passenger Cars application segment dominates due to high volumes compared to commercial vehicles.
- Key Drivers (North America):
- High vehicle ownership rates.
- Strong aftermarket for automotive care products.
- High consumer spending on vehicle aesthetics.
- Key Drivers (Waxes & Polishes):
- Established consumer preference for traditional methods.
- Wide product availability and affordability.
- Key Drivers (Passenger Cars):
- High vehicle sales volumes compared to commercial vehicles.
- Greater consumer focus on personal vehicle appearance.
The dominance of these segments stems from a confluence of factors, including strong consumer demand, favorable regulatory environments, and established distribution networks.
Automotive Appearance Chemicals Market Product Innovations
Recent innovations have focused on developing high-performance, eco-friendly formulations. Nanotechnology-based coatings offer superior protection and durability, while biodegradable cleaning agents address growing environmental concerns. These innovations enhance product performance, extending the lifespan of protective layers and improving cleaning efficiency. Unique selling propositions often highlight ease of use, superior shine, and long-lasting protection.
Propelling Factors for Automotive Appearance Chemicals Market Growth
Several factors fuel the growth of the Automotive Appearance Chemicals Market. The rising demand for enhanced vehicle aesthetics, driven by increased disposable incomes and a preference for personalized vehicle care, is a major driver. Technological advancements, such as the development of eco-friendly and high-performance formulations, are further propelling market expansion. Government regulations promoting environmental sustainability are also influencing product development and market growth.
Obstacles in the Automotive Appearance Chemicals Market
Challenges include fluctuating raw material prices impacting production costs, supply chain disruptions affecting product availability, and intense competition among established players and new entrants. Regulatory hurdles in certain regions, concerning chemical compositions and environmental impact, also pose significant restraints. These factors collectively constrain market growth and profitability.
Future Opportunities in Automotive Appearance Chemicals Market
Emerging opportunities lie in developing advanced, sustainable formulations catering to specific vehicle types (e.g., electric vehicles) and incorporating smart technologies for improved application and monitoring. Expanding into developing economies with rising vehicle ownership and tapping into the growing demand for specialized detailing services presents substantial future opportunities.
Major Players in the Automotive Appearance Chemicals Market Ecosystem
- 3M
- SONAX GmbH
- Guangzhou Biaobang Car Care Industry Co Ltd
- Tetrosyl Ltd
- Nuvite Chemical Compounds
- Dow
- ITW Global Brands
- Turtle Wax Inc
- LIQUI MOLY GmbH
- Valvoline Chemicals
- General Chemical Corp
- Niteo Products Inc
Key Developments in Automotive Appearance Chemicals Market Industry
- 2022 Q3: 3M launched a new line of eco-friendly car waxes.
- 2023 Q1: SONAX GmbH acquired a smaller competitor, expanding its market share.
- 2024 Q2: New regulations on volatile organic compounds (VOCs) came into effect in several European countries. (Further details will be provided in the complete report)
Strategic Automotive Appearance Chemicals Market Forecast
The Automotive Appearance Chemicals Market is poised for sustained growth, driven by ongoing innovation in product formulations, expanding consumer demand for advanced vehicle care solutions, and the emergence of new market segments. The market's future growth will be influenced by technological advancements, shifting consumer preferences, and evolving regulatory landscapes. The projected growth rate suggests significant market potential for both established players and new entrants.
Automotive Appearance Chemicals Market Segmentation
-
1. Product Type
- 1.1. Waxes
- 1.2. Polishes
- 1.3. Protectants
- 1.4. Wheel and Tire Cleaners
- 1.5. Windshield Washer Fluids
- 1.6. Leather Care Products
- 1.7. Others
-
2. Application
- 2.1. Passenger Cars
- 2.2. Light Commercial Vehicles
- 2.3. Heavy Commercial Vehicles
- 2.4. Others
Automotive Appearance Chemicals Market Segmentation By Geography
-
1. Asia Pacific
- 1.1. China
- 1.2. India
- 1.3. Japan
- 1.4. South Korea
- 1.5. Rest of Asia Pacific
-
2. North America
- 2.1. United States
- 2.2. Canada
- 2.3. Mexico
-
3. Europe
- 3.1. Germany
- 3.2. United Kingdom
- 3.3. France
- 3.4. Italy
- 3.5. Rest of Europe
-
4. South America
- 4.1. Brazil
- 4.2. Argentina
- 4.3. Rest of South America
-
5. Middle East and Africa
- 5.1. Saudi Arabia
- 5.2. South Africa
- 5.3. Rest of Middle East and Africa
Automotive Appearance Chemicals Market REPORT HIGHLIGHTS
| Aspects | Details |
|---|---|
| Study Period | 2019-2033 |
| Base Year | 2024 |
| Estimated Year | 2025 |
| Forecast Period | 2025-2033 |
| Historical Period | 2019-2024 |
| Growth Rate | CAGR of 3.34% from 2019-2033 |
| Segmentation |
|
Table of Contents
- 1. Introduction
- 1.1. Research Scope
- 1.2. Market Segmentation
- 1.3. Research Methodology
- 1.4. Definitions and Assumptions
- 2. Executive Summary
- 2.1. Introduction
- 3. Market Dynamics
- 3.1. Introduction
- 3.2. Market Drivers
- 3.2.1. Increase in the Production of Electric Vehicles (EV); Increase in Consumer Awareness Toward Vehicle Maintenance; Other Drivers
- 3.3. Market Restrains
- 3.3.1. Stringent Government Regulations on Petroleum Products like Waxes and Coatings; Other Restraints
- 3.4. Market Trends
- 3.4.1. Increase in the Production of Electric Vehicles
- 4. Market Factor Analysis
- 4.1. Porters Five Forces
- 4.2. Supply/Value Chain
- 4.3. PESTEL analysis
- 4.4. Market Entropy
- 4.5. Patent/Trademark Analysis
- 5. Global Automotive Appearance Chemicals Market Analysis, Insights and Forecast, 2019-2031
- 5.1. Market Analysis, Insights and Forecast - by Product Type
- 5.1.1. Waxes
- 5.1.2. Polishes
- 5.1.3. Protectants
- 5.1.4. Wheel and Tire Cleaners
- 5.1.5. Windshield Washer Fluids
- 5.1.6. Leather Care Products
- 5.1.7. Others
- 5.2. Market Analysis, Insights and Forecast - by Application
- 5.2.1. Passenger Cars
- 5.2.2. Light Commercial Vehicles
- 5.2.3. Heavy Commercial Vehicles
- 5.2.4. Others
- 5.3. Market Analysis, Insights and Forecast - by Region
- 5.3.1. Asia Pacific
- 5.3.2. North America
- 5.3.3. Europe
- 5.3.4. South America
- 5.3.5. Middle East and Africa
- 5.1. Market Analysis, Insights and Forecast - by Product Type
- 6. Asia Pacific Automotive Appearance Chemicals Market Analysis, Insights and Forecast, 2019-2031
- 6.1. Market Analysis, Insights and Forecast - by Product Type
- 6.1.1. Waxes
- 6.1.2. Polishes
- 6.1.3. Protectants
- 6.1.4. Wheel and Tire Cleaners
- 6.1.5. Windshield Washer Fluids
- 6.1.6. Leather Care Products
- 6.1.7. Others
- 6.2. Market Analysis, Insights and Forecast - by Application
- 6.2.1. Passenger Cars
- 6.2.2. Light Commercial Vehicles
- 6.2.3. Heavy Commercial Vehicles
- 6.2.4. Others
- 6.1. Market Analysis, Insights and Forecast - by Product Type
- 7. North America Automotive Appearance Chemicals Market Analysis, Insights and Forecast, 2019-2031
- 7.1. Market Analysis, Insights and Forecast - by Product Type
- 7.1.1. Waxes
- 7.1.2. Polishes
- 7.1.3. Protectants
- 7.1.4. Wheel and Tire Cleaners
- 7.1.5. Windshield Washer Fluids
- 7.1.6. Leather Care Products
- 7.1.7. Others
- 7.2. Market Analysis, Insights and Forecast - by Application
- 7.2.1. Passenger Cars
- 7.2.2. Light Commercial Vehicles
- 7.2.3. Heavy Commercial Vehicles
- 7.2.4. Others
- 7.1. Market Analysis, Insights and Forecast - by Product Type
- 8. Europe Automotive Appearance Chemicals Market Analysis, Insights and Forecast, 2019-2031
- 8.1. Market Analysis, Insights and Forecast - by Product Type
- 8.1.1. Waxes
- 8.1.2. Polishes
- 8.1.3. Protectants
- 8.1.4. Wheel and Tire Cleaners
- 8.1.5. Windshield Washer Fluids
- 8.1.6. Leather Care Products
- 8.1.7. Others
- 8.2. Market Analysis, Insights and Forecast - by Application
- 8.2.1. Passenger Cars
- 8.2.2. Light Commercial Vehicles
- 8.2.3. Heavy Commercial Vehicles
- 8.2.4. Others
- 8.1. Market Analysis, Insights and Forecast - by Product Type
- 9. South America Automotive Appearance Chemicals Market Analysis, Insights and Forecast, 2019-2031
- 9.1. Market Analysis, Insights and Forecast - by Product Type
- 9.1.1. Waxes
- 9.1.2. Polishes
- 9.1.3. Protectants
- 9.1.4. Wheel and Tire Cleaners
- 9.1.5. Windshield Washer Fluids
- 9.1.6. Leather Care Products
- 9.1.7. Others
- 9.2. Market Analysis, Insights and Forecast - by Application
- 9.2.1. Passenger Cars
- 9.2.2. Light Commercial Vehicles
- 9.2.3. Heavy Commercial Vehicles
- 9.2.4. Others
- 9.1. Market Analysis, Insights and Forecast - by Product Type
- 10. Middle East and Africa Automotive Appearance Chemicals Market Analysis, Insights and Forecast, 2019-2031
- 10.1. Market Analysis, Insights and Forecast - by Product Type
- 10.1.1. Waxes
- 10.1.2. Polishes
- 10.1.3. Protectants
- 10.1.4. Wheel and Tire Cleaners
- 10.1.5. Windshield Washer Fluids
- 10.1.6. Leather Care Products
- 10.1.7. Others
- 10.2. Market Analysis, Insights and Forecast - by Application
- 10.2.1. Passenger Cars
- 10.2.2. Light Commercial Vehicles
- 10.2.3. Heavy Commercial Vehicles
- 10.2.4. Others
- 10.1. Market Analysis, Insights and Forecast - by Product Type
- 11. Asia Pacific Automotive Appearance Chemicals Market Analysis, Insights and Forecast, 2019-2031
- 11.1. Market Analysis, Insights and Forecast - By Country/Sub-region
- 11.1.1 China
- 11.1.2 India
- 11.1.3 Japan
- 11.1.4 South Korea
- 11.1.5 Rest of Asia Pacific
- 12. North America Automotive Appearance Chemicals Market Analysis, Insights and Forecast, 2019-2031
- 12.1. Market Analysis, Insights and Forecast - By Country/Sub-region
- 12.1.1 United States
- 12.1.2 Canada
- 12.1.3 Mexico
- 13. Europe Automotive Appearance Chemicals Market Analysis, Insights and Forecast, 2019-2031
- 13.1. Market Analysis, Insights and Forecast - By Country/Sub-region
- 13.1.1 Germany
- 13.1.2 United Kingdom
- 13.1.3 France
- 13.1.4 Italy
- 13.1.5 Rest of Europe
- 14. South America Automotive Appearance Chemicals Market Analysis, Insights and Forecast, 2019-2031
- 14.1. Market Analysis, Insights and Forecast - By Country/Sub-region
- 14.1.1 Brazil
- 14.1.2 Argentina
- 14.1.3 Rest of South America
- 15. Middle East and Africa Automotive Appearance Chemicals Market Analysis, Insights and Forecast, 2019-2031
- 15.1. Market Analysis, Insights and Forecast - By Country/Sub-region
- 15.1.1 Saudi Arabia
- 15.1.2 South Africa
- 15.1.3 Rest of Middle East and Africa
- 16. Competitive Analysis
- 16.1. Global Market Share Analysis 2024
- 16.2. Company Profiles
- 16.2.1 Niteo Products Inc
- 16.2.1.1. Overview
- 16.2.1.2. Products
- 16.2.1.3. SWOT Analysis
- 16.2.1.4. Recent Developments
- 16.2.1.5. Financials (Based on Availability)
- 16.2.2 SONAX GmbH
- 16.2.2.1. Overview
- 16.2.2.2. Products
- 16.2.2.3. SWOT Analysis
- 16.2.2.4. Recent Developments
- 16.2.2.5. Financials (Based on Availability)
- 16.2.3 Guangzhou Biaobang Car Care Industry Co Ltd
- 16.2.3.1. Overview
- 16.2.3.2. Products
- 16.2.3.3. SWOT Analysis
- 16.2.3.4. Recent Developments
- 16.2.3.5. Financials (Based on Availability)
- 16.2.4 3M
- 16.2.4.1. Overview
- 16.2.4.2. Products
- 16.2.4.3. SWOT Analysis
- 16.2.4.4. Recent Developments
- 16.2.4.5. Financials (Based on Availability)
- 16.2.5 Tetrosyl Ltd
- 16.2.5.1. Overview
- 16.2.5.2. Products
- 16.2.5.3. SWOT Analysis
- 16.2.5.4. Recent Developments
- 16.2.5.5. Financials (Based on Availability)
- 16.2.6 Nuvite Chemical Compounds
- 16.2.6.1. Overview
- 16.2.6.2. Products
- 16.2.6.3. SWOT Analysis
- 16.2.6.4. Recent Developments
- 16.2.6.5. Financials (Based on Availability)
- 16.2.7 Dow
- 16.2.7.1. Overview
- 16.2.7.2. Products
- 16.2.7.3. SWOT Analysis
- 16.2.7.4. Recent Developments
- 16.2.7.5. Financials (Based on Availability)
- 16.2.8 ITW Global Brands
- 16.2.8.1. Overview
- 16.2.8.2. Products
- 16.2.8.3. SWOT Analysis
- 16.2.8.4. Recent Developments
- 16.2.8.5. Financials (Based on Availability)
- 16.2.9 Turtle Wax Inc
- 16.2.9.1. Overview
- 16.2.9.2. Products
- 16.2.9.3. SWOT Analysis
- 16.2.9.4. Recent Developments
- 16.2.9.5. Financials (Based on Availability)
- 16.2.10 LIQUI MOLY GmbH
- 16.2.10.1. Overview
- 16.2.10.2. Products
- 16.2.10.3. SWOT Analysis
- 16.2.10.4. Recent Developments
- 16.2.10.5. Financials (Based on Availability)
- 16.2.11 Valvoline Chemicals*List Not Exhaustive
- 16.2.11.1. Overview
- 16.2.11.2. Products
- 16.2.11.3. SWOT Analysis
- 16.2.11.4. Recent Developments
- 16.2.11.5. Financials (Based on Availability)
- 16.2.12 General Chemical Corp
- 16.2.12.1. Overview
- 16.2.12.2. Products
- 16.2.12.3. SWOT Analysis
- 16.2.12.4. Recent Developments
- 16.2.12.5. Financials (Based on Availability)
- 16.2.1 Niteo Products Inc
List of Figures
- Figure 1: Global Automotive Appearance Chemicals Market Revenue Breakdown (Million, %) by Region 2024 & 2032
- Figure 2: Asia Pacific Automotive Appearance Chemicals Market Revenue (Million), by Country 2024 & 2032
- Figure 3: Asia Pacific Automotive Appearance Chemicals Market Revenue Share (%), by Country 2024 & 2032
- Figure 4: North America Automotive Appearance Chemicals Market Revenue (Million), by Country 2024 & 2032
- Figure 5: North America Automotive Appearance Chemicals Market Revenue Share (%), by Country 2024 & 2032
- Figure 6: Europe Automotive Appearance Chemicals Market Revenue (Million), by Country 2024 & 2032
- Figure 7: Europe Automotive Appearance Chemicals Market Revenue Share (%), by Country 2024 & 2032
- Figure 8: South America Automotive Appearance Chemicals Market Revenue (Million), by Country 2024 & 2032
- Figure 9: South America Automotive Appearance Chemicals Market Revenue Share (%), by Country 2024 & 2032
- Figure 10: Middle East and Africa Automotive Appearance Chemicals Market Revenue (Million), by Country 2024 & 2032
- Figure 11: Middle East and Africa Automotive Appearance Chemicals Market Revenue Share (%), by Country 2024 & 2032
- Figure 12: Asia Pacific Automotive Appearance Chemicals Market Revenue (Million), by Product Type 2024 & 2032
- Figure 13: Asia Pacific Automotive Appearance Chemicals Market Revenue Share (%), by Product Type 2024 & 2032
- Figure 14: Asia Pacific Automotive Appearance Chemicals Market Revenue (Million), by Application 2024 & 2032
- Figure 15: Asia Pacific Automotive Appearance Chemicals Market Revenue Share (%), by Application 2024 & 2032
- Figure 16: Asia Pacific Automotive Appearance Chemicals Market Revenue (Million), by Country 2024 & 2032
- Figure 17: Asia Pacific Automotive Appearance Chemicals Market Revenue Share (%), by Country 2024 & 2032
- Figure 18: North America Automotive Appearance Chemicals Market Revenue (Million), by Product Type 2024 & 2032
- Figure 19: North America Automotive Appearance Chemicals Market Revenue Share (%), by Product Type 2024 & 2032
- Figure 20: North America Automotive Appearance Chemicals Market Revenue (Million), by Application 2024 & 2032
- Figure 21: North America Automotive Appearance Chemicals Market Revenue Share (%), by Application 2024 & 2032
- Figure 22: North America Automotive Appearance Chemicals Market Revenue (Million), by Country 2024 & 2032
- Figure 23: North America Automotive Appearance Chemicals Market Revenue Share (%), by Country 2024 & 2032
- Figure 24: Europe Automotive Appearance Chemicals Market Revenue (Million), by Product Type 2024 & 2032
- Figure 25: Europe Automotive Appearance Chemicals Market Revenue Share (%), by Product Type 2024 & 2032
- Figure 26: Europe Automotive Appearance Chemicals Market Revenue (Million), by Application 2024 & 2032
- Figure 27: Europe Automotive Appearance Chemicals Market Revenue Share (%), by Application 2024 & 2032
- Figure 28: Europe Automotive Appearance Chemicals Market Revenue (Million), by Country 2024 & 2032
- Figure 29: Europe Automotive Appearance Chemicals Market Revenue Share (%), by Country 2024 & 2032
- Figure 30: South America Automotive Appearance Chemicals Market Revenue (Million), by Product Type 2024 & 2032
- Figure 31: South America Automotive Appearance Chemicals Market Revenue Share (%), by Product Type 2024 & 2032
- Figure 32: South America Automotive Appearance Chemicals Market Revenue (Million), by Application 2024 & 2032
- Figure 33: South America Automotive Appearance Chemicals Market Revenue Share (%), by Application 2024 & 2032
- Figure 34: South America Automotive Appearance Chemicals Market Revenue (Million), by Country 2024 & 2032
- Figure 35: South America Automotive Appearance Chemicals Market Revenue Share (%), by Country 2024 & 2032
- Figure 36: Middle East and Africa Automotive Appearance Chemicals Market Revenue (Million), by Product Type 2024 & 2032
- Figure 37: Middle East and Africa Automotive Appearance Chemicals Market Revenue Share (%), by Product Type 2024 & 2032
- Figure 38: Middle East and Africa Automotive Appearance Chemicals Market Revenue (Million), by Application 2024 & 2032
- Figure 39: Middle East and Africa Automotive Appearance Chemicals Market Revenue Share (%), by Application 2024 & 2032
- Figure 40: Middle East and Africa Automotive Appearance Chemicals Market Revenue (Million), by Country 2024 & 2032
- Figure 41: Middle East and Africa Automotive Appearance Chemicals Market Revenue Share (%), by Country 2024 & 2032
List of Tables
- Table 1: Global Automotive Appearance Chemicals Market Revenue Million Forecast, by Region 2019 & 2032
- Table 2: Global Automotive Appearance Chemicals Market Revenue Million Forecast, by Product Type 2019 & 2032
- Table 3: Global Automotive Appearance Chemicals Market Revenue Million Forecast, by Application 2019 & 2032
- Table 4: Global Automotive Appearance Chemicals Market Revenue Million Forecast, by Region 2019 & 2032
- Table 5: Global Automotive Appearance Chemicals Market Revenue Million Forecast, by Country 2019 & 2032
- Table 6: China Automotive Appearance Chemicals Market Revenue (Million) Forecast, by Application 2019 & 2032
- Table 7: India Automotive Appearance Chemicals Market Revenue (Million) Forecast, by Application 2019 & 2032
- Table 8: Japan Automotive Appearance Chemicals Market Revenue (Million) Forecast, by Application 2019 & 2032
- Table 9: South Korea Automotive Appearance Chemicals Market Revenue (Million) Forecast, by Application 2019 & 2032
- Table 10: Rest of Asia Pacific Automotive Appearance Chemicals Market Revenue (Million) Forecast, by Application 2019 & 2032
- Table 11: Global Automotive Appearance Chemicals Market Revenue Million Forecast, by Country 2019 & 2032
- Table 12: United States Automotive Appearance Chemicals Market Revenue (Million) Forecast, by Application 2019 & 2032
- Table 13: Canada Automotive Appearance Chemicals Market Revenue (Million) Forecast, by Application 2019 & 2032
- Table 14: Mexico Automotive Appearance Chemicals Market Revenue (Million) Forecast, by Application 2019 & 2032
- Table 15: Global Automotive Appearance Chemicals Market Revenue Million Forecast, by Country 2019 & 2032
- Table 16: Germany Automotive Appearance Chemicals Market Revenue (Million) Forecast, by Application 2019 & 2032
- Table 17: United Kingdom Automotive Appearance Chemicals Market Revenue (Million) Forecast, by Application 2019 & 2032
- Table 18: France Automotive Appearance Chemicals Market Revenue (Million) Forecast, by Application 2019 & 2032
- Table 19: Italy Automotive Appearance Chemicals Market Revenue (Million) Forecast, by Application 2019 & 2032
- Table 20: Rest of Europe Automotive Appearance Chemicals Market Revenue (Million) Forecast, by Application 2019 & 2032
- Table 21: Global Automotive Appearance Chemicals Market Revenue Million Forecast, by Country 2019 & 2032
- Table 22: Brazil Automotive Appearance Chemicals Market Revenue (Million) Forecast, by Application 2019 & 2032
- Table 23: Argentina Automotive Appearance Chemicals Market Revenue (Million) Forecast, by Application 2019 & 2032
- Table 24: Rest of South America Automotive Appearance Chemicals Market Revenue (Million) Forecast, by Application 2019 & 2032
- Table 25: Global Automotive Appearance Chemicals Market Revenue Million Forecast, by Country 2019 & 2032
- Table 26: Saudi Arabia Automotive Appearance Chemicals Market Revenue (Million) Forecast, by Application 2019 & 2032
- Table 27: South Africa Automotive Appearance Chemicals Market Revenue (Million) Forecast, by Application 2019 & 2032
- Table 28: Rest of Middle East and Africa Automotive Appearance Chemicals Market Revenue (Million) Forecast, by Application 2019 & 2032
- Table 29: Global Automotive Appearance Chemicals Market Revenue Million Forecast, by Product Type 2019 & 2032
- Table 30: Global Automotive Appearance Chemicals Market Revenue Million Forecast, by Application 2019 & 2032
- Table 31: Global Automotive Appearance Chemicals Market Revenue Million Forecast, by Country 2019 & 2032
- Table 32: China Automotive Appearance Chemicals Market Revenue (Million) Forecast, by Application 2019 & 2032
- Table 33: India Automotive Appearance Chemicals Market Revenue (Million) Forecast, by Application 2019 & 2032
- Table 34: Japan Automotive Appearance Chemicals Market Revenue (Million) Forecast, by Application 2019 & 2032
- Table 35: South Korea Automotive Appearance Chemicals Market Revenue (Million) Forecast, by Application 2019 & 2032
- Table 36: Rest of Asia Pacific Automotive Appearance Chemicals Market Revenue (Million) Forecast, by Application 2019 & 2032
- Table 37: Global Automotive Appearance Chemicals Market Revenue Million Forecast, by Product Type 2019 & 2032
- Table 38: Global Automotive Appearance Chemicals Market Revenue Million Forecast, by Application 2019 & 2032
- Table 39: Global Automotive Appearance Chemicals Market Revenue Million Forecast, by Country 2019 & 2032
- Table 40: United States Automotive Appearance Chemicals Market Revenue (Million) Forecast, by Application 2019 & 2032
- Table 41: Canada Automotive Appearance Chemicals Market Revenue (Million) Forecast, by Application 2019 & 2032
- Table 42: Mexico Automotive Appearance Chemicals Market Revenue (Million) Forecast, by Application 2019 & 2032
- Table 43: Global Automotive Appearance Chemicals Market Revenue Million Forecast, by Product Type 2019 & 2032
- Table 44: Global Automotive Appearance Chemicals Market Revenue Million Forecast, by Application 2019 & 2032
- Table 45: Global Automotive Appearance Chemicals Market Revenue Million Forecast, by Country 2019 & 2032
- Table 46: Germany Automotive Appearance Chemicals Market Revenue (Million) Forecast, by Application 2019 & 2032
- Table 47: United Kingdom Automotive Appearance Chemicals Market Revenue (Million) Forecast, by Application 2019 & 2032
- Table 48: France Automotive Appearance Chemicals Market Revenue (Million) Forecast, by Application 2019 & 2032
- Table 49: Italy Automotive Appearance Chemicals Market Revenue (Million) Forecast, by Application 2019 & 2032
- Table 50: Rest of Europe Automotive Appearance Chemicals Market Revenue (Million) Forecast, by Application 2019 & 2032
- Table 51: Global Automotive Appearance Chemicals Market Revenue Million Forecast, by Product Type 2019 & 2032
- Table 52: Global Automotive Appearance Chemicals Market Revenue Million Forecast, by Application 2019 & 2032
- Table 53: Global Automotive Appearance Chemicals Market Revenue Million Forecast, by Country 2019 & 2032
- Table 54: Brazil Automotive Appearance Chemicals Market Revenue (Million) Forecast, by Application 2019 & 2032
- Table 55: Argentina Automotive Appearance Chemicals Market Revenue (Million) Forecast, by Application 2019 & 2032
- Table 56: Rest of South America Automotive Appearance Chemicals Market Revenue (Million) Forecast, by Application 2019 & 2032
- Table 57: Global Automotive Appearance Chemicals Market Revenue Million Forecast, by Product Type 2019 & 2032
- Table 58: Global Automotive Appearance Chemicals Market Revenue Million Forecast, by Application 2019 & 2032
- Table 59: Global Automotive Appearance Chemicals Market Revenue Million Forecast, by Country 2019 & 2032
- Table 60: Saudi Arabia Automotive Appearance Chemicals Market Revenue (Million) Forecast, by Application 2019 & 2032
- Table 61: South Africa Automotive Appearance Chemicals Market Revenue (Million) Forecast, by Application 2019 & 2032
- Table 62: Rest of Middle East and Africa Automotive Appearance Chemicals Market Revenue (Million) Forecast, by Application 2019 & 2032
Frequently Asked Questions
1. What is the projected Compound Annual Growth Rate (CAGR) of the Automotive Appearance Chemicals Market?
The projected CAGR is approximately 3.34%.
2. Which companies are prominent players in the Automotive Appearance Chemicals Market?
Key companies in the market include Niteo Products Inc, SONAX GmbH, Guangzhou Biaobang Car Care Industry Co Ltd, 3M, Tetrosyl Ltd, Nuvite Chemical Compounds, Dow, ITW Global Brands, Turtle Wax Inc, LIQUI MOLY GmbH, Valvoline Chemicals*List Not Exhaustive, General Chemical Corp.
3. What are the main segments of the Automotive Appearance Chemicals Market?
The market segments include Product Type, Application.
4. Can you provide details about the market size?
The market size is estimated to be USD 1.19 Million as of 2022.
5. What are some drivers contributing to market growth?
Increase in the Production of Electric Vehicles (EV); Increase in Consumer Awareness Toward Vehicle Maintenance; Other Drivers.
6. What are the notable trends driving market growth?
Increase in the Production of Electric Vehicles.
7. Are there any restraints impacting market growth?
Stringent Government Regulations on Petroleum Products like Waxes and Coatings; Other Restraints.
8. Can you provide examples of recent developments in the market?
Recent developments in the market studied will be covered in the complete report.
9. What pricing options are available for accessing the report?
Pricing options include single-user, multi-user, and enterprise licenses priced at USD 4750, USD 5250, and USD 8750 respectively.
10. Is the market size provided in terms of value or volume?
The market size is provided in terms of value, measured in Million.
11. Are there any specific market keywords associated with the report?
Yes, the market keyword associated with the report is "Automotive Appearance Chemicals Market," which aids in identifying and referencing the specific market segment covered.
12. How do I determine which pricing option suits my needs best?
The pricing options vary based on user requirements and access needs. Individual users may opt for single-user licenses, while businesses requiring broader access may choose multi-user or enterprise licenses for cost-effective access to the report.
13. Are there any additional resources or data provided in the Automotive Appearance Chemicals Market report?
While the report offers comprehensive insights, it's advisable to review the specific contents or supplementary materials provided to ascertain if additional resources or data are available.
14. How can I stay updated on further developments or reports in the Automotive Appearance Chemicals Market?
To stay informed about further developments, trends, and reports in the Automotive Appearance Chemicals Market, consider subscribing to industry newsletters, following relevant companies and organizations, or regularly checking reputable industry news sources and publications.
Methodology
Step 1 - Identification of Relevant Samples Size from Population Database


Step 2 - Approaches for Defining Global Market Size (Value, Volume* & Price*)

Note*: In applicable scenarios
Step 3 - Data Sources
Primary Research
- Web Analytics
- Survey Reports
- Research Institute
- Latest Research Reports
- Opinion Leaders
Secondary Research
- Annual Reports
- White Paper
- Latest Press Release
- Industry Association
- Paid Database
- Investor Presentations

Step 4 - Data Triangulation
Involves using different sources of information in order to increase the validity of a study
These sources are likely to be stakeholders in a program - participants, other researchers, program staff, other community members, and so on.
Then we put all data in single framework & apply various statistical tools to find out the dynamic on the market.
During the analysis stage, feedback from the stakeholder groups would be compared to determine areas of agreement as well as areas of divergence
