

Key Insights
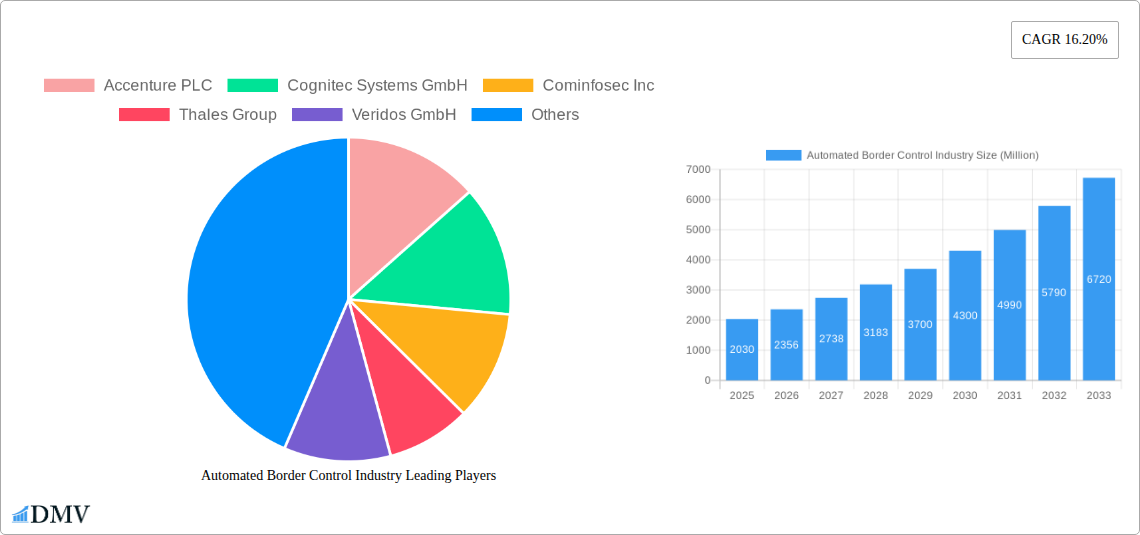
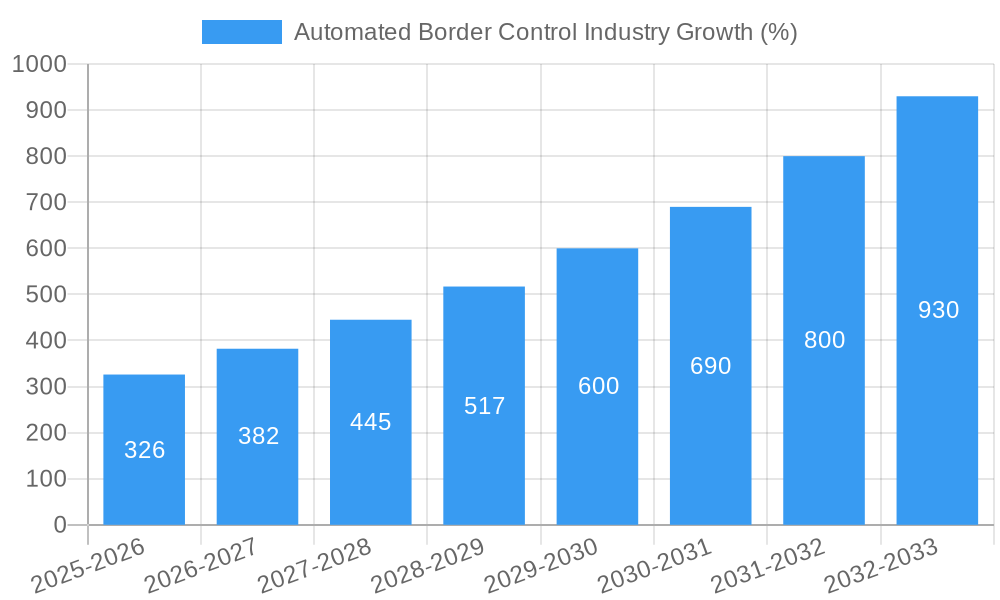
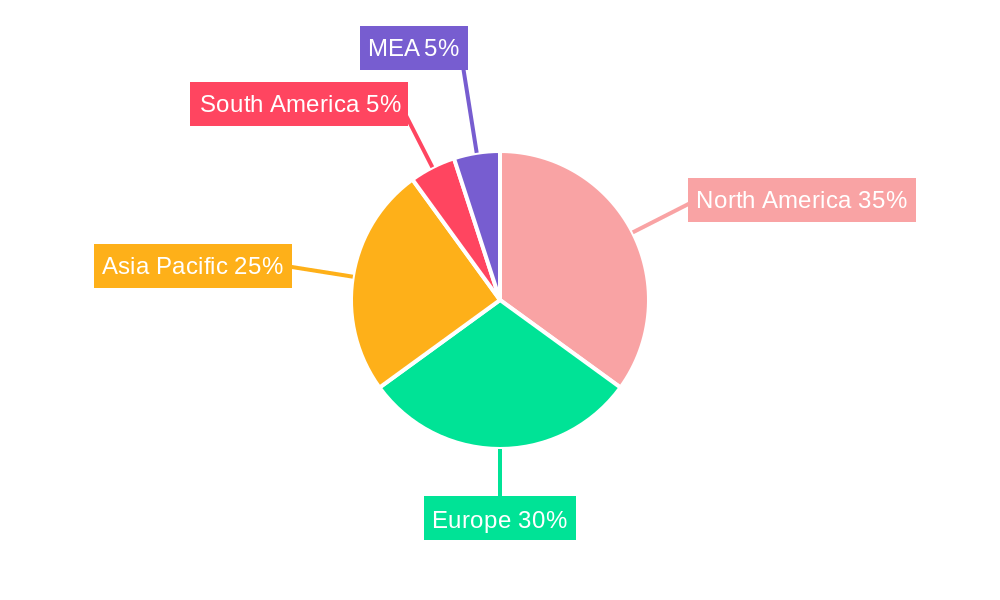
The Automated Border Control (ABC) industry is experiencing robust growth, projected to reach \$2.03 billion in 2025 and maintain a Compound Annual Growth Rate (CAGR) of 16.20% from 2025 to 2033. This expansion is driven by increasing passenger traffic at global airports, seaports, and land borders, coupled with heightened security concerns and the need for efficient border management. Governments worldwide are investing heavily in advanced technologies to streamline passenger processing, enhance security screenings, and reduce wait times. The integration of biometric verification systems, including facial, fingerprint, iris, palm, and vein recognition, is a key driver, providing accurate and rapid identification. Furthermore, the shift towards digitalization and the adoption of e-gates and kiosks are contributing significantly to market growth. Software solutions for data management and analysis are also witnessing increasing demand, complementing the hardware components. While initial infrastructure investments can represent a restraint, the long-term cost savings and improved efficiency outweigh these initial hurdles. The market is segmented by type (e-gates, kiosks), offerings (hardware, software, services, biometric verification systems), and application (airports, land ports, seaports). North America and Europe currently hold significant market shares, but the Asia-Pacific region is poised for rapid growth due to increasing infrastructure development and government initiatives.
The competitive landscape includes established players like Accenture, Thales Group, and HID Global, alongside specialized biometric technology providers and system integrators. Success in this market requires a combination of technological expertise, strong partnerships with government agencies, and a deep understanding of regulatory requirements. Future growth will be influenced by advancements in biometric technologies, the development of interoperable systems, and the increasing adoption of artificial intelligence and machine learning for enhanced security and efficiency. The industry's focus on data privacy and security will also play a significant role in shaping future market dynamics. Ongoing research and development efforts will likely lead to more sophisticated and user-friendly ABC systems, further driving market expansion. The continued focus on improving passenger experience while simultaneously bolstering border security will continue to propel the market forward.
Automated Border Control Industry: A Comprehensive Market Report (2019-2033)
This insightful report delivers a comprehensive analysis of the Automated Border Control (ABC) industry, projecting a market valuation of xx Million by 2033. It provides a detailed examination of market dynamics, technological advancements, key players, and future growth opportunities, empowering stakeholders with data-driven insights for strategic decision-making. The study period spans 2019-2033, with 2025 serving as the base and estimated year. The forecast period covers 2025-2033, while the historical period encompasses 2019-2024.
Automated Border Control Industry Market Composition & Trends
The Automated Border Control industry is experiencing significant growth fueled by increasing passenger traffic, stringent security regulations, and advancements in biometric technologies. Market concentration is moderate, with several key players holding substantial market share, but a considerable number of smaller, specialized companies also contributing. The market is witnessing considerable innovation, driven by the need for enhanced security, efficiency, and passenger experience. Regulatory landscapes vary significantly across regions, impacting adoption rates and technological choices. Substitute products are limited, primarily focusing on traditional manual border control processes, which are becoming increasingly inefficient and costly. End-users are primarily government agencies responsible for border management at airports, land ports, and seaports. Mergers and acquisitions (M&A) activities are frequent, with deal values reaching xx Million annually, reflecting the industry's consolidation and expansion efforts.
- Market Share Distribution: Top 5 players account for approximately xx% of the market share.
- M&A Deal Values (2019-2024): Averaged xx Million annually.
- Key Innovation Catalysts: Advancements in biometric technologies (face, fingerprint, iris, palm vein recognition), AI-powered risk assessment, and improved data analytics.
- Regulatory Landscape: Significant regional variations exist, influencing technology adoption and deployment strategies.
Automated Border Control Industry Industry Evolution
The Automated Border Control industry has witnessed remarkable growth in recent years, driven by a confluence of factors. Technological advancements, such as the integration of advanced biometric verification systems (BVS) and AI-powered analytics, have significantly enhanced border security and processing efficiency. This has led to a substantial increase in the adoption of ABC solutions across various applications, especially in airports where passenger volumes are highest. The demand for seamless and secure travel experiences has further fueled market growth, with end-users continuously seeking to improve the overall passenger journey.
Between 2019 and 2024, the market experienced a Compound Annual Growth Rate (CAGR) of xx%, reaching a value of xx Million in 2024. The adoption rate of ABC technologies is projected to increase steadily, driven by government investments and increasing passenger traffic. By 2033, the market is anticipated to reach xx Million, demonstrating robust and sustained growth.
Leading Regions, Countries, or Segments in Automated Border Control Industry
The ABC industry is geographically diverse, with significant variations in adoption rates and market maturity across different regions. Airports currently dominate the application segment, driven by high passenger volumes and the need for efficient passenger processing. Within the offerings segment, hardware (e-gates and kiosks) constitutes a major share, although the demand for software and services is growing rapidly. Biometric verification systems, particularly face recognition, are experiencing high growth, owing to their accuracy and ease of use.
- Key Drivers (Airports): High passenger volume, stringent security requirements, investments in airport infrastructure upgrades.
- Key Drivers (Face Recognition BVS): High accuracy, ease of use, non-intrusive nature.
- Regional Dominance: North America and Europe currently lead in ABC adoption, but Asia-Pacific is experiencing rapid growth.
Automated Border Control Industry Product Innovations
Recent product innovations focus on enhancing security, efficiency, and user experience. New biometric technologies such as palm and vein recognition are gaining traction, offering improved accuracy and security. AI-powered risk assessment systems are being integrated to improve detection of potential threats, while user-friendly interfaces are simplifying the passenger experience. The integration of advanced data analytics capabilities allows for real-time monitoring and improved decision-making. These enhancements are boosting efficiency and strengthening security measures.
Propelling Factors for Automated Border Control Industry Growth
Several factors are propelling the growth of the Automated Border Control industry. Technological advancements in biometric systems, artificial intelligence (AI), and data analytics are improving accuracy, efficiency, and security. Government investments in infrastructure upgrades and enhanced border security measures are boosting market growth. Increasing passenger traffic, particularly in major airports, is driving the demand for efficient and reliable border control solutions. Furthermore, stricter security regulations globally are further incentivizing the adoption of automated systems.
Obstacles in the Automated Border Control Industry Market
Despite promising growth, the industry faces several challenges. Regulatory hurdles and differing standards across countries can complicate the deployment and standardization of ABC technologies. Supply chain disruptions and the availability of crucial components can impact production and deployment timelines. High upfront investment costs and the need for ongoing maintenance can be a barrier for smaller airports and border crossing points. Finally, intense competition among established players and emerging technology companies presents significant competitive pressures.
Future Opportunities in Automated Border Control Industry
Future opportunities are plentiful. Expansion into new markets, particularly in developing countries with growing tourism and trade, represents a substantial growth potential. The integration of advanced AI and machine learning capabilities will further enhance security and efficiency. The development of innovative biometric modalities, such as gait recognition and behavioral analysis, will lead to enhanced security. Focus on improving user experience through intuitive interfaces and seamless integration with other travel systems will further drive adoption.
Major Players in the Automated Border Control Industry Ecosystem
- Accenture PLC
- Cognitec Systems GmbH
- Cominfosec Inc
- Thales Group
- Veridos GmbH
- HID Global Corporation
- Atos SE
- Rockwell Collins Aerospace and Electronics Inc
- NEC Technologies India Pvt Ltd
- Gunnebo Group Corporation
- Magnetic Autocontrol GmbH
Key Developments in Automated Border Control Industry Industry
- July 2022: The U.K. Home Secretary announced plans for contactless border checkpoints, initiating technology testing for automated border inspection without eGates or Border Force interaction, with a pilot program planned for 2024. This signals a significant shift toward more automated border processes.
- June 2022: Bangladesh launched electronic airport checkpoints at Hazrat Shahjalal International Airport, allowing e-passport holders to use e-gates, representing a first for South Asia and showcasing the growing adoption of ABC in the region.
- April 2022: Smiths Detection released iCMORE Money, a currency identification software for automated detection, enhancing security measures for hand baggage and daypacks.
Strategic Automated Border Control Industry Market Forecast
The Automated Border Control industry is poised for substantial growth over the next decade. Driven by technological advancements, increasing passenger traffic, and rising security concerns, the market is projected to experience robust expansion. The focus on enhanced security measures, improved efficiency, and streamlined passenger experience will continue to fuel demand. New technologies, such as AI-powered risk assessment and advanced biometric verification, will further propel market growth, creating significant opportunities for industry players. The market is expected to witness increasing consolidation through mergers and acquisitions, shaping the future landscape of border control technologies.
Automated Border Control Industry Segmentation
-
1. Type
- 1.1. ABC E-gates
- 1.2. ABC Kiosks
-
2. Offerings
- 2.1. Hardware
- 2.2. Software
- 2.3. Services
-
3. Application
- 3.1. Airports
- 3.2. Land ports
- 3.3. Seaports
Automated Border Control Industry Segmentation By Geography
- 1. North America
- 2. Europe
- 3. Asia Pacific
- 4. Rest of the World
Automated Border Control Industry REPORT HIGHLIGHTS
| Aspects | Details |
|---|---|
| Study Period | 2019-2033 |
| Base Year | 2024 |
| Estimated Year | 2025 |
| Forecast Period | 2025-2033 |
| Historical Period | 2019-2024 |
| Growth Rate | CAGR of 16.20% from 2019-2033 |
| Segmentation |
|
Table of Contents
- 1. Introduction
- 1.1. Research Scope
- 1.2. Market Segmentation
- 1.3. Research Methodology
- 1.4. Definitions and Assumptions
- 2. Executive Summary
- 2.1. Introduction
- 3. Market Dynamics
- 3.1. Introduction
- 3.2. Market Drivers
- 3.2.1. Growing Need of API Monitoring in the Digital Economy; The Increasing Use of Test Automation Leads to Lower the Operational Costs and Enhance the QA
- 3.3. Market Restrains
- 3.3.1. High Initial Setup Cost; Large Installation Space
- 3.4. Market Trends
- 3.4.1. Airport Applications are Expected to Witness a Rapid Growth
- 4. Market Factor Analysis
- 4.1. Porters Five Forces
- 4.2. Supply/Value Chain
- 4.3. PESTEL analysis
- 4.4. Market Entropy
- 4.5. Patent/Trademark Analysis
- 5. Global Automated Border Control Industry Analysis, Insights and Forecast, 2019-2031
- 5.1. Market Analysis, Insights and Forecast - by Type
- 5.1.1. ABC E-gates
- 5.1.2. ABC Kiosks
- 5.2. Market Analysis, Insights and Forecast - by Offerings
- 5.2.1. Hardware
- 5.2.2. Software
- 5.2.3. Services
- 5.3. Market Analysis, Insights and Forecast - by Application
- 5.3.1. Airports
- 5.3.2. Land ports
- 5.3.3. Seaports
- 5.4. Market Analysis, Insights and Forecast - by Region
- 5.4.1. North America
- 5.4.2. Europe
- 5.4.3. Asia Pacific
- 5.4.4. Rest of the World
- 5.1. Market Analysis, Insights and Forecast - by Type
- 6. North America Automated Border Control Industry Analysis, Insights and Forecast, 2019-2031
- 6.1. Market Analysis, Insights and Forecast - by Type
- 6.1.1. ABC E-gates
- 6.1.2. ABC Kiosks
- 6.2. Market Analysis, Insights and Forecast - by Offerings
- 6.2.1. Hardware
- 6.2.2. Software
- 6.2.3. Services
- 6.3. Market Analysis, Insights and Forecast - by Application
- 6.3.1. Airports
- 6.3.2. Land ports
- 6.3.3. Seaports
- 6.1. Market Analysis, Insights and Forecast - by Type
- 7. Europe Automated Border Control Industry Analysis, Insights and Forecast, 2019-2031
- 7.1. Market Analysis, Insights and Forecast - by Type
- 7.1.1. ABC E-gates
- 7.1.2. ABC Kiosks
- 7.2. Market Analysis, Insights and Forecast - by Offerings
- 7.2.1. Hardware
- 7.2.2. Software
- 7.2.3. Services
- 7.3. Market Analysis, Insights and Forecast - by Application
- 7.3.1. Airports
- 7.3.2. Land ports
- 7.3.3. Seaports
- 7.1. Market Analysis, Insights and Forecast - by Type
- 8. Asia Pacific Automated Border Control Industry Analysis, Insights and Forecast, 2019-2031
- 8.1. Market Analysis, Insights and Forecast - by Type
- 8.1.1. ABC E-gates
- 8.1.2. ABC Kiosks
- 8.2. Market Analysis, Insights and Forecast - by Offerings
- 8.2.1. Hardware
- 8.2.2. Software
- 8.2.3. Services
- 8.3. Market Analysis, Insights and Forecast - by Application
- 8.3.1. Airports
- 8.3.2. Land ports
- 8.3.3. Seaports
- 8.1. Market Analysis, Insights and Forecast - by Type
- 9. Rest of the World Automated Border Control Industry Analysis, Insights and Forecast, 2019-2031
- 9.1. Market Analysis, Insights and Forecast - by Type
- 9.1.1. ABC E-gates
- 9.1.2. ABC Kiosks
- 9.2. Market Analysis, Insights and Forecast - by Offerings
- 9.2.1. Hardware
- 9.2.2. Software
- 9.2.3. Services
- 9.3. Market Analysis, Insights and Forecast - by Application
- 9.3.1. Airports
- 9.3.2. Land ports
- 9.3.3. Seaports
- 9.1. Market Analysis, Insights and Forecast - by Type
- 10. North America Automated Border Control Industry Analysis, Insights and Forecast, 2019-2031
- 10.1. Market Analysis, Insights and Forecast - By Country/Sub-region
- 10.1.1 United States
- 10.1.2 Canada
- 10.1.3 Mexico
- 11. Europe Automated Border Control Industry Analysis, Insights and Forecast, 2019-2031
- 11.1. Market Analysis, Insights and Forecast - By Country/Sub-region
- 11.1.1 Germany
- 11.1.2 United Kingdom
- 11.1.3 France
- 11.1.4 Spain
- 11.1.5 Italy
- 11.1.6 Spain
- 11.1.7 Belgium
- 11.1.8 Netherland
- 11.1.9 Nordics
- 11.1.10 Rest of Europe
- 12. Asia Pacific Automated Border Control Industry Analysis, Insights and Forecast, 2019-2031
- 12.1. Market Analysis, Insights and Forecast - By Country/Sub-region
- 12.1.1 China
- 12.1.2 Japan
- 12.1.3 India
- 12.1.4 South Korea
- 12.1.5 Southeast Asia
- 12.1.6 Australia
- 12.1.7 Indonesia
- 12.1.8 Phillipes
- 12.1.9 Singapore
- 12.1.10 Thailandc
- 12.1.11 Rest of Asia Pacific
- 13. South America Automated Border Control Industry Analysis, Insights and Forecast, 2019-2031
- 13.1. Market Analysis, Insights and Forecast - By Country/Sub-region
- 13.1.1 Brazil
- 13.1.2 Argentina
- 13.1.3 Peru
- 13.1.4 Chile
- 13.1.5 Colombia
- 13.1.6 Ecuador
- 13.1.7 Venezuela
- 13.1.8 Rest of South America
- 14. North America Automated Border Control Industry Analysis, Insights and Forecast, 2019-2031
- 14.1. Market Analysis, Insights and Forecast - By Country/Sub-region
- 14.1.1 United States
- 14.1.2 Canada
- 14.1.3 Mexico
- 15. MEA Automated Border Control Industry Analysis, Insights and Forecast, 2019-2031
- 15.1. Market Analysis, Insights and Forecast - By Country/Sub-region
- 15.1.1 United Arab Emirates
- 15.1.2 Saudi Arabia
- 15.1.3 South Africa
- 15.1.4 Rest of Middle East and Africa
- 16. Competitive Analysis
- 16.1. Global Market Share Analysis 2024
- 16.2. Company Profiles
- 16.2.1 Accenture PLC
- 16.2.1.1. Overview
- 16.2.1.2. Products
- 16.2.1.3. SWOT Analysis
- 16.2.1.4. Recent Developments
- 16.2.1.5. Financials (Based on Availability)
- 16.2.2 Cognitec Systems GmbH
- 16.2.2.1. Overview
- 16.2.2.2. Products
- 16.2.2.3. SWOT Analysis
- 16.2.2.4. Recent Developments
- 16.2.2.5. Financials (Based on Availability)
- 16.2.3 Cominfosec Inc
- 16.2.3.1. Overview
- 16.2.3.2. Products
- 16.2.3.3. SWOT Analysis
- 16.2.3.4. Recent Developments
- 16.2.3.5. Financials (Based on Availability)
- 16.2.4 Thales Group
- 16.2.4.1. Overview
- 16.2.4.2. Products
- 16.2.4.3. SWOT Analysis
- 16.2.4.4. Recent Developments
- 16.2.4.5. Financials (Based on Availability)
- 16.2.5 Veridos GmbH
- 16.2.5.1. Overview
- 16.2.5.2. Products
- 16.2.5.3. SWOT Analysis
- 16.2.5.4. Recent Developments
- 16.2.5.5. Financials (Based on Availability)
- 16.2.6 HID Global Corporation
- 16.2.6.1. Overview
- 16.2.6.2. Products
- 16.2.6.3. SWOT Analysis
- 16.2.6.4. Recent Developments
- 16.2.6.5. Financials (Based on Availability)
- 16.2.7 Atos SE
- 16.2.7.1. Overview
- 16.2.7.2. Products
- 16.2.7.3. SWOT Analysis
- 16.2.7.4. Recent Developments
- 16.2.7.5. Financials (Based on Availability)
- 16.2.8 Rockwell Collins Aerospace and Electronics Inc
- 16.2.8.1. Overview
- 16.2.8.2. Products
- 16.2.8.3. SWOT Analysis
- 16.2.8.4. Recent Developments
- 16.2.8.5. Financials (Based on Availability)
- 16.2.9 NEC Technologies India Pvt Ltd
- 16.2.9.1. Overview
- 16.2.9.2. Products
- 16.2.9.3. SWOT Analysis
- 16.2.9.4. Recent Developments
- 16.2.9.5. Financials (Based on Availability)
- 16.2.10 Gunnebo Group Corporation
- 16.2.10.1. Overview
- 16.2.10.2. Products
- 16.2.10.3. SWOT Analysis
- 16.2.10.4. Recent Developments
- 16.2.10.5. Financials (Based on Availability)
- 16.2.11 Magnetic Autocontrol GmbH
- 16.2.11.1. Overview
- 16.2.11.2. Products
- 16.2.11.3. SWOT Analysis
- 16.2.11.4. Recent Developments
- 16.2.11.5. Financials (Based on Availability)
- 16.2.1 Accenture PLC
List of Figures
- Figure 1: Global Automated Border Control Industry Revenue Breakdown (Million, %) by Region 2024 & 2032
- Figure 2: Global Automated Border Control Industry Volume Breakdown (K Unit, %) by Region 2024 & 2032
- Figure 3: North America Automated Border Control Industry Revenue (Million), by Country 2024 & 2032
- Figure 4: North America Automated Border Control Industry Volume (K Unit), by Country 2024 & 2032
- Figure 5: North America Automated Border Control Industry Revenue Share (%), by Country 2024 & 2032
- Figure 6: North America Automated Border Control Industry Volume Share (%), by Country 2024 & 2032
- Figure 7: Europe Automated Border Control Industry Revenue (Million), by Country 2024 & 2032
- Figure 8: Europe Automated Border Control Industry Volume (K Unit), by Country 2024 & 2032
- Figure 9: Europe Automated Border Control Industry Revenue Share (%), by Country 2024 & 2032
- Figure 10: Europe Automated Border Control Industry Volume Share (%), by Country 2024 & 2032
- Figure 11: Asia Pacific Automated Border Control Industry Revenue (Million), by Country 2024 & 2032
- Figure 12: Asia Pacific Automated Border Control Industry Volume (K Unit), by Country 2024 & 2032
- Figure 13: Asia Pacific Automated Border Control Industry Revenue Share (%), by Country 2024 & 2032
- Figure 14: Asia Pacific Automated Border Control Industry Volume Share (%), by Country 2024 & 2032
- Figure 15: South America Automated Border Control Industry Revenue (Million), by Country 2024 & 2032
- Figure 16: South America Automated Border Control Industry Volume (K Unit), by Country 2024 & 2032
- Figure 17: South America Automated Border Control Industry Revenue Share (%), by Country 2024 & 2032
- Figure 18: South America Automated Border Control Industry Volume Share (%), by Country 2024 & 2032
- Figure 19: North America Automated Border Control Industry Revenue (Million), by Country 2024 & 2032
- Figure 20: North America Automated Border Control Industry Volume (K Unit), by Country 2024 & 2032
- Figure 21: North America Automated Border Control Industry Revenue Share (%), by Country 2024 & 2032
- Figure 22: North America Automated Border Control Industry Volume Share (%), by Country 2024 & 2032
- Figure 23: MEA Automated Border Control Industry Revenue (Million), by Country 2024 & 2032
- Figure 24: MEA Automated Border Control Industry Volume (K Unit), by Country 2024 & 2032
- Figure 25: MEA Automated Border Control Industry Revenue Share (%), by Country 2024 & 2032
- Figure 26: MEA Automated Border Control Industry Volume Share (%), by Country 2024 & 2032
- Figure 27: North America Automated Border Control Industry Revenue (Million), by Type 2024 & 2032
- Figure 28: North America Automated Border Control Industry Volume (K Unit), by Type 2024 & 2032
- Figure 29: North America Automated Border Control Industry Revenue Share (%), by Type 2024 & 2032
- Figure 30: North America Automated Border Control Industry Volume Share (%), by Type 2024 & 2032
- Figure 31: North America Automated Border Control Industry Revenue (Million), by Offerings 2024 & 2032
- Figure 32: North America Automated Border Control Industry Volume (K Unit), by Offerings 2024 & 2032
- Figure 33: North America Automated Border Control Industry Revenue Share (%), by Offerings 2024 & 2032
- Figure 34: North America Automated Border Control Industry Volume Share (%), by Offerings 2024 & 2032
- Figure 35: North America Automated Border Control Industry Revenue (Million), by Application 2024 & 2032
- Figure 36: North America Automated Border Control Industry Volume (K Unit), by Application 2024 & 2032
- Figure 37: North America Automated Border Control Industry Revenue Share (%), by Application 2024 & 2032
- Figure 38: North America Automated Border Control Industry Volume Share (%), by Application 2024 & 2032
- Figure 39: North America Automated Border Control Industry Revenue (Million), by Country 2024 & 2032
- Figure 40: North America Automated Border Control Industry Volume (K Unit), by Country 2024 & 2032
- Figure 41: North America Automated Border Control Industry Revenue Share (%), by Country 2024 & 2032
- Figure 42: North America Automated Border Control Industry Volume Share (%), by Country 2024 & 2032
- Figure 43: Europe Automated Border Control Industry Revenue (Million), by Type 2024 & 2032
- Figure 44: Europe Automated Border Control Industry Volume (K Unit), by Type 2024 & 2032
- Figure 45: Europe Automated Border Control Industry Revenue Share (%), by Type 2024 & 2032
- Figure 46: Europe Automated Border Control Industry Volume Share (%), by Type 2024 & 2032
- Figure 47: Europe Automated Border Control Industry Revenue (Million), by Offerings 2024 & 2032
- Figure 48: Europe Automated Border Control Industry Volume (K Unit), by Offerings 2024 & 2032
- Figure 49: Europe Automated Border Control Industry Revenue Share (%), by Offerings 2024 & 2032
- Figure 50: Europe Automated Border Control Industry Volume Share (%), by Offerings 2024 & 2032
- Figure 51: Europe Automated Border Control Industry Revenue (Million), by Application 2024 & 2032
- Figure 52: Europe Automated Border Control Industry Volume (K Unit), by Application 2024 & 2032
- Figure 53: Europe Automated Border Control Industry Revenue Share (%), by Application 2024 & 2032
- Figure 54: Europe Automated Border Control Industry Volume Share (%), by Application 2024 & 2032
- Figure 55: Europe Automated Border Control Industry Revenue (Million), by Country 2024 & 2032
- Figure 56: Europe Automated Border Control Industry Volume (K Unit), by Country 2024 & 2032
- Figure 57: Europe Automated Border Control Industry Revenue Share (%), by Country 2024 & 2032
- Figure 58: Europe Automated Border Control Industry Volume Share (%), by Country 2024 & 2032
- Figure 59: Asia Pacific Automated Border Control Industry Revenue (Million), by Type 2024 & 2032
- Figure 60: Asia Pacific Automated Border Control Industry Volume (K Unit), by Type 2024 & 2032
- Figure 61: Asia Pacific Automated Border Control Industry Revenue Share (%), by Type 2024 & 2032
- Figure 62: Asia Pacific Automated Border Control Industry Volume Share (%), by Type 2024 & 2032
- Figure 63: Asia Pacific Automated Border Control Industry Revenue (Million), by Offerings 2024 & 2032
- Figure 64: Asia Pacific Automated Border Control Industry Volume (K Unit), by Offerings 2024 & 2032
- Figure 65: Asia Pacific Automated Border Control Industry Revenue Share (%), by Offerings 2024 & 2032
- Figure 66: Asia Pacific Automated Border Control Industry Volume Share (%), by Offerings 2024 & 2032
- Figure 67: Asia Pacific Automated Border Control Industry Revenue (Million), by Application 2024 & 2032
- Figure 68: Asia Pacific Automated Border Control Industry Volume (K Unit), by Application 2024 & 2032
- Figure 69: Asia Pacific Automated Border Control Industry Revenue Share (%), by Application 2024 & 2032
- Figure 70: Asia Pacific Automated Border Control Industry Volume Share (%), by Application 2024 & 2032
- Figure 71: Asia Pacific Automated Border Control Industry Revenue (Million), by Country 2024 & 2032
- Figure 72: Asia Pacific Automated Border Control Industry Volume (K Unit), by Country 2024 & 2032
- Figure 73: Asia Pacific Automated Border Control Industry Revenue Share (%), by Country 2024 & 2032
- Figure 74: Asia Pacific Automated Border Control Industry Volume Share (%), by Country 2024 & 2032
- Figure 75: Rest of the World Automated Border Control Industry Revenue (Million), by Type 2024 & 2032
- Figure 76: Rest of the World Automated Border Control Industry Volume (K Unit), by Type 2024 & 2032
- Figure 77: Rest of the World Automated Border Control Industry Revenue Share (%), by Type 2024 & 2032
- Figure 78: Rest of the World Automated Border Control Industry Volume Share (%), by Type 2024 & 2032
- Figure 79: Rest of the World Automated Border Control Industry Revenue (Million), by Offerings 2024 & 2032
- Figure 80: Rest of the World Automated Border Control Industry Volume (K Unit), by Offerings 2024 & 2032
- Figure 81: Rest of the World Automated Border Control Industry Revenue Share (%), by Offerings 2024 & 2032
- Figure 82: Rest of the World Automated Border Control Industry Volume Share (%), by Offerings 2024 & 2032
- Figure 83: Rest of the World Automated Border Control Industry Revenue (Million), by Application 2024 & 2032
- Figure 84: Rest of the World Automated Border Control Industry Volume (K Unit), by Application 2024 & 2032
- Figure 85: Rest of the World Automated Border Control Industry Revenue Share (%), by Application 2024 & 2032
- Figure 86: Rest of the World Automated Border Control Industry Volume Share (%), by Application 2024 & 2032
- Figure 87: Rest of the World Automated Border Control Industry Revenue (Million), by Country 2024 & 2032
- Figure 88: Rest of the World Automated Border Control Industry Volume (K Unit), by Country 2024 & 2032
- Figure 89: Rest of the World Automated Border Control Industry Revenue Share (%), by Country 2024 & 2032
- Figure 90: Rest of the World Automated Border Control Industry Volume Share (%), by Country 2024 & 2032
List of Tables
- Table 1: Global Automated Border Control Industry Revenue Million Forecast, by Region 2019 & 2032
- Table 2: Global Automated Border Control Industry Volume K Unit Forecast, by Region 2019 & 2032
- Table 3: Global Automated Border Control Industry Revenue Million Forecast, by Type 2019 & 2032
- Table 4: Global Automated Border Control Industry Volume K Unit Forecast, by Type 2019 & 2032
- Table 5: Global Automated Border Control Industry Revenue Million Forecast, by Offerings 2019 & 2032
- Table 6: Global Automated Border Control Industry Volume K Unit Forecast, by Offerings 2019 & 2032
- Table 7: Global Automated Border Control Industry Revenue Million Forecast, by Application 2019 & 2032
- Table 8: Global Automated Border Control Industry Volume K Unit Forecast, by Application 2019 & 2032
- Table 9: Global Automated Border Control Industry Revenue Million Forecast, by Region 2019 & 2032
- Table 10: Global Automated Border Control Industry Volume K Unit Forecast, by Region 2019 & 2032
- Table 11: Global Automated Border Control Industry Revenue Million Forecast, by Country 2019 & 2032
- Table 12: Global Automated Border Control Industry Volume K Unit Forecast, by Country 2019 & 2032
- Table 13: United States Automated Border Control Industry Revenue (Million) Forecast, by Application 2019 & 2032
- Table 14: United States Automated Border Control Industry Volume (K Unit) Forecast, by Application 2019 & 2032
- Table 15: Canada Automated Border Control Industry Revenue (Million) Forecast, by Application 2019 & 2032
- Table 16: Canada Automated Border Control Industry Volume (K Unit) Forecast, by Application 2019 & 2032
- Table 17: Mexico Automated Border Control Industry Revenue (Million) Forecast, by Application 2019 & 2032
- Table 18: Mexico Automated Border Control Industry Volume (K Unit) Forecast, by Application 2019 & 2032
- Table 19: Global Automated Border Control Industry Revenue Million Forecast, by Country 2019 & 2032
- Table 20: Global Automated Border Control Industry Volume K Unit Forecast, by Country 2019 & 2032
- Table 21: Germany Automated Border Control Industry Revenue (Million) Forecast, by Application 2019 & 2032
- Table 22: Germany Automated Border Control Industry Volume (K Unit) Forecast, by Application 2019 & 2032
- Table 23: United Kingdom Automated Border Control Industry Revenue (Million) Forecast, by Application 2019 & 2032
- Table 24: United Kingdom Automated Border Control Industry Volume (K Unit) Forecast, by Application 2019 & 2032
- Table 25: France Automated Border Control Industry Revenue (Million) Forecast, by Application 2019 & 2032
- Table 26: France Automated Border Control Industry Volume (K Unit) Forecast, by Application 2019 & 2032
- Table 27: Spain Automated Border Control Industry Revenue (Million) Forecast, by Application 2019 & 2032
- Table 28: Spain Automated Border Control Industry Volume (K Unit) Forecast, by Application 2019 & 2032
- Table 29: Italy Automated Border Control Industry Revenue (Million) Forecast, by Application 2019 & 2032
- Table 30: Italy Automated Border Control Industry Volume (K Unit) Forecast, by Application 2019 & 2032
- Table 31: Spain Automated Border Control Industry Revenue (Million) Forecast, by Application 2019 & 2032
- Table 32: Spain Automated Border Control Industry Volume (K Unit) Forecast, by Application 2019 & 2032
- Table 33: Belgium Automated Border Control Industry Revenue (Million) Forecast, by Application 2019 & 2032
- Table 34: Belgium Automated Border Control Industry Volume (K Unit) Forecast, by Application 2019 & 2032
- Table 35: Netherland Automated Border Control Industry Revenue (Million) Forecast, by Application 2019 & 2032
- Table 36: Netherland Automated Border Control Industry Volume (K Unit) Forecast, by Application 2019 & 2032
- Table 37: Nordics Automated Border Control Industry Revenue (Million) Forecast, by Application 2019 & 2032
- Table 38: Nordics Automated Border Control Industry Volume (K Unit) Forecast, by Application 2019 & 2032
- Table 39: Rest of Europe Automated Border Control Industry Revenue (Million) Forecast, by Application 2019 & 2032
- Table 40: Rest of Europe Automated Border Control Industry Volume (K Unit) Forecast, by Application 2019 & 2032
- Table 41: Global Automated Border Control Industry Revenue Million Forecast, by Country 2019 & 2032
- Table 42: Global Automated Border Control Industry Volume K Unit Forecast, by Country 2019 & 2032
- Table 43: China Automated Border Control Industry Revenue (Million) Forecast, by Application 2019 & 2032
- Table 44: China Automated Border Control Industry Volume (K Unit) Forecast, by Application 2019 & 2032
- Table 45: Japan Automated Border Control Industry Revenue (Million) Forecast, by Application 2019 & 2032
- Table 46: Japan Automated Border Control Industry Volume (K Unit) Forecast, by Application 2019 & 2032
- Table 47: India Automated Border Control Industry Revenue (Million) Forecast, by Application 2019 & 2032
- Table 48: India Automated Border Control Industry Volume (K Unit) Forecast, by Application 2019 & 2032
- Table 49: South Korea Automated Border Control Industry Revenue (Million) Forecast, by Application 2019 & 2032
- Table 50: South Korea Automated Border Control Industry Volume (K Unit) Forecast, by Application 2019 & 2032
- Table 51: Southeast Asia Automated Border Control Industry Revenue (Million) Forecast, by Application 2019 & 2032
- Table 52: Southeast Asia Automated Border Control Industry Volume (K Unit) Forecast, by Application 2019 & 2032
- Table 53: Australia Automated Border Control Industry Revenue (Million) Forecast, by Application 2019 & 2032
- Table 54: Australia Automated Border Control Industry Volume (K Unit) Forecast, by Application 2019 & 2032
- Table 55: Indonesia Automated Border Control Industry Revenue (Million) Forecast, by Application 2019 & 2032
- Table 56: Indonesia Automated Border Control Industry Volume (K Unit) Forecast, by Application 2019 & 2032
- Table 57: Phillipes Automated Border Control Industry Revenue (Million) Forecast, by Application 2019 & 2032
- Table 58: Phillipes Automated Border Control Industry Volume (K Unit) Forecast, by Application 2019 & 2032
- Table 59: Singapore Automated Border Control Industry Revenue (Million) Forecast, by Application 2019 & 2032
- Table 60: Singapore Automated Border Control Industry Volume (K Unit) Forecast, by Application 2019 & 2032
- Table 61: Thailandc Automated Border Control Industry Revenue (Million) Forecast, by Application 2019 & 2032
- Table 62: Thailandc Automated Border Control Industry Volume (K Unit) Forecast, by Application 2019 & 2032
- Table 63: Rest of Asia Pacific Automated Border Control Industry Revenue (Million) Forecast, by Application 2019 & 2032
- Table 64: Rest of Asia Pacific Automated Border Control Industry Volume (K Unit) Forecast, by Application 2019 & 2032
- Table 65: Global Automated Border Control Industry Revenue Million Forecast, by Country 2019 & 2032
- Table 66: Global Automated Border Control Industry Volume K Unit Forecast, by Country 2019 & 2032
- Table 67: Brazil Automated Border Control Industry Revenue (Million) Forecast, by Application 2019 & 2032
- Table 68: Brazil Automated Border Control Industry Volume (K Unit) Forecast, by Application 2019 & 2032
- Table 69: Argentina Automated Border Control Industry Revenue (Million) Forecast, by Application 2019 & 2032
- Table 70: Argentina Automated Border Control Industry Volume (K Unit) Forecast, by Application 2019 & 2032
- Table 71: Peru Automated Border Control Industry Revenue (Million) Forecast, by Application 2019 & 2032
- Table 72: Peru Automated Border Control Industry Volume (K Unit) Forecast, by Application 2019 & 2032
- Table 73: Chile Automated Border Control Industry Revenue (Million) Forecast, by Application 2019 & 2032
- Table 74: Chile Automated Border Control Industry Volume (K Unit) Forecast, by Application 2019 & 2032
- Table 75: Colombia Automated Border Control Industry Revenue (Million) Forecast, by Application 2019 & 2032
- Table 76: Colombia Automated Border Control Industry Volume (K Unit) Forecast, by Application 2019 & 2032
- Table 77: Ecuador Automated Border Control Industry Revenue (Million) Forecast, by Application 2019 & 2032
- Table 78: Ecuador Automated Border Control Industry Volume (K Unit) Forecast, by Application 2019 & 2032
- Table 79: Venezuela Automated Border Control Industry Revenue (Million) Forecast, by Application 2019 & 2032
- Table 80: Venezuela Automated Border Control Industry Volume (K Unit) Forecast, by Application 2019 & 2032
- Table 81: Rest of South America Automated Border Control Industry Revenue (Million) Forecast, by Application 2019 & 2032
- Table 82: Rest of South America Automated Border Control Industry Volume (K Unit) Forecast, by Application 2019 & 2032
- Table 83: Global Automated Border Control Industry Revenue Million Forecast, by Country 2019 & 2032
- Table 84: Global Automated Border Control Industry Volume K Unit Forecast, by Country 2019 & 2032
- Table 85: United States Automated Border Control Industry Revenue (Million) Forecast, by Application 2019 & 2032
- Table 86: United States Automated Border Control Industry Volume (K Unit) Forecast, by Application 2019 & 2032
- Table 87: Canada Automated Border Control Industry Revenue (Million) Forecast, by Application 2019 & 2032
- Table 88: Canada Automated Border Control Industry Volume (K Unit) Forecast, by Application 2019 & 2032
- Table 89: Mexico Automated Border Control Industry Revenue (Million) Forecast, by Application 2019 & 2032
- Table 90: Mexico Automated Border Control Industry Volume (K Unit) Forecast, by Application 2019 & 2032
- Table 91: Global Automated Border Control Industry Revenue Million Forecast, by Country 2019 & 2032
- Table 92: Global Automated Border Control Industry Volume K Unit Forecast, by Country 2019 & 2032
- Table 93: United Arab Emirates Automated Border Control Industry Revenue (Million) Forecast, by Application 2019 & 2032
- Table 94: United Arab Emirates Automated Border Control Industry Volume (K Unit) Forecast, by Application 2019 & 2032
- Table 95: Saudi Arabia Automated Border Control Industry Revenue (Million) Forecast, by Application 2019 & 2032
- Table 96: Saudi Arabia Automated Border Control Industry Volume (K Unit) Forecast, by Application 2019 & 2032
- Table 97: South Africa Automated Border Control Industry Revenue (Million) Forecast, by Application 2019 & 2032
- Table 98: South Africa Automated Border Control Industry Volume (K Unit) Forecast, by Application 2019 & 2032
- Table 99: Rest of Middle East and Africa Automated Border Control Industry Revenue (Million) Forecast, by Application 2019 & 2032
- Table 100: Rest of Middle East and Africa Automated Border Control Industry Volume (K Unit) Forecast, by Application 2019 & 2032
- Table 101: Global Automated Border Control Industry Revenue Million Forecast, by Type 2019 & 2032
- Table 102: Global Automated Border Control Industry Volume K Unit Forecast, by Type 2019 & 2032
- Table 103: Global Automated Border Control Industry Revenue Million Forecast, by Offerings 2019 & 2032
- Table 104: Global Automated Border Control Industry Volume K Unit Forecast, by Offerings 2019 & 2032
- Table 105: Global Automated Border Control Industry Revenue Million Forecast, by Application 2019 & 2032
- Table 106: Global Automated Border Control Industry Volume K Unit Forecast, by Application 2019 & 2032
- Table 107: Global Automated Border Control Industry Revenue Million Forecast, by Country 2019 & 2032
- Table 108: Global Automated Border Control Industry Volume K Unit Forecast, by Country 2019 & 2032
- Table 109: Global Automated Border Control Industry Revenue Million Forecast, by Type 2019 & 2032
- Table 110: Global Automated Border Control Industry Volume K Unit Forecast, by Type 2019 & 2032
- Table 111: Global Automated Border Control Industry Revenue Million Forecast, by Offerings 2019 & 2032
- Table 112: Global Automated Border Control Industry Volume K Unit Forecast, by Offerings 2019 & 2032
- Table 113: Global Automated Border Control Industry Revenue Million Forecast, by Application 2019 & 2032
- Table 114: Global Automated Border Control Industry Volume K Unit Forecast, by Application 2019 & 2032
- Table 115: Global Automated Border Control Industry Revenue Million Forecast, by Country 2019 & 2032
- Table 116: Global Automated Border Control Industry Volume K Unit Forecast, by Country 2019 & 2032
- Table 117: Global Automated Border Control Industry Revenue Million Forecast, by Type 2019 & 2032
- Table 118: Global Automated Border Control Industry Volume K Unit Forecast, by Type 2019 & 2032
- Table 119: Global Automated Border Control Industry Revenue Million Forecast, by Offerings 2019 & 2032
- Table 120: Global Automated Border Control Industry Volume K Unit Forecast, by Offerings 2019 & 2032
- Table 121: Global Automated Border Control Industry Revenue Million Forecast, by Application 2019 & 2032
- Table 122: Global Automated Border Control Industry Volume K Unit Forecast, by Application 2019 & 2032
- Table 123: Global Automated Border Control Industry Revenue Million Forecast, by Country 2019 & 2032
- Table 124: Global Automated Border Control Industry Volume K Unit Forecast, by Country 2019 & 2032
- Table 125: Global Automated Border Control Industry Revenue Million Forecast, by Type 2019 & 2032
- Table 126: Global Automated Border Control Industry Volume K Unit Forecast, by Type 2019 & 2032
- Table 127: Global Automated Border Control Industry Revenue Million Forecast, by Offerings 2019 & 2032
- Table 128: Global Automated Border Control Industry Volume K Unit Forecast, by Offerings 2019 & 2032
- Table 129: Global Automated Border Control Industry Revenue Million Forecast, by Application 2019 & 2032
- Table 130: Global Automated Border Control Industry Volume K Unit Forecast, by Application 2019 & 2032
- Table 131: Global Automated Border Control Industry Revenue Million Forecast, by Country 2019 & 2032
- Table 132: Global Automated Border Control Industry Volume K Unit Forecast, by Country 2019 & 2032
Frequently Asked Questions
1. What is the projected Compound Annual Growth Rate (CAGR) of the Automated Border Control Industry?
The projected CAGR is approximately 16.20%.
2. Which companies are prominent players in the Automated Border Control Industry?
Key companies in the market include Accenture PLC, Cognitec Systems GmbH, Cominfosec Inc, Thales Group, Veridos GmbH, HID Global Corporation, Atos SE, Rockwell Collins Aerospace and Electronics Inc , NEC Technologies India Pvt Ltd, Gunnebo Group Corporation, Magnetic Autocontrol GmbH.
3. What are the main segments of the Automated Border Control Industry?
The market segments include Type, Offerings, Application.
4. Can you provide details about the market size?
The market size is estimated to be USD 2.03 Million as of 2022.
5. What are some drivers contributing to market growth?
Growing Need of API Monitoring in the Digital Economy; The Increasing Use of Test Automation Leads to Lower the Operational Costs and Enhance the QA.
6. What are the notable trends driving market growth?
Airport Applications are Expected to Witness a Rapid Growth.
7. Are there any restraints impacting market growth?
High Initial Setup Cost; Large Installation Space.
8. Can you provide examples of recent developments in the market?
July 2022: The Home Secretary of the U.K. announced intentions to begin the introduction of security "contactless" border checkpoints as a portion of a broad declaration on the development of the U.K. Boundary. The Home Office is to commence testing technology that will allow certain travelers to access the U.K. and go through automatic border inspection without having to undertake an eGate or talk with a Border Force official. The Home Office intends to launch a pilot study in 2024.
9. What pricing options are available for accessing the report?
Pricing options include single-user, multi-user, and enterprise licenses priced at USD 4750, USD 5250, and USD 8750 respectively.
10. Is the market size provided in terms of value or volume?
The market size is provided in terms of value, measured in Million and volume, measured in K Unit.
11. Are there any specific market keywords associated with the report?
Yes, the market keyword associated with the report is "Automated Border Control Industry," which aids in identifying and referencing the specific market segment covered.
12. How do I determine which pricing option suits my needs best?
The pricing options vary based on user requirements and access needs. Individual users may opt for single-user licenses, while businesses requiring broader access may choose multi-user or enterprise licenses for cost-effective access to the report.
13. Are there any additional resources or data provided in the Automated Border Control Industry report?
While the report offers comprehensive insights, it's advisable to review the specific contents or supplementary materials provided to ascertain if additional resources or data are available.
14. How can I stay updated on further developments or reports in the Automated Border Control Industry?
To stay informed about further developments, trends, and reports in the Automated Border Control Industry, consider subscribing to industry newsletters, following relevant companies and organizations, or regularly checking reputable industry news sources and publications.
Methodology
Step 1 - Identification of Relevant Samples Size from Population Database


Step 2 - Approaches for Defining Global Market Size (Value, Volume* & Price*)

Note*: In applicable scenarios
Step 3 - Data Sources
Primary Research
- Web Analytics
- Survey Reports
- Research Institute
- Latest Research Reports
- Opinion Leaders
Secondary Research
- Annual Reports
- White Paper
- Latest Press Release
- Industry Association
- Paid Database
- Investor Presentations

Step 4 - Data Triangulation
Involves using different sources of information in order to increase the validity of a study
These sources are likely to be stakeholders in a program - participants, other researchers, program staff, other community members, and so on.
Then we put all data in single framework & apply various statistical tools to find out the dynamic on the market.
During the analysis stage, feedback from the stakeholder groups would be compared to determine areas of agreement as well as areas of divergence
