

Key Insights
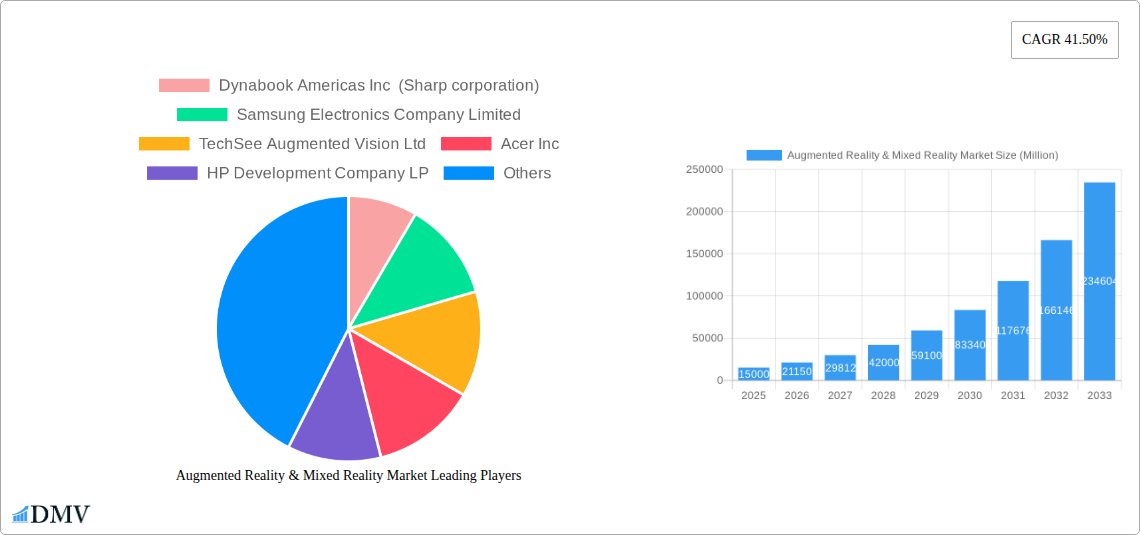
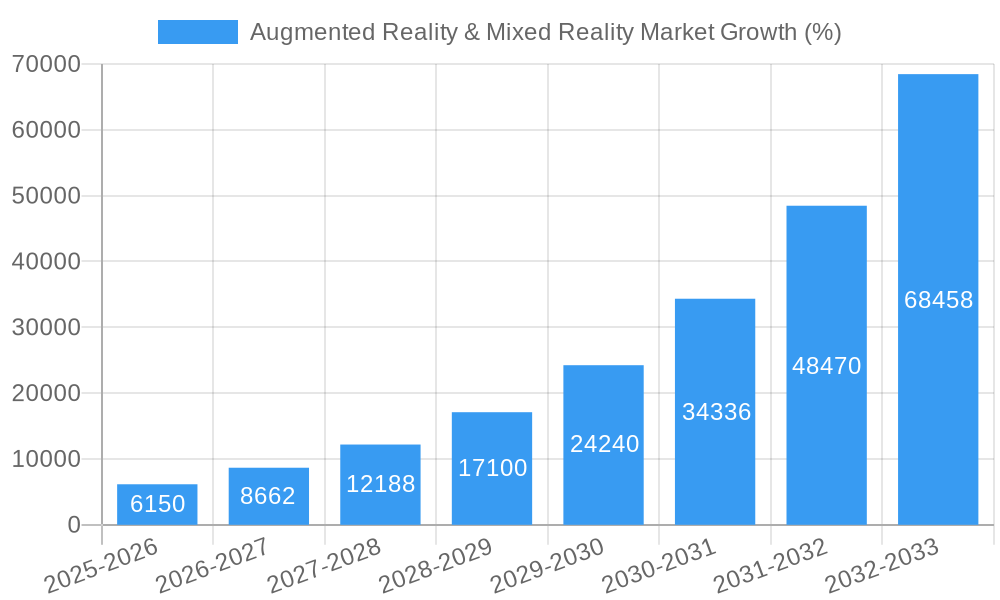
The Augmented Reality (AR) and Mixed Reality (MR) market is experiencing explosive growth, projected to reach a substantial size by 2033. A CAGR of 41.50% indicates a rapidly expanding market driven by several key factors. The increasing adoption of smartphones with advanced processing capabilities and camera technologies forms a strong foundation for AR/MR applications. Furthermore, the burgeoning gaming industry's integration of AR/MR technologies, alongside the development of immersive and interactive experiences for entertainment and education, significantly fuels market expansion. Advancements in hardware, such as lighter and more powerful headsets and improved tracking systems, are making AR/MR solutions more accessible and user-friendly. The medical and healthcare sector is also a significant driver, with AR/MR applications finding use in surgical planning, remote diagnostics, and patient education, boosting market demand. Finally, the industrial sector's adoption of AR/MR for maintenance, training, and design processes contributes substantially to market growth.
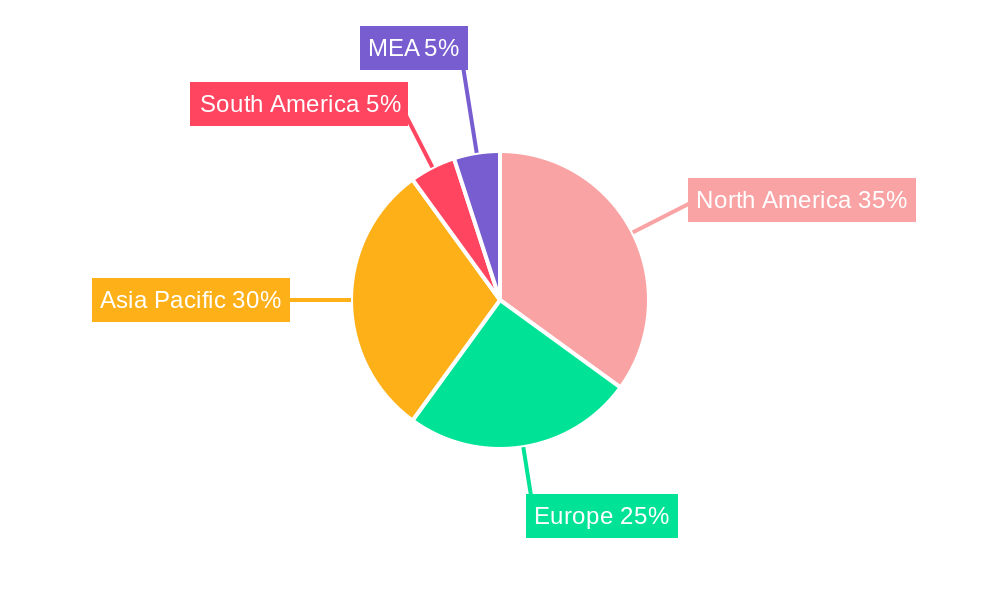
However, despite its rapid expansion, the AR/MR market faces challenges. High initial investment costs for hardware and software can be a barrier to entry for some businesses and consumers. Concerns regarding data privacy and security related to the collection and use of user data also pose a significant restraint. Furthermore, the technological complexity of developing and deploying robust AR/MR applications requires skilled professionals, creating a potential talent shortage. To overcome these challenges, ongoing innovation focusing on cost reduction, enhanced user privacy, and simplified development tools will be crucial. The market segmentation, across consumer, medical and healthcare, industrial and other end-user verticals, presents diverse growth opportunities. Geographic expansion is also expected, with North America and Asia Pacific anticipated as leading regions. The competitive landscape, comprising major technology companies and innovative start-ups, fosters innovation and drives the market forward. Strategic partnerships and collaborations between hardware and software developers will be vital for further market penetration and success.
Augmented Reality & Mixed Reality Market: A Comprehensive Market Report (2019-2033)
This insightful report provides a detailed analysis of the Augmented Reality (AR) & Mixed Reality (MR) market, offering a comprehensive overview of its current state, future trajectory, and key players. With a study period spanning 2019-2033, a base year of 2025, and a forecast period of 2025-2033, this report is an indispensable resource for stakeholders seeking to understand and capitalize on this rapidly evolving market. The market is estimated to reach xx Million by 2025.
Augmented Reality & Mixed Reality Market Market Composition & Trends
This section delves into the competitive landscape of the AR/MR market, examining market concentration, innovation drivers, regulatory frameworks, substitute technologies, end-user profiles, and mergers & acquisitions (M&A) activity. The report analyzes market share distribution among key players, highlighting the competitive dynamics and strategic partnerships shaping the industry. Detailed analysis of M&A activity includes deal values and their impact on market consolidation.
- Market Concentration: The AR/MR market exhibits a moderately concentrated structure, with a few major players holding significant market share. However, the presence of numerous smaller, innovative companies indicates a dynamic and competitive environment.
- Innovation Catalysts: Advancements in display technologies (like microLEDs as seen in the recent Micledi and Kura Technologies collaboration), improved processing power, and sophisticated software are key innovation drivers.
- Regulatory Landscape: Government regulations regarding data privacy, safety standards, and intellectual property rights significantly influence market growth. Regional variations in these regulations create complexities for global players.
- Substitute Products: While AR/MR technologies are unique, competing technologies like Virtual Reality (VR) and enhanced mobile experiences could indirectly influence adoption rates.
- End-User Profiles: The report provides a detailed segmentation of end-users across consumer, medical & healthcare, industrial, and other verticals (education, military, and defense), analyzing their specific needs and adoption patterns.
- M&A Activities: The report identifies significant M&A activities within the industry, analyzing their strategic implications, including the Vuzix Corporation and Atomistic SAS agreement (May 2022), and quantifying their impact on market share and valuations. Total M&A deal value for the historical period (2019-2024) is estimated at xx Million.
Augmented Reality & Mixed Reality Market Industry Evolution
This section traces the evolution of the AR/MR market, analyzing growth trajectories, technological advancements, and evolving consumer demands. It uses historical data (2019-2024) and projected data (2025-2033) to illustrate the market's growth rate and adoption trends across various segments. Key aspects analyzed include:
- Market Growth Trajectories: The report projects a Compound Annual Growth Rate (CAGR) of xx% during the forecast period (2025-2033), driven by factors discussed later in the report.
- Technological Advancements: The section details advancements in areas such as display technologies (microLEDs, OLEDs), processing power, sensor technology, and software development kits (SDKs). These advancements significantly enhance user experiences and expand the range of AR/MR applications.
- Shifting Consumer Demands: This report examines the changing expectations of consumers regarding AR/MR devices, focusing on factors such as performance, cost, ease of use, and application diversity.
Leading Regions, Countries, or Segments in Augmented Reality & Mixed Reality Market
This section identifies the dominant regions, countries, and end-user segments within the AR/MR market.
- Dominant Region: North America is currently a leading region, driven by high technological advancements, robust consumer adoption, and substantial investments in AR/MR technologies.
- Dominant End-User Vertical: The Industrial sector showcases strong growth potential due to its applications in manufacturing, maintenance, and training. The healthcare sector also shows significant traction, with AR/MR technologies aiding in surgery, diagnostics, and patient care.
Key Drivers for Dominance:
- High Investment: Significant investments from venture capitalists and large technology companies fuel innovation and market expansion in North America.
- Strong Regulatory Support: Favorable regulatory environments facilitate the adoption and deployment of AR/MR technologies in various sectors.
- Technological Leadership: North America houses many leading technology companies developing cutting-edge AR/MR hardware and software.
In-depth Analysis of Dominance Factors: The advanced technological infrastructure of North America contributes heavily to its dominance. Further, significant government and private sector investments in R&D boost innovation, ensuring a steady stream of advanced products and applications. The presence of major technology players also creates a positive feedback loop, attracting further investment and talent. Within end-user segments, the industrial sector's demand for enhanced efficiency and safety drives the adoption of AR/MR solutions, leading to its significant market share. Similarly, the potential of AR/MR in the healthcare sector for improved patient care and surgical precision fuels its growth.
Augmented Reality & Mixed Reality Market Product Innovations
Recent years have witnessed remarkable innovation in AR/MR products, leading to enhanced performance, increased functionality, and wider accessibility. The emergence of lighter, more compact devices with improved processing capabilities and longer battery life has expanded their user base. Innovations in display technology, such as the adoption of microLEDs, promise brighter, higher-resolution images and improved power efficiency. Moreover, advancements in computer vision and AI enhance the accuracy and responsiveness of AR/MR applications. These improvements enable broader applications in industries such as manufacturing, healthcare, and education. Unique selling propositions now include features like hand-tracking, eye-tracking, and advanced haptic feedback, substantially enriching the user experience.
Propelling Factors for Augmented Reality & Mixed Reality Market Growth
The AR/MR market's rapid expansion is driven by several converging factors. Technological advancements, particularly in display technologies (microLEDs) and processing power, are creating more powerful and affordable devices. Increasing consumer demand for immersive experiences across entertainment, gaming, and social interaction fuels adoption. Government initiatives and investments in R&D are further stimulating market growth. Finally, the growing number of applications across diverse industries, from healthcare to manufacturing, strengthens the market's long-term potential.
Obstacles in the Augmented Reality & Mixed Reality Market Market
Despite its immense potential, the AR/MR market faces various challenges. High device costs remain a significant barrier to wider consumer adoption. The complexity of the technology and the need for skilled developers can hinder market expansion. Supply chain disruptions, particularly for specialized components like microdisplays, can lead to production delays and price volatility. Finally, intense competition among established technology companies and innovative startups creates pricing pressures and makes market entry difficult for new players.
Future Opportunities in Augmented Reality & Mixed Reality Market
The future of the AR/MR market is brimming with potential. New markets are continually emerging, particularly in sectors like education and smart city initiatives. Technological advancements, such as the integration of 5G and improved AI capabilities, will further propel adoption. Emerging trends like the metaverse and the increasing demand for remote collaboration will create significant opportunities for AR/MR solutions. New applications in areas like augmented commerce and remote assistance are poised for rapid growth.
Major Players in the Augmented Reality & Mixed Reality Market Ecosystem
- Dynabook Americas Inc (Sharp corporation)
- Samsung Electronics Company Limited
- TechSee Augmented Vision Ltd
- Acer Inc
- HP Development Company LP
- Magic Leap Inc
- Amber Garage (Holokit)
- Wikitude GMBH
- Google LLC (Alphabet Inc)
- Microsoft Corporation
- Vuzix Corporation
- Ultraleap Limited
- AsusTek Computer Inc
- Seiko Epson Corporation
- PTC Inc
- Niantic Inc
- Dell Technologies Inc
- Occipital Inc
- Realwear Inc
- Atheer Inc
- Optinvent
- Blippar com Ltd
Key Developments in Augmented Reality & Mixed Reality Market Industry
- October 2022: Micledi Microdisplays and Kura Technologies announced a collaboration to manufacture AR glasses incorporating Micledi's 300mm microLED displays, significantly enhancing performance for next-generation AR glasses. This collaboration signals a major advancement in display technology and its impact on the AR/MR market.
- May 2022: Vuzix Corporation's agreement with Atomistic SAS for custom backplane design and mLED technology licensing demonstrates a strategic move towards advanced micro-LED display integration in AR glasses. This collaboration could significantly impact the performance and cost-effectiveness of future AR devices.
Strategic Augmented Reality & Mixed Reality Market Market Forecast
The AR/MR market is poised for substantial growth, driven by several factors. Continuous technological advancements will lead to improved device performance and affordability, thereby increasing consumer adoption. The expanding range of applications across diverse industries and the emergence of new markets, along with continued investment in R&D, will further propel market expansion. The convergence of AR/MR with other technologies, such as 5G and AI, will unlock new possibilities and fuel significant future growth. The market is expected to experience a sustained period of high growth, driven by strong demand and continuous innovation.
Augmented Reality & Mixed Reality Market Segmentation
-
1. Type
- 1.1. Hardware
- 1.2. Software
-
2. End-user Vertical
- 2.1. Gaming
- 2.2. Education
- 2.3. Healthcare
- 2.4. Retail and Advertising
- 2.5. Automotive
- 2.6. Military and Defense
- 2.7. Other End-user Verticals
-
3. End-user Vertical
- 3.1. Consumer
- 3.2. Medical and Healthcare
- 3.3. Industrial
- 3.4. Other End-user
Augmented Reality & Mixed Reality Market Segmentation By Geography
- 1. North America
- 2. Europe
- 3. Asia Pacific
- 4. Rest of the World
- 5. North America
- 6. Europe
- 7. Asia Pacific
- 8. Rest of the World
Augmented Reality & Mixed Reality Market REPORT HIGHLIGHTS
| Aspects | Details |
|---|---|
| Study Period | 2019-2033 |
| Base Year | 2024 |
| Estimated Year | 2025 |
| Forecast Period | 2025-2033 |
| Historical Period | 2019-2024 |
| Growth Rate | CAGR of 41.50% from 2019-2033 |
| Segmentation |
|
Table of Contents
- 1. Introduction
- 1.1. Research Scope
- 1.2. Market Segmentation
- 1.3. Research Methodology
- 1.4. Definitions and Assumptions
- 2. Executive Summary
- 2.1. Introduction
- 3. Market Dynamics
- 3.1. Introduction
- 3.2. Market Drivers
- 3.2.1. Increasing Applications of Augmented Reality; High Demand for Mobile-based Augmented Reality
- 3.3. Market Restrains
- 3.3.1. Security Issues Associated with Mobile Payments
- 3.4. Market Trends
- 3.4.1. Increasing Applications of Augmented Reality Drives the Market Growth
- 4. Market Factor Analysis
- 4.1. Porters Five Forces
- 4.2. Supply/Value Chain
- 4.3. PESTEL analysis
- 4.4. Market Entropy
- 4.5. Patent/Trademark Analysis
- 5. Global Augmented Reality & Mixed Reality Market Analysis, Insights and Forecast, 2019-2031
- 5.1. Market Analysis, Insights and Forecast - by Type
- 5.1.1. Hardware
- 5.1.2. Software
- 5.2. Market Analysis, Insights and Forecast - by End-user Vertical
- 5.2.1. Gaming
- 5.2.2. Education
- 5.2.3. Healthcare
- 5.2.4. Retail and Advertising
- 5.2.5. Automotive
- 5.2.6. Military and Defense
- 5.2.7. Other End-user Verticals
- 5.3. Market Analysis, Insights and Forecast - by End-user Vertical
- 5.3.1. Consumer
- 5.3.2. Medical and Healthcare
- 5.3.3. Industrial
- 5.3.4. Other End-user
- 5.4. Market Analysis, Insights and Forecast - by Region
- 5.4.1. North America
- 5.4.2. Europe
- 5.4.3. Asia Pacific
- 5.4.4. Rest of the World
- 5.4.5. North America
- 5.4.6. Europe
- 5.4.7. Asia Pacific
- 5.4.8. Rest of the World
- 5.1. Market Analysis, Insights and Forecast - by Type
- 6. North America Augmented Reality & Mixed Reality Market Analysis, Insights and Forecast, 2019-2031
- 6.1. Market Analysis, Insights and Forecast - by Type
- 6.1.1. Hardware
- 6.1.2. Software
- 6.2. Market Analysis, Insights and Forecast - by End-user Vertical
- 6.2.1. Gaming
- 6.2.2. Education
- 6.2.3. Healthcare
- 6.2.4. Retail and Advertising
- 6.2.5. Automotive
- 6.2.6. Military and Defense
- 6.2.7. Other End-user Verticals
- 6.3. Market Analysis, Insights and Forecast - by End-user Vertical
- 6.3.1. Consumer
- 6.3.2. Medical and Healthcare
- 6.3.3. Industrial
- 6.3.4. Other End-user
- 6.1. Market Analysis, Insights and Forecast - by Type
- 7. Europe Augmented Reality & Mixed Reality Market Analysis, Insights and Forecast, 2019-2031
- 7.1. Market Analysis, Insights and Forecast - by Type
- 7.1.1. Hardware
- 7.1.2. Software
- 7.2. Market Analysis, Insights and Forecast - by End-user Vertical
- 7.2.1. Gaming
- 7.2.2. Education
- 7.2.3. Healthcare
- 7.2.4. Retail and Advertising
- 7.2.5. Automotive
- 7.2.6. Military and Defense
- 7.2.7. Other End-user Verticals
- 7.3. Market Analysis, Insights and Forecast - by End-user Vertical
- 7.3.1. Consumer
- 7.3.2. Medical and Healthcare
- 7.3.3. Industrial
- 7.3.4. Other End-user
- 7.1. Market Analysis, Insights and Forecast - by Type
- 8. Asia Pacific Augmented Reality & Mixed Reality Market Analysis, Insights and Forecast, 2019-2031
- 8.1. Market Analysis, Insights and Forecast - by Type
- 8.1.1. Hardware
- 8.1.2. Software
- 8.2. Market Analysis, Insights and Forecast - by End-user Vertical
- 8.2.1. Gaming
- 8.2.2. Education
- 8.2.3. Healthcare
- 8.2.4. Retail and Advertising
- 8.2.5. Automotive
- 8.2.6. Military and Defense
- 8.2.7. Other End-user Verticals
- 8.3. Market Analysis, Insights and Forecast - by End-user Vertical
- 8.3.1. Consumer
- 8.3.2. Medical and Healthcare
- 8.3.3. Industrial
- 8.3.4. Other End-user
- 8.1. Market Analysis, Insights and Forecast - by Type
- 9. Rest of the World Augmented Reality & Mixed Reality Market Analysis, Insights and Forecast, 2019-2031
- 9.1. Market Analysis, Insights and Forecast - by Type
- 9.1.1. Hardware
- 9.1.2. Software
- 9.2. Market Analysis, Insights and Forecast - by End-user Vertical
- 9.2.1. Gaming
- 9.2.2. Education
- 9.2.3. Healthcare
- 9.2.4. Retail and Advertising
- 9.2.5. Automotive
- 9.2.6. Military and Defense
- 9.2.7. Other End-user Verticals
- 9.3. Market Analysis, Insights and Forecast - by End-user Vertical
- 9.3.1. Consumer
- 9.3.2. Medical and Healthcare
- 9.3.3. Industrial
- 9.3.4. Other End-user
- 9.1. Market Analysis, Insights and Forecast - by Type
- 10. North America Augmented Reality & Mixed Reality Market Analysis, Insights and Forecast, 2019-2031
- 10.1. Market Analysis, Insights and Forecast - by Type
- 10.1.1. Hardware
- 10.1.2. Software
- 10.2. Market Analysis, Insights and Forecast - by End-user Vertical
- 10.2.1. Gaming
- 10.2.2. Education
- 10.2.3. Healthcare
- 10.2.4. Retail and Advertising
- 10.2.5. Automotive
- 10.2.6. Military and Defense
- 10.2.7. Other End-user Verticals
- 10.3. Market Analysis, Insights and Forecast - by End-user Vertical
- 10.3.1. Consumer
- 10.3.2. Medical and Healthcare
- 10.3.3. Industrial
- 10.3.4. Other End-user
- 10.1. Market Analysis, Insights and Forecast - by Type
- 11. Europe Augmented Reality & Mixed Reality Market Analysis, Insights and Forecast, 2019-2031
- 11.1. Market Analysis, Insights and Forecast - by Type
- 11.1.1. Hardware
- 11.1.2. Software
- 11.2. Market Analysis, Insights and Forecast - by End-user Vertical
- 11.2.1. Gaming
- 11.2.2. Education
- 11.2.3. Healthcare
- 11.2.4. Retail and Advertising
- 11.2.5. Automotive
- 11.2.6. Military and Defense
- 11.2.7. Other End-user Verticals
- 11.3. Market Analysis, Insights and Forecast - by End-user Vertical
- 11.3.1. Consumer
- 11.3.2. Medical and Healthcare
- 11.3.3. Industrial
- 11.3.4. Other End-user
- 11.1. Market Analysis, Insights and Forecast - by Type
- 12. Asia Pacific Augmented Reality & Mixed Reality Market Analysis, Insights and Forecast, 2019-2031
- 12.1. Market Analysis, Insights and Forecast - by Type
- 12.1.1. Hardware
- 12.1.2. Software
- 12.2. Market Analysis, Insights and Forecast - by End-user Vertical
- 12.2.1. Gaming
- 12.2.2. Education
- 12.2.3. Healthcare
- 12.2.4. Retail and Advertising
- 12.2.5. Automotive
- 12.2.6. Military and Defense
- 12.2.7. Other End-user Verticals
- 12.3. Market Analysis, Insights and Forecast - by End-user Vertical
- 12.3.1. Consumer
- 12.3.2. Medical and Healthcare
- 12.3.3. Industrial
- 12.3.4. Other End-user
- 12.1. Market Analysis, Insights and Forecast - by Type
- 13. Rest of the World Augmented Reality & Mixed Reality Market Analysis, Insights and Forecast, 2019-2031
- 13.1. Market Analysis, Insights and Forecast - by Type
- 13.1.1. Hardware
- 13.1.2. Software
- 13.2. Market Analysis, Insights and Forecast - by End-user Vertical
- 13.2.1. Gaming
- 13.2.2. Education
- 13.2.3. Healthcare
- 13.2.4. Retail and Advertising
- 13.2.5. Automotive
- 13.2.6. Military and Defense
- 13.2.7. Other End-user Verticals
- 13.3. Market Analysis, Insights and Forecast - by End-user Vertical
- 13.3.1. Consumer
- 13.3.2. Medical and Healthcare
- 13.3.3. Industrial
- 13.3.4. Other End-user
- 13.1. Market Analysis, Insights and Forecast - by Type
- 14. North America Augmented Reality & Mixed Reality Market Analysis, Insights and Forecast, 2019-2031
- 14.1. Market Analysis, Insights and Forecast - By Country/Sub-region
- 14.1.1 United States
- 14.1.2 Canada
- 14.1.3 Mexico
- 15. Europe Augmented Reality & Mixed Reality Market Analysis, Insights and Forecast, 2019-2031
- 15.1. Market Analysis, Insights and Forecast - By Country/Sub-region
- 15.1.1 Germany
- 15.1.2 United Kingdom
- 15.1.3 France
- 15.1.4 Spain
- 15.1.5 Italy
- 15.1.6 Spain
- 15.1.7 Belgium
- 15.1.8 Netherland
- 15.1.9 Nordics
- 15.1.10 Rest of Europe
- 16. Asia Pacific Augmented Reality & Mixed Reality Market Analysis, Insights and Forecast, 2019-2031
- 16.1. Market Analysis, Insights and Forecast - By Country/Sub-region
- 16.1.1 China
- 16.1.2 Japan
- 16.1.3 India
- 16.1.4 South Korea
- 16.1.5 Southeast Asia
- 16.1.6 Australia
- 16.1.7 Indonesia
- 16.1.8 Phillipes
- 16.1.9 Singapore
- 16.1.10 Thailandc
- 16.1.11 Rest of Asia Pacific
- 17. South America Augmented Reality & Mixed Reality Market Analysis, Insights and Forecast, 2019-2031
- 17.1. Market Analysis, Insights and Forecast - By Country/Sub-region
- 17.1.1 Brazil
- 17.1.2 Argentina
- 17.1.3 Peru
- 17.1.4 Chile
- 17.1.5 Colombia
- 17.1.6 Ecuador
- 17.1.7 Venezuela
- 17.1.8 Rest of South America
- 18. North America Augmented Reality & Mixed Reality Market Analysis, Insights and Forecast, 2019-2031
- 18.1. Market Analysis, Insights and Forecast - By Country/Sub-region
- 18.1.1 United States
- 18.1.2 Canada
- 18.1.3 Mexico
- 19. MEA Augmented Reality & Mixed Reality Market Analysis, Insights and Forecast, 2019-2031
- 19.1. Market Analysis, Insights and Forecast - By Country/Sub-region
- 19.1.1 United Arab Emirates
- 19.1.2 Saudi Arabia
- 19.1.3 South Africa
- 19.1.4 Rest of Middle East and Africa
- 20. Competitive Analysis
- 20.1. Global Market Share Analysis 2024
- 20.2. Company Profiles
- 20.2.1 Dynabook Americas Inc (Sharp corporation)
- 20.2.1.1. Overview
- 20.2.1.2. Products
- 20.2.1.3. SWOT Analysis
- 20.2.1.4. Recent Developments
- 20.2.1.5. Financials (Based on Availability)
- 20.2.2 Samsung Electronics Company Limited
- 20.2.2.1. Overview
- 20.2.2.2. Products
- 20.2.2.3. SWOT Analysis
- 20.2.2.4. Recent Developments
- 20.2.2.5. Financials (Based on Availability)
- 20.2.3 TechSee Augmented Vision Ltd
- 20.2.3.1. Overview
- 20.2.3.2. Products
- 20.2.3.3. SWOT Analysis
- 20.2.3.4. Recent Developments
- 20.2.3.5. Financials (Based on Availability)
- 20.2.4 Acer Inc
- 20.2.4.1. Overview
- 20.2.4.2. Products
- 20.2.4.3. SWOT Analysis
- 20.2.4.4. Recent Developments
- 20.2.4.5. Financials (Based on Availability)
- 20.2.5 HP Development Company LP
- 20.2.5.1. Overview
- 20.2.5.2. Products
- 20.2.5.3. SWOT Analysis
- 20.2.5.4. Recent Developments
- 20.2.5.5. Financials (Based on Availability)
- 20.2.6 Magic Leap Inc
- 20.2.6.1. Overview
- 20.2.6.2. Products
- 20.2.6.3. SWOT Analysis
- 20.2.6.4. Recent Developments
- 20.2.6.5. Financials (Based on Availability)
- 20.2.7 Amber Garage (Holokit)
- 20.2.7.1. Overview
- 20.2.7.2. Products
- 20.2.7.3. SWOT Analysis
- 20.2.7.4. Recent Developments
- 20.2.7.5. Financials (Based on Availability)
- 20.2.8 Wikitude GMBH
- 20.2.8.1. Overview
- 20.2.8.2. Products
- 20.2.8.3. SWOT Analysis
- 20.2.8.4. Recent Developments
- 20.2.8.5. Financials (Based on Availability)
- 20.2.9 Google LLC (Alphabet Inc )
- 20.2.9.1. Overview
- 20.2.9.2. Products
- 20.2.9.3. SWOT Analysis
- 20.2.9.4. Recent Developments
- 20.2.9.5. Financials (Based on Availability)
- 20.2.10 Microsoft Corporation
- 20.2.10.1. Overview
- 20.2.10.2. Products
- 20.2.10.3. SWOT Analysis
- 20.2.10.4. Recent Developments
- 20.2.10.5. Financials (Based on Availability)
- 20.2.11 Vuzix Corporation
- 20.2.11.1. Overview
- 20.2.11.2. Products
- 20.2.11.3. SWOT Analysis
- 20.2.11.4. Recent Developments
- 20.2.11.5. Financials (Based on Availability)
- 20.2.12 Ultraleap Limited
- 20.2.12.1. Overview
- 20.2.12.2. Products
- 20.2.12.3. SWOT Analysis
- 20.2.12.4. Recent Developments
- 20.2.12.5. Financials (Based on Availability)
- 20.2.13 AsusTek Computer Inc
- 20.2.13.1. Overview
- 20.2.13.2. Products
- 20.2.13.3. SWOT Analysis
- 20.2.13.4. Recent Developments
- 20.2.13.5. Financials (Based on Availability)
- 20.2.14 Seiko Epson Corporation
- 20.2.14.1. Overview
- 20.2.14.2. Products
- 20.2.14.3. SWOT Analysis
- 20.2.14.4. Recent Developments
- 20.2.14.5. Financials (Based on Availability)
- 20.2.15 PTC Inc
- 20.2.15.1. Overview
- 20.2.15.2. Products
- 20.2.15.3. SWOT Analysis
- 20.2.15.4. Recent Developments
- 20.2.15.5. Financials (Based on Availability)
- 20.2.16 Niantic Inc
- 20.2.16.1. Overview
- 20.2.16.2. Products
- 20.2.16.3. SWOT Analysis
- 20.2.16.4. Recent Developments
- 20.2.16.5. Financials (Based on Availability)
- 20.2.17 Dell Technologies Inc
- 20.2.17.1. Overview
- 20.2.17.2. Products
- 20.2.17.3. SWOT Analysis
- 20.2.17.4. Recent Developments
- 20.2.17.5. Financials (Based on Availability)
- 20.2.18 Occipital Inc
- 20.2.18.1. Overview
- 20.2.18.2. Products
- 20.2.18.3. SWOT Analysis
- 20.2.18.4. Recent Developments
- 20.2.18.5. Financials (Based on Availability)
- 20.2.19 Realwear Inc
- 20.2.19.1. Overview
- 20.2.19.2. Products
- 20.2.19.3. SWOT Analysis
- 20.2.19.4. Recent Developments
- 20.2.19.5. Financials (Based on Availability)
- 20.2.20 Atheer Inc
- 20.2.20.1. Overview
- 20.2.20.2. Products
- 20.2.20.3. SWOT Analysis
- 20.2.20.4. Recent Developments
- 20.2.20.5. Financials (Based on Availability)
- 20.2.21 Optinvent
- 20.2.21.1. Overview
- 20.2.21.2. Products
- 20.2.21.3. SWOT Analysis
- 20.2.21.4. Recent Developments
- 20.2.21.5. Financials (Based on Availability)
- 20.2.22 Blippar com Ltd
- 20.2.22.1. Overview
- 20.2.22.2. Products
- 20.2.22.3. SWOT Analysis
- 20.2.22.4. Recent Developments
- 20.2.22.5. Financials (Based on Availability)
- 20.2.1 Dynabook Americas Inc (Sharp corporation)
List of Figures
- Figure 1: Global Augmented Reality & Mixed Reality Market Revenue Breakdown (Million, %) by Region 2024 & 2032
- Figure 2: Global Augmented Reality & Mixed Reality Market Volume Breakdown (K Unit, %) by Region 2024 & 2032
- Figure 3: North America Augmented Reality & Mixed Reality Market Revenue (Million), by Country 2024 & 2032
- Figure 4: North America Augmented Reality & Mixed Reality Market Volume (K Unit), by Country 2024 & 2032
- Figure 5: North America Augmented Reality & Mixed Reality Market Revenue Share (%), by Country 2024 & 2032
- Figure 6: North America Augmented Reality & Mixed Reality Market Volume Share (%), by Country 2024 & 2032
- Figure 7: Europe Augmented Reality & Mixed Reality Market Revenue (Million), by Country 2024 & 2032
- Figure 8: Europe Augmented Reality & Mixed Reality Market Volume (K Unit), by Country 2024 & 2032
- Figure 9: Europe Augmented Reality & Mixed Reality Market Revenue Share (%), by Country 2024 & 2032
- Figure 10: Europe Augmented Reality & Mixed Reality Market Volume Share (%), by Country 2024 & 2032
- Figure 11: Asia Pacific Augmented Reality & Mixed Reality Market Revenue (Million), by Country 2024 & 2032
- Figure 12: Asia Pacific Augmented Reality & Mixed Reality Market Volume (K Unit), by Country 2024 & 2032
- Figure 13: Asia Pacific Augmented Reality & Mixed Reality Market Revenue Share (%), by Country 2024 & 2032
- Figure 14: Asia Pacific Augmented Reality & Mixed Reality Market Volume Share (%), by Country 2024 & 2032
- Figure 15: South America Augmented Reality & Mixed Reality Market Revenue (Million), by Country 2024 & 2032
- Figure 16: South America Augmented Reality & Mixed Reality Market Volume (K Unit), by Country 2024 & 2032
- Figure 17: South America Augmented Reality & Mixed Reality Market Revenue Share (%), by Country 2024 & 2032
- Figure 18: South America Augmented Reality & Mixed Reality Market Volume Share (%), by Country 2024 & 2032
- Figure 19: North America Augmented Reality & Mixed Reality Market Revenue (Million), by Country 2024 & 2032
- Figure 20: North America Augmented Reality & Mixed Reality Market Volume (K Unit), by Country 2024 & 2032
- Figure 21: North America Augmented Reality & Mixed Reality Market Revenue Share (%), by Country 2024 & 2032
- Figure 22: North America Augmented Reality & Mixed Reality Market Volume Share (%), by Country 2024 & 2032
- Figure 23: MEA Augmented Reality & Mixed Reality Market Revenue (Million), by Country 2024 & 2032
- Figure 24: MEA Augmented Reality & Mixed Reality Market Volume (K Unit), by Country 2024 & 2032
- Figure 25: MEA Augmented Reality & Mixed Reality Market Revenue Share (%), by Country 2024 & 2032
- Figure 26: MEA Augmented Reality & Mixed Reality Market Volume Share (%), by Country 2024 & 2032
- Figure 27: North America Augmented Reality & Mixed Reality Market Revenue (Million), by Type 2024 & 2032
- Figure 28: North America Augmented Reality & Mixed Reality Market Volume (K Unit), by Type 2024 & 2032
- Figure 29: North America Augmented Reality & Mixed Reality Market Revenue Share (%), by Type 2024 & 2032
- Figure 30: North America Augmented Reality & Mixed Reality Market Volume Share (%), by Type 2024 & 2032
- Figure 31: North America Augmented Reality & Mixed Reality Market Revenue (Million), by End-user Vertical 2024 & 2032
- Figure 32: North America Augmented Reality & Mixed Reality Market Volume (K Unit), by End-user Vertical 2024 & 2032
- Figure 33: North America Augmented Reality & Mixed Reality Market Revenue Share (%), by End-user Vertical 2024 & 2032
- Figure 34: North America Augmented Reality & Mixed Reality Market Volume Share (%), by End-user Vertical 2024 & 2032
- Figure 35: North America Augmented Reality & Mixed Reality Market Revenue (Million), by End-user Vertical 2024 & 2032
- Figure 36: North America Augmented Reality & Mixed Reality Market Volume (K Unit), by End-user Vertical 2024 & 2032
- Figure 37: North America Augmented Reality & Mixed Reality Market Revenue Share (%), by End-user Vertical 2024 & 2032
- Figure 38: North America Augmented Reality & Mixed Reality Market Volume Share (%), by End-user Vertical 2024 & 2032
- Figure 39: North America Augmented Reality & Mixed Reality Market Revenue (Million), by Country 2024 & 2032
- Figure 40: North America Augmented Reality & Mixed Reality Market Volume (K Unit), by Country 2024 & 2032
- Figure 41: North America Augmented Reality & Mixed Reality Market Revenue Share (%), by Country 2024 & 2032
- Figure 42: North America Augmented Reality & Mixed Reality Market Volume Share (%), by Country 2024 & 2032
- Figure 43: Europe Augmented Reality & Mixed Reality Market Revenue (Million), by Type 2024 & 2032
- Figure 44: Europe Augmented Reality & Mixed Reality Market Volume (K Unit), by Type 2024 & 2032
- Figure 45: Europe Augmented Reality & Mixed Reality Market Revenue Share (%), by Type 2024 & 2032
- Figure 46: Europe Augmented Reality & Mixed Reality Market Volume Share (%), by Type 2024 & 2032
- Figure 47: Europe Augmented Reality & Mixed Reality Market Revenue (Million), by End-user Vertical 2024 & 2032
- Figure 48: Europe Augmented Reality & Mixed Reality Market Volume (K Unit), by End-user Vertical 2024 & 2032
- Figure 49: Europe Augmented Reality & Mixed Reality Market Revenue Share (%), by End-user Vertical 2024 & 2032
- Figure 50: Europe Augmented Reality & Mixed Reality Market Volume Share (%), by End-user Vertical 2024 & 2032
- Figure 51: Europe Augmented Reality & Mixed Reality Market Revenue (Million), by End-user Vertical 2024 & 2032
- Figure 52: Europe Augmented Reality & Mixed Reality Market Volume (K Unit), by End-user Vertical 2024 & 2032
- Figure 53: Europe Augmented Reality & Mixed Reality Market Revenue Share (%), by End-user Vertical 2024 & 2032
- Figure 54: Europe Augmented Reality & Mixed Reality Market Volume Share (%), by End-user Vertical 2024 & 2032
- Figure 55: Europe Augmented Reality & Mixed Reality Market Revenue (Million), by Country 2024 & 2032
- Figure 56: Europe Augmented Reality & Mixed Reality Market Volume (K Unit), by Country 2024 & 2032
- Figure 57: Europe Augmented Reality & Mixed Reality Market Revenue Share (%), by Country 2024 & 2032
- Figure 58: Europe Augmented Reality & Mixed Reality Market Volume Share (%), by Country 2024 & 2032
- Figure 59: Asia Pacific Augmented Reality & Mixed Reality Market Revenue (Million), by Type 2024 & 2032
- Figure 60: Asia Pacific Augmented Reality & Mixed Reality Market Volume (K Unit), by Type 2024 & 2032
- Figure 61: Asia Pacific Augmented Reality & Mixed Reality Market Revenue Share (%), by Type 2024 & 2032
- Figure 62: Asia Pacific Augmented Reality & Mixed Reality Market Volume Share (%), by Type 2024 & 2032
- Figure 63: Asia Pacific Augmented Reality & Mixed Reality Market Revenue (Million), by End-user Vertical 2024 & 2032
- Figure 64: Asia Pacific Augmented Reality & Mixed Reality Market Volume (K Unit), by End-user Vertical 2024 & 2032
- Figure 65: Asia Pacific Augmented Reality & Mixed Reality Market Revenue Share (%), by End-user Vertical 2024 & 2032
- Figure 66: Asia Pacific Augmented Reality & Mixed Reality Market Volume Share (%), by End-user Vertical 2024 & 2032
- Figure 67: Asia Pacific Augmented Reality & Mixed Reality Market Revenue (Million), by End-user Vertical 2024 & 2032
- Figure 68: Asia Pacific Augmented Reality & Mixed Reality Market Volume (K Unit), by End-user Vertical 2024 & 2032
- Figure 69: Asia Pacific Augmented Reality & Mixed Reality Market Revenue Share (%), by End-user Vertical 2024 & 2032
- Figure 70: Asia Pacific Augmented Reality & Mixed Reality Market Volume Share (%), by End-user Vertical 2024 & 2032
- Figure 71: Asia Pacific Augmented Reality & Mixed Reality Market Revenue (Million), by Country 2024 & 2032
- Figure 72: Asia Pacific Augmented Reality & Mixed Reality Market Volume (K Unit), by Country 2024 & 2032
- Figure 73: Asia Pacific Augmented Reality & Mixed Reality Market Revenue Share (%), by Country 2024 & 2032
- Figure 74: Asia Pacific Augmented Reality & Mixed Reality Market Volume Share (%), by Country 2024 & 2032
- Figure 75: Rest of the World Augmented Reality & Mixed Reality Market Revenue (Million), by Type 2024 & 2032
- Figure 76: Rest of the World Augmented Reality & Mixed Reality Market Volume (K Unit), by Type 2024 & 2032
- Figure 77: Rest of the World Augmented Reality & Mixed Reality Market Revenue Share (%), by Type 2024 & 2032
- Figure 78: Rest of the World Augmented Reality & Mixed Reality Market Volume Share (%), by Type 2024 & 2032
- Figure 79: Rest of the World Augmented Reality & Mixed Reality Market Revenue (Million), by End-user Vertical 2024 & 2032
- Figure 80: Rest of the World Augmented Reality & Mixed Reality Market Volume (K Unit), by End-user Vertical 2024 & 2032
- Figure 81: Rest of the World Augmented Reality & Mixed Reality Market Revenue Share (%), by End-user Vertical 2024 & 2032
- Figure 82: Rest of the World Augmented Reality & Mixed Reality Market Volume Share (%), by End-user Vertical 2024 & 2032
- Figure 83: Rest of the World Augmented Reality & Mixed Reality Market Revenue (Million), by End-user Vertical 2024 & 2032
- Figure 84: Rest of the World Augmented Reality & Mixed Reality Market Volume (K Unit), by End-user Vertical 2024 & 2032
- Figure 85: Rest of the World Augmented Reality & Mixed Reality Market Revenue Share (%), by End-user Vertical 2024 & 2032
- Figure 86: Rest of the World Augmented Reality & Mixed Reality Market Volume Share (%), by End-user Vertical 2024 & 2032
- Figure 87: Rest of the World Augmented Reality & Mixed Reality Market Revenue (Million), by Country 2024 & 2032
- Figure 88: Rest of the World Augmented Reality & Mixed Reality Market Volume (K Unit), by Country 2024 & 2032
- Figure 89: Rest of the World Augmented Reality & Mixed Reality Market Revenue Share (%), by Country 2024 & 2032
- Figure 90: Rest of the World Augmented Reality & Mixed Reality Market Volume Share (%), by Country 2024 & 2032
- Figure 91: North America Augmented Reality & Mixed Reality Market Revenue (Million), by Type 2024 & 2032
- Figure 92: North America Augmented Reality & Mixed Reality Market Volume (K Unit), by Type 2024 & 2032
- Figure 93: North America Augmented Reality & Mixed Reality Market Revenue Share (%), by Type 2024 & 2032
- Figure 94: North America Augmented Reality & Mixed Reality Market Volume Share (%), by Type 2024 & 2032
- Figure 95: North America Augmented Reality & Mixed Reality Market Revenue (Million), by End-user Vertical 2024 & 2032
- Figure 96: North America Augmented Reality & Mixed Reality Market Volume (K Unit), by End-user Vertical 2024 & 2032
- Figure 97: North America Augmented Reality & Mixed Reality Market Revenue Share (%), by End-user Vertical 2024 & 2032
- Figure 98: North America Augmented Reality & Mixed Reality Market Volume Share (%), by End-user Vertical 2024 & 2032
- Figure 99: North America Augmented Reality & Mixed Reality Market Revenue (Million), by End-user Vertical 2024 & 2032
- Figure 100: North America Augmented Reality & Mixed Reality Market Volume (K Unit), by End-user Vertical 2024 & 2032
- Figure 101: North America Augmented Reality & Mixed Reality Market Revenue Share (%), by End-user Vertical 2024 & 2032
- Figure 102: North America Augmented Reality & Mixed Reality Market Volume Share (%), by End-user Vertical 2024 & 2032
- Figure 103: North America Augmented Reality & Mixed Reality Market Revenue (Million), by Country 2024 & 2032
- Figure 104: North America Augmented Reality & Mixed Reality Market Volume (K Unit), by Country 2024 & 2032
- Figure 105: North America Augmented Reality & Mixed Reality Market Revenue Share (%), by Country 2024 & 2032
- Figure 106: North America Augmented Reality & Mixed Reality Market Volume Share (%), by Country 2024 & 2032
- Figure 107: Europe Augmented Reality & Mixed Reality Market Revenue (Million), by Type 2024 & 2032
- Figure 108: Europe Augmented Reality & Mixed Reality Market Volume (K Unit), by Type 2024 & 2032
- Figure 109: Europe Augmented Reality & Mixed Reality Market Revenue Share (%), by Type 2024 & 2032
- Figure 110: Europe Augmented Reality & Mixed Reality Market Volume Share (%), by Type 2024 & 2032
- Figure 111: Europe Augmented Reality & Mixed Reality Market Revenue (Million), by End-user Vertical 2024 & 2032
- Figure 112: Europe Augmented Reality & Mixed Reality Market Volume (K Unit), by End-user Vertical 2024 & 2032
- Figure 113: Europe Augmented Reality & Mixed Reality Market Revenue Share (%), by End-user Vertical 2024 & 2032
- Figure 114: Europe Augmented Reality & Mixed Reality Market Volume Share (%), by End-user Vertical 2024 & 2032
- Figure 115: Europe Augmented Reality & Mixed Reality Market Revenue (Million), by End-user Vertical 2024 & 2032
- Figure 116: Europe Augmented Reality & Mixed Reality Market Volume (K Unit), by End-user Vertical 2024 & 2032
- Figure 117: Europe Augmented Reality & Mixed Reality Market Revenue Share (%), by End-user Vertical 2024 & 2032
- Figure 118: Europe Augmented Reality & Mixed Reality Market Volume Share (%), by End-user Vertical 2024 & 2032
- Figure 119: Europe Augmented Reality & Mixed Reality Market Revenue (Million), by Country 2024 & 2032
- Figure 120: Europe Augmented Reality & Mixed Reality Market Volume (K Unit), by Country 2024 & 2032
- Figure 121: Europe Augmented Reality & Mixed Reality Market Revenue Share (%), by Country 2024 & 2032
- Figure 122: Europe Augmented Reality & Mixed Reality Market Volume Share (%), by Country 2024 & 2032
- Figure 123: Asia Pacific Augmented Reality & Mixed Reality Market Revenue (Million), by Type 2024 & 2032
- Figure 124: Asia Pacific Augmented Reality & Mixed Reality Market Volume (K Unit), by Type 2024 & 2032
- Figure 125: Asia Pacific Augmented Reality & Mixed Reality Market Revenue Share (%), by Type 2024 & 2032
- Figure 126: Asia Pacific Augmented Reality & Mixed Reality Market Volume Share (%), by Type 2024 & 2032
- Figure 127: Asia Pacific Augmented Reality & Mixed Reality Market Revenue (Million), by End-user Vertical 2024 & 2032
- Figure 128: Asia Pacific Augmented Reality & Mixed Reality Market Volume (K Unit), by End-user Vertical 2024 & 2032
- Figure 129: Asia Pacific Augmented Reality & Mixed Reality Market Revenue Share (%), by End-user Vertical 2024 & 2032
- Figure 130: Asia Pacific Augmented Reality & Mixed Reality Market Volume Share (%), by End-user Vertical 2024 & 2032
- Figure 131: Asia Pacific Augmented Reality & Mixed Reality Market Revenue (Million), by End-user Vertical 2024 & 2032
- Figure 132: Asia Pacific Augmented Reality & Mixed Reality Market Volume (K Unit), by End-user Vertical 2024 & 2032
- Figure 133: Asia Pacific Augmented Reality & Mixed Reality Market Revenue Share (%), by End-user Vertical 2024 & 2032
- Figure 134: Asia Pacific Augmented Reality & Mixed Reality Market Volume Share (%), by End-user Vertical 2024 & 2032
- Figure 135: Asia Pacific Augmented Reality & Mixed Reality Market Revenue (Million), by Country 2024 & 2032
- Figure 136: Asia Pacific Augmented Reality & Mixed Reality Market Volume (K Unit), by Country 2024 & 2032
- Figure 137: Asia Pacific Augmented Reality & Mixed Reality Market Revenue Share (%), by Country 2024 & 2032
- Figure 138: Asia Pacific Augmented Reality & Mixed Reality Market Volume Share (%), by Country 2024 & 2032
- Figure 139: Rest of the World Augmented Reality & Mixed Reality Market Revenue (Million), by Type 2024 & 2032
- Figure 140: Rest of the World Augmented Reality & Mixed Reality Market Volume (K Unit), by Type 2024 & 2032
- Figure 141: Rest of the World Augmented Reality & Mixed Reality Market Revenue Share (%), by Type 2024 & 2032
- Figure 142: Rest of the World Augmented Reality & Mixed Reality Market Volume Share (%), by Type 2024 & 2032
- Figure 143: Rest of the World Augmented Reality & Mixed Reality Market Revenue (Million), by End-user Vertical 2024 & 2032
- Figure 144: Rest of the World Augmented Reality & Mixed Reality Market Volume (K Unit), by End-user Vertical 2024 & 2032
- Figure 145: Rest of the World Augmented Reality & Mixed Reality Market Revenue Share (%), by End-user Vertical 2024 & 2032
- Figure 146: Rest of the World Augmented Reality & Mixed Reality Market Volume Share (%), by End-user Vertical 2024 & 2032
- Figure 147: Rest of the World Augmented Reality & Mixed Reality Market Revenue (Million), by End-user Vertical 2024 & 2032
- Figure 148: Rest of the World Augmented Reality & Mixed Reality Market Volume (K Unit), by End-user Vertical 2024 & 2032
- Figure 149: Rest of the World Augmented Reality & Mixed Reality Market Revenue Share (%), by End-user Vertical 2024 & 2032
- Figure 150: Rest of the World Augmented Reality & Mixed Reality Market Volume Share (%), by End-user Vertical 2024 & 2032
- Figure 151: Rest of the World Augmented Reality & Mixed Reality Market Revenue (Million), by Country 2024 & 2032
- Figure 152: Rest of the World Augmented Reality & Mixed Reality Market Volume (K Unit), by Country 2024 & 2032
- Figure 153: Rest of the World Augmented Reality & Mixed Reality Market Revenue Share (%), by Country 2024 & 2032
- Figure 154: Rest of the World Augmented Reality & Mixed Reality Market Volume Share (%), by Country 2024 & 2032
List of Tables
- Table 1: Global Augmented Reality & Mixed Reality Market Revenue Million Forecast, by Region 2019 & 2032
- Table 2: Global Augmented Reality & Mixed Reality Market Volume K Unit Forecast, by Region 2019 & 2032
- Table 3: Global Augmented Reality & Mixed Reality Market Revenue Million Forecast, by Type 2019 & 2032
- Table 4: Global Augmented Reality & Mixed Reality Market Volume K Unit Forecast, by Type 2019 & 2032
- Table 5: Global Augmented Reality & Mixed Reality Market Revenue Million Forecast, by End-user Vertical 2019 & 2032
- Table 6: Global Augmented Reality & Mixed Reality Market Volume K Unit Forecast, by End-user Vertical 2019 & 2032
- Table 7: Global Augmented Reality & Mixed Reality Market Revenue Million Forecast, by End-user Vertical 2019 & 2032
- Table 8: Global Augmented Reality & Mixed Reality Market Volume K Unit Forecast, by End-user Vertical 2019 & 2032
- Table 9: Global Augmented Reality & Mixed Reality Market Revenue Million Forecast, by Region 2019 & 2032
- Table 10: Global Augmented Reality & Mixed Reality Market Volume K Unit Forecast, by Region 2019 & 2032
- Table 11: Global Augmented Reality & Mixed Reality Market Revenue Million Forecast, by Country 2019 & 2032
- Table 12: Global Augmented Reality & Mixed Reality Market Volume K Unit Forecast, by Country 2019 & 2032
- Table 13: United States Augmented Reality & Mixed Reality Market Revenue (Million) Forecast, by Application 2019 & 2032
- Table 14: United States Augmented Reality & Mixed Reality Market Volume (K Unit) Forecast, by Application 2019 & 2032
- Table 15: Canada Augmented Reality & Mixed Reality Market Revenue (Million) Forecast, by Application 2019 & 2032
- Table 16: Canada Augmented Reality & Mixed Reality Market Volume (K Unit) Forecast, by Application 2019 & 2032
- Table 17: Mexico Augmented Reality & Mixed Reality Market Revenue (Million) Forecast, by Application 2019 & 2032
- Table 18: Mexico Augmented Reality & Mixed Reality Market Volume (K Unit) Forecast, by Application 2019 & 2032
- Table 19: Global Augmented Reality & Mixed Reality Market Revenue Million Forecast, by Country 2019 & 2032
- Table 20: Global Augmented Reality & Mixed Reality Market Volume K Unit Forecast, by Country 2019 & 2032
- Table 21: Germany Augmented Reality & Mixed Reality Market Revenue (Million) Forecast, by Application 2019 & 2032
- Table 22: Germany Augmented Reality & Mixed Reality Market Volume (K Unit) Forecast, by Application 2019 & 2032
- Table 23: United Kingdom Augmented Reality & Mixed Reality Market Revenue (Million) Forecast, by Application 2019 & 2032
- Table 24: United Kingdom Augmented Reality & Mixed Reality Market Volume (K Unit) Forecast, by Application 2019 & 2032
- Table 25: France Augmented Reality & Mixed Reality Market Revenue (Million) Forecast, by Application 2019 & 2032
- Table 26: France Augmented Reality & Mixed Reality Market Volume (K Unit) Forecast, by Application 2019 & 2032
- Table 27: Spain Augmented Reality & Mixed Reality Market Revenue (Million) Forecast, by Application 2019 & 2032
- Table 28: Spain Augmented Reality & Mixed Reality Market Volume (K Unit) Forecast, by Application 2019 & 2032
- Table 29: Italy Augmented Reality & Mixed Reality Market Revenue (Million) Forecast, by Application 2019 & 2032
- Table 30: Italy Augmented Reality & Mixed Reality Market Volume (K Unit) Forecast, by Application 2019 & 2032
- Table 31: Spain Augmented Reality & Mixed Reality Market Revenue (Million) Forecast, by Application 2019 & 2032
- Table 32: Spain Augmented Reality & Mixed Reality Market Volume (K Unit) Forecast, by Application 2019 & 2032
- Table 33: Belgium Augmented Reality & Mixed Reality Market Revenue (Million) Forecast, by Application 2019 & 2032
- Table 34: Belgium Augmented Reality & Mixed Reality Market Volume (K Unit) Forecast, by Application 2019 & 2032
- Table 35: Netherland Augmented Reality & Mixed Reality Market Revenue (Million) Forecast, by Application 2019 & 2032
- Table 36: Netherland Augmented Reality & Mixed Reality Market Volume (K Unit) Forecast, by Application 2019 & 2032
- Table 37: Nordics Augmented Reality & Mixed Reality Market Revenue (Million) Forecast, by Application 2019 & 2032
- Table 38: Nordics Augmented Reality & Mixed Reality Market Volume (K Unit) Forecast, by Application 2019 & 2032
- Table 39: Rest of Europe Augmented Reality & Mixed Reality Market Revenue (Million) Forecast, by Application 2019 & 2032
- Table 40: Rest of Europe Augmented Reality & Mixed Reality Market Volume (K Unit) Forecast, by Application 2019 & 2032
- Table 41: Global Augmented Reality & Mixed Reality Market Revenue Million Forecast, by Country 2019 & 2032
- Table 42: Global Augmented Reality & Mixed Reality Market Volume K Unit Forecast, by Country 2019 & 2032
- Table 43: China Augmented Reality & Mixed Reality Market Revenue (Million) Forecast, by Application 2019 & 2032
- Table 44: China Augmented Reality & Mixed Reality Market Volume (K Unit) Forecast, by Application 2019 & 2032
- Table 45: Japan Augmented Reality & Mixed Reality Market Revenue (Million) Forecast, by Application 2019 & 2032
- Table 46: Japan Augmented Reality & Mixed Reality Market Volume (K Unit) Forecast, by Application 2019 & 2032
- Table 47: India Augmented Reality & Mixed Reality Market Revenue (Million) Forecast, by Application 2019 & 2032
- Table 48: India Augmented Reality & Mixed Reality Market Volume (K Unit) Forecast, by Application 2019 & 2032
- Table 49: South Korea Augmented Reality & Mixed Reality Market Revenue (Million) Forecast, by Application 2019 & 2032
- Table 50: South Korea Augmented Reality & Mixed Reality Market Volume (K Unit) Forecast, by Application 2019 & 2032
- Table 51: Southeast Asia Augmented Reality & Mixed Reality Market Revenue (Million) Forecast, by Application 2019 & 2032
- Table 52: Southeast Asia Augmented Reality & Mixed Reality Market Volume (K Unit) Forecast, by Application 2019 & 2032
- Table 53: Australia Augmented Reality & Mixed Reality Market Revenue (Million) Forecast, by Application 2019 & 2032
- Table 54: Australia Augmented Reality & Mixed Reality Market Volume (K Unit) Forecast, by Application 2019 & 2032
- Table 55: Indonesia Augmented Reality & Mixed Reality Market Revenue (Million) Forecast, by Application 2019 & 2032
- Table 56: Indonesia Augmented Reality & Mixed Reality Market Volume (K Unit) Forecast, by Application 2019 & 2032
- Table 57: Phillipes Augmented Reality & Mixed Reality Market Revenue (Million) Forecast, by Application 2019 & 2032
- Table 58: Phillipes Augmented Reality & Mixed Reality Market Volume (K Unit) Forecast, by Application 2019 & 2032
- Table 59: Singapore Augmented Reality & Mixed Reality Market Revenue (Million) Forecast, by Application 2019 & 2032
- Table 60: Singapore Augmented Reality & Mixed Reality Market Volume (K Unit) Forecast, by Application 2019 & 2032
- Table 61: Thailandc Augmented Reality & Mixed Reality Market Revenue (Million) Forecast, by Application 2019 & 2032
- Table 62: Thailandc Augmented Reality & Mixed Reality Market Volume (K Unit) Forecast, by Application 2019 & 2032
- Table 63: Rest of Asia Pacific Augmented Reality & Mixed Reality Market Revenue (Million) Forecast, by Application 2019 & 2032
- Table 64: Rest of Asia Pacific Augmented Reality & Mixed Reality Market Volume (K Unit) Forecast, by Application 2019 & 2032
- Table 65: Global Augmented Reality & Mixed Reality Market Revenue Million Forecast, by Country 2019 & 2032
- Table 66: Global Augmented Reality & Mixed Reality Market Volume K Unit Forecast, by Country 2019 & 2032
- Table 67: Brazil Augmented Reality & Mixed Reality Market Revenue (Million) Forecast, by Application 2019 & 2032
- Table 68: Brazil Augmented Reality & Mixed Reality Market Volume (K Unit) Forecast, by Application 2019 & 2032
- Table 69: Argentina Augmented Reality & Mixed Reality Market Revenue (Million) Forecast, by Application 2019 & 2032
- Table 70: Argentina Augmented Reality & Mixed Reality Market Volume (K Unit) Forecast, by Application 2019 & 2032
- Table 71: Peru Augmented Reality & Mixed Reality Market Revenue (Million) Forecast, by Application 2019 & 2032
- Table 72: Peru Augmented Reality & Mixed Reality Market Volume (K Unit) Forecast, by Application 2019 & 2032
- Table 73: Chile Augmented Reality & Mixed Reality Market Revenue (Million) Forecast, by Application 2019 & 2032
- Table 74: Chile Augmented Reality & Mixed Reality Market Volume (K Unit) Forecast, by Application 2019 & 2032
- Table 75: Colombia Augmented Reality & Mixed Reality Market Revenue (Million) Forecast, by Application 2019 & 2032
- Table 76: Colombia Augmented Reality & Mixed Reality Market Volume (K Unit) Forecast, by Application 2019 & 2032
- Table 77: Ecuador Augmented Reality & Mixed Reality Market Revenue (Million) Forecast, by Application 2019 & 2032
- Table 78: Ecuador Augmented Reality & Mixed Reality Market Volume (K Unit) Forecast, by Application 2019 & 2032
- Table 79: Venezuela Augmented Reality & Mixed Reality Market Revenue (Million) Forecast, by Application 2019 & 2032
- Table 80: Venezuela Augmented Reality & Mixed Reality Market Volume (K Unit) Forecast, by Application 2019 & 2032
- Table 81: Rest of South America Augmented Reality & Mixed Reality Market Revenue (Million) Forecast, by Application 2019 & 2032
- Table 82: Rest of South America Augmented Reality & Mixed Reality Market Volume (K Unit) Forecast, by Application 2019 & 2032
- Table 83: Global Augmented Reality & Mixed Reality Market Revenue Million Forecast, by Country 2019 & 2032
- Table 84: Global Augmented Reality & Mixed Reality Market Volume K Unit Forecast, by Country 2019 & 2032
- Table 85: United States Augmented Reality & Mixed Reality Market Revenue (Million) Forecast, by Application 2019 & 2032
- Table 86: United States Augmented Reality & Mixed Reality Market Volume (K Unit) Forecast, by Application 2019 & 2032
- Table 87: Canada Augmented Reality & Mixed Reality Market Revenue (Million) Forecast, by Application 2019 & 2032
- Table 88: Canada Augmented Reality & Mixed Reality Market Volume (K Unit) Forecast, by Application 2019 & 2032
- Table 89: Mexico Augmented Reality & Mixed Reality Market Revenue (Million) Forecast, by Application 2019 & 2032
- Table 90: Mexico Augmented Reality & Mixed Reality Market Volume (K Unit) Forecast, by Application 2019 & 2032
- Table 91: Global Augmented Reality & Mixed Reality Market Revenue Million Forecast, by Country 2019 & 2032
- Table 92: Global Augmented Reality & Mixed Reality Market Volume K Unit Forecast, by Country 2019 & 2032
- Table 93: United Arab Emirates Augmented Reality & Mixed Reality Market Revenue (Million) Forecast, by Application 2019 & 2032
- Table 94: United Arab Emirates Augmented Reality & Mixed Reality Market Volume (K Unit) Forecast, by Application 2019 & 2032
- Table 95: Saudi Arabia Augmented Reality & Mixed Reality Market Revenue (Million) Forecast, by Application 2019 & 2032
- Table 96: Saudi Arabia Augmented Reality & Mixed Reality Market Volume (K Unit) Forecast, by Application 2019 & 2032
- Table 97: South Africa Augmented Reality & Mixed Reality Market Revenue (Million) Forecast, by Application 2019 & 2032
- Table 98: South Africa Augmented Reality & Mixed Reality Market Volume (K Unit) Forecast, by Application 2019 & 2032
- Table 99: Rest of Middle East and Africa Augmented Reality & Mixed Reality Market Revenue (Million) Forecast, by Application 2019 & 2032
- Table 100: Rest of Middle East and Africa Augmented Reality & Mixed Reality Market Volume (K Unit) Forecast, by Application 2019 & 2032
- Table 101: Global Augmented Reality & Mixed Reality Market Revenue Million Forecast, by Type 2019 & 2032
- Table 102: Global Augmented Reality & Mixed Reality Market Volume K Unit Forecast, by Type 2019 & 2032
- Table 103: Global Augmented Reality & Mixed Reality Market Revenue Million Forecast, by End-user Vertical 2019 & 2032
- Table 104: Global Augmented Reality & Mixed Reality Market Volume K Unit Forecast, by End-user Vertical 2019 & 2032
- Table 105: Global Augmented Reality & Mixed Reality Market Revenue Million Forecast, by End-user Vertical 2019 & 2032
- Table 106: Global Augmented Reality & Mixed Reality Market Volume K Unit Forecast, by End-user Vertical 2019 & 2032
- Table 107: Global Augmented Reality & Mixed Reality Market Revenue Million Forecast, by Country 2019 & 2032
- Table 108: Global Augmented Reality & Mixed Reality Market Volume K Unit Forecast, by Country 2019 & 2032
- Table 109: Global Augmented Reality & Mixed Reality Market Revenue Million Forecast, by Type 2019 & 2032
- Table 110: Global Augmented Reality & Mixed Reality Market Volume K Unit Forecast, by Type 2019 & 2032
- Table 111: Global Augmented Reality & Mixed Reality Market Revenue Million Forecast, by End-user Vertical 2019 & 2032
- Table 112: Global Augmented Reality & Mixed Reality Market Volume K Unit Forecast, by End-user Vertical 2019 & 2032
- Table 113: Global Augmented Reality & Mixed Reality Market Revenue Million Forecast, by End-user Vertical 2019 & 2032
- Table 114: Global Augmented Reality & Mixed Reality Market Volume K Unit Forecast, by End-user Vertical 2019 & 2032
- Table 115: Global Augmented Reality & Mixed Reality Market Revenue Million Forecast, by Country 2019 & 2032
- Table 116: Global Augmented Reality & Mixed Reality Market Volume K Unit Forecast, by Country 2019 & 2032
- Table 117: Global Augmented Reality & Mixed Reality Market Revenue Million Forecast, by Type 2019 & 2032
- Table 118: Global Augmented Reality & Mixed Reality Market Volume K Unit Forecast, by Type 2019 & 2032
- Table 119: Global Augmented Reality & Mixed Reality Market Revenue Million Forecast, by End-user Vertical 2019 & 2032
- Table 120: Global Augmented Reality & Mixed Reality Market Volume K Unit Forecast, by End-user Vertical 2019 & 2032
- Table 121: Global Augmented Reality & Mixed Reality Market Revenue Million Forecast, by End-user Vertical 2019 & 2032
- Table 122: Global Augmented Reality & Mixed Reality Market Volume K Unit Forecast, by End-user Vertical 2019 & 2032
- Table 123: Global Augmented Reality & Mixed Reality Market Revenue Million Forecast, by Country 2019 & 2032
- Table 124: Global Augmented Reality & Mixed Reality Market Volume K Unit Forecast, by Country 2019 & 2032
- Table 125: Global Augmented Reality & Mixed Reality Market Revenue Million Forecast, by Type 2019 & 2032
- Table 126: Global Augmented Reality & Mixed Reality Market Volume K Unit Forecast, by Type 2019 & 2032
- Table 127: Global Augmented Reality & Mixed Reality Market Revenue Million Forecast, by End-user Vertical 2019 & 2032
- Table 128: Global Augmented Reality & Mixed Reality Market Volume K Unit Forecast, by End-user Vertical 2019 & 2032
- Table 129: Global Augmented Reality & Mixed Reality Market Revenue Million Forecast, by End-user Vertical 2019 & 2032
- Table 130: Global Augmented Reality & Mixed Reality Market Volume K Unit Forecast, by End-user Vertical 2019 & 2032
- Table 131: Global Augmented Reality & Mixed Reality Market Revenue Million Forecast, by Country 2019 & 2032
- Table 132: Global Augmented Reality & Mixed Reality Market Volume K Unit Forecast, by Country 2019 & 2032
- Table 133: Global Augmented Reality & Mixed Reality Market Revenue Million Forecast, by Type 2019 & 2032
- Table 134: Global Augmented Reality & Mixed Reality Market Volume K Unit Forecast, by Type 2019 & 2032
- Table 135: Global Augmented Reality & Mixed Reality Market Revenue Million Forecast, by End-user Vertical 2019 & 2032
- Table 136: Global Augmented Reality & Mixed Reality Market Volume K Unit Forecast, by End-user Vertical 2019 & 2032
- Table 137: Global Augmented Reality & Mixed Reality Market Revenue Million Forecast, by End-user Vertical 2019 & 2032
- Table 138: Global Augmented Reality & Mixed Reality Market Volume K Unit Forecast, by End-user Vertical 2019 & 2032
- Table 139: Global Augmented Reality & Mixed Reality Market Revenue Million Forecast, by Country 2019 & 2032
- Table 140: Global Augmented Reality & Mixed Reality Market Volume K Unit Forecast, by Country 2019 & 2032
- Table 141: Global Augmented Reality & Mixed Reality Market Revenue Million Forecast, by Type 2019 & 2032
- Table 142: Global Augmented Reality & Mixed Reality Market Volume K Unit Forecast, by Type 2019 & 2032
- Table 143: Global Augmented Reality & Mixed Reality Market Revenue Million Forecast, by End-user Vertical 2019 & 2032
- Table 144: Global Augmented Reality & Mixed Reality Market Volume K Unit Forecast, by End-user Vertical 2019 & 2032
- Table 145: Global Augmented Reality & Mixed Reality Market Revenue Million Forecast, by End-user Vertical 2019 & 2032
- Table 146: Global Augmented Reality & Mixed Reality Market Volume K Unit Forecast, by End-user Vertical 2019 & 2032
- Table 147: Global Augmented Reality & Mixed Reality Market Revenue Million Forecast, by Country 2019 & 2032
- Table 148: Global Augmented Reality & Mixed Reality Market Volume K Unit Forecast, by Country 2019 & 2032
- Table 149: Global Augmented Reality & Mixed Reality Market Revenue Million Forecast, by Type 2019 & 2032
- Table 150: Global Augmented Reality & Mixed Reality Market Volume K Unit Forecast, by Type 2019 & 2032
- Table 151: Global Augmented Reality & Mixed Reality Market Revenue Million Forecast, by End-user Vertical 2019 & 2032
- Table 152: Global Augmented Reality & Mixed Reality Market Volume K Unit Forecast, by End-user Vertical 2019 & 2032
- Table 153: Global Augmented Reality & Mixed Reality Market Revenue Million Forecast, by End-user Vertical 2019 & 2032
- Table 154: Global Augmented Reality & Mixed Reality Market Volume K Unit Forecast, by End-user Vertical 2019 & 2032
- Table 155: Global Augmented Reality & Mixed Reality Market Revenue Million Forecast, by Country 2019 & 2032
- Table 156: Global Augmented Reality & Mixed Reality Market Volume K Unit Forecast, by Country 2019 & 2032
- Table 157: Global Augmented Reality & Mixed Reality Market Revenue Million Forecast, by Type 2019 & 2032
- Table 158: Global Augmented Reality & Mixed Reality Market Volume K Unit Forecast, by Type 2019 & 2032
- Table 159: Global Augmented Reality & Mixed Reality Market Revenue Million Forecast, by End-user Vertical 2019 & 2032
- Table 160: Global Augmented Reality & Mixed Reality Market Volume K Unit Forecast, by End-user Vertical 2019 & 2032
- Table 161: Global Augmented Reality & Mixed Reality Market Revenue Million Forecast, by End-user Vertical 2019 & 2032
- Table 162: Global Augmented Reality & Mixed Reality Market Volume K Unit Forecast, by End-user Vertical 2019 & 2032
- Table 163: Global Augmented Reality & Mixed Reality Market Revenue Million Forecast, by Country 2019 & 2032
- Table 164: Global Augmented Reality & Mixed Reality Market Volume K Unit Forecast, by Country 2019 & 2032
Frequently Asked Questions
1. What is the projected Compound Annual Growth Rate (CAGR) of the Augmented Reality & Mixed Reality Market?
The projected CAGR is approximately 41.50%.
2. Which companies are prominent players in the Augmented Reality & Mixed Reality Market?
Key companies in the market include Dynabook Americas Inc (Sharp corporation), Samsung Electronics Company Limited, TechSee Augmented Vision Ltd, Acer Inc, HP Development Company LP, Magic Leap Inc, Amber Garage (Holokit), Wikitude GMBH, Google LLC (Alphabet Inc ), Microsoft Corporation, Vuzix Corporation, Ultraleap Limited, AsusTek Computer Inc, Seiko Epson Corporation, PTC Inc, Niantic Inc, Dell Technologies Inc, Occipital Inc, Realwear Inc, Atheer Inc, Optinvent, Blippar com Ltd.
3. What are the main segments of the Augmented Reality & Mixed Reality Market?
The market segments include Type, End-user Vertical, End-user Vertical.
4. Can you provide details about the market size?
The market size is estimated to be USD XX Million as of 2022.
5. What are some drivers contributing to market growth?
Increasing Applications of Augmented Reality; High Demand for Mobile-based Augmented Reality.
6. What are the notable trends driving market growth?
Increasing Applications of Augmented Reality Drives the Market Growth.
7. Are there any restraints impacting market growth?
Security Issues Associated with Mobile Payments.
8. Can you provide examples of recent developments in the market?
October 2022: Micledi Microdisplays, a leading developer of microLED displays for augmented reality (AR) glasses, and Kura Technologies, one of the top global innovators in AR headsets, announced a collaboration to manufacture AR glasses. The new glasses are designed by Kura and incorporate MICLEDI's unique 300mm microLED displays to achieve the performance required for Kura's next generation of AR glasses.
9. What pricing options are available for accessing the report?
Pricing options include single-user, multi-user, and enterprise licenses priced at USD 4750, USD 5250, and USD 8750 respectively.
10. Is the market size provided in terms of value or volume?
The market size is provided in terms of value, measured in Million and volume, measured in K Unit.
11. Are there any specific market keywords associated with the report?
Yes, the market keyword associated with the report is "Augmented Reality & Mixed Reality Market," which aids in identifying and referencing the specific market segment covered.
12. How do I determine which pricing option suits my needs best?
The pricing options vary based on user requirements and access needs. Individual users may opt for single-user licenses, while businesses requiring broader access may choose multi-user or enterprise licenses for cost-effective access to the report.
13. Are there any additional resources or data provided in the Augmented Reality & Mixed Reality Market report?
While the report offers comprehensive insights, it's advisable to review the specific contents or supplementary materials provided to ascertain if additional resources or data are available.
14. How can I stay updated on further developments or reports in the Augmented Reality & Mixed Reality Market?
To stay informed about further developments, trends, and reports in the Augmented Reality & Mixed Reality Market, consider subscribing to industry newsletters, following relevant companies and organizations, or regularly checking reputable industry news sources and publications.
Methodology
Step 1 - Identification of Relevant Samples Size from Population Database


Step 2 - Approaches for Defining Global Market Size (Value, Volume* & Price*)

Note*: In applicable scenarios
Step 3 - Data Sources
Primary Research
- Web Analytics
- Survey Reports
- Research Institute
- Latest Research Reports
- Opinion Leaders
Secondary Research
- Annual Reports
- White Paper
- Latest Press Release
- Industry Association
- Paid Database
- Investor Presentations

Step 4 - Data Triangulation
Involves using different sources of information in order to increase the validity of a study
These sources are likely to be stakeholders in a program - participants, other researchers, program staff, other community members, and so on.
Then we put all data in single framework & apply various statistical tools to find out the dynamic on the market.
During the analysis stage, feedback from the stakeholder groups would be compared to determine areas of agreement as well as areas of divergence
