

Key Insights
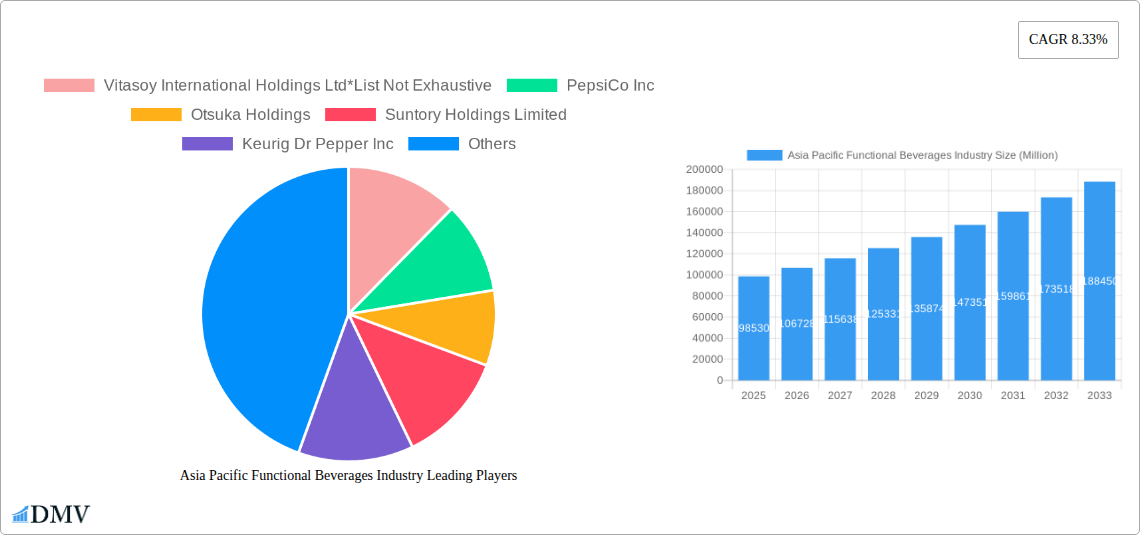
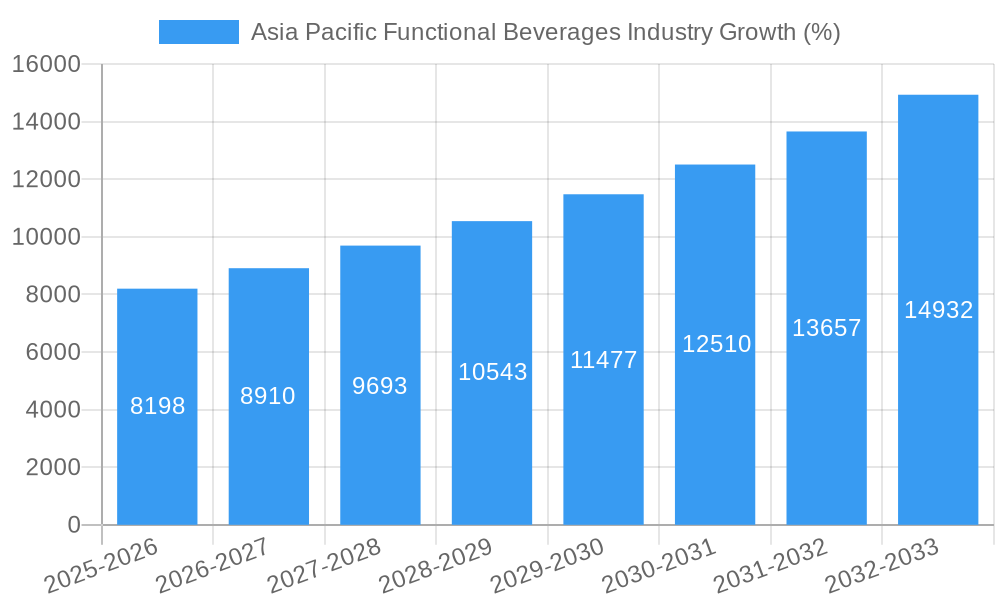
The Asia Pacific functional beverages market, valued at $98.53 billion in 2025, is projected to experience robust growth, driven by rising health consciousness, increasing disposable incomes, and a preference for convenient, nutritious options. The market's Compound Annual Growth Rate (CAGR) of 8.33% from 2019 to 2024 indicates a significant upward trajectory, expected to continue through 2033. Key growth drivers include the increasing popularity of energy drinks among young adults, the rising demand for sports drinks amongst athletes and fitness enthusiasts, and the growing awareness of the health benefits associated with fortified juices and dairy alternatives. Expanding distribution channels, particularly online retail, contribute to market expansion, reaching diverse consumer segments. While challenges such as fluctuating raw material prices and stringent regulations exist, the overall market outlook remains positive, fueled by ongoing innovation in product formulations and increasing consumer demand for functional beverages that cater to specific health and wellness goals. The significant presence of established multinational corporations like PepsiCo, Coca-Cola, and Nestlé, alongside regional players like Vitasoy, fuels competition and product diversification, further driving market growth. Specific regional markets like China, India, and Japan, with their large populations and rapidly growing middle classes, are major contributors to the overall market expansion within the Asia-Pacific region.
The segment analysis reveals a diverse market landscape. Energy drinks and sports drinks are likely the largest segments, driven by their appeal to younger demographics and active lifestyles. Fortified juices and dairy/dairy alternatives are gaining traction due to their health benefits and suitability for various consumer segments. Supermarkets and hypermarkets dominate distribution, but online retail channels are rapidly expanding, providing greater accessibility and convenience. The forecast period (2025-2033) anticipates sustained growth, driven by factors mentioned above and the continuous evolution of consumer preferences toward healthier, functional beverage choices. Continued innovation in product offerings, coupled with effective marketing strategies targeting specific health needs and lifestyles, will be crucial for sustained success within this dynamic market.
Asia Pacific Functional Beverages Industry: Market Analysis & Forecast 2019-2033
This comprehensive report provides a detailed analysis of the Asia Pacific functional beverages industry, encompassing market trends, competitive landscape, and future growth prospects from 2019 to 2033. The study covers key segments including energy drinks, sports drinks, fortified juices, dairy and dairy alternative beverages, and other product types, across various distribution channels. With a base year of 2025 and a forecast period extending to 2033, this report offers invaluable insights for stakeholders seeking to navigate this dynamic market. The total market value is projected to reach xx Million by 2033.
Asia Pacific Functional Beverages Industry Market Composition & Trends
This section delves into the intricacies of the Asia Pacific functional beverage market, analyzing market concentration, innovation drivers, regulatory frameworks, substitute products, end-user demographics, and mergers & acquisitions (M&A) activity. The report examines the market share distribution amongst key players and quantifies M&A deal values (xx Million) during the historical period (2019-2024).
- Market Concentration: The Asia Pacific functional beverage market exhibits a moderately concentrated landscape, with a few major players holding significant market share. However, a considerable number of smaller, regional players also contribute significantly.
- Innovation Catalysts: Growing consumer health consciousness and the increasing prevalence of health-related concerns are driving innovation in the functional beverage sector. Product diversification and technological advancements in formulation and packaging are key drivers.
- Regulatory Landscape: The report analyzes the impact of evolving food safety regulations and labeling requirements across different countries in the Asia Pacific region, highlighting their influence on market dynamics.
- Substitute Products: The report identifies and analyzes substitute products, such as plain water, juices, and other beverages, and their competitive impact on the functional beverage market.
- End-User Profiles: A detailed analysis of end-user demographics, including age, gender, income level, and lifestyle preferences, is provided to understand market segmentation and consumer behavior.
- M&A Activity: The report tracks M&A activity within the industry, analyzing deal values and their implications for market consolidation and competitive dynamics during the period 2019-2024.
Asia Pacific Functional Beverages Industry Industry Evolution
This section provides a comprehensive overview of the evolution of the Asia Pacific functional beverages market from 2019 to 2024, and projects growth trajectories to 2033. The analysis incorporates technological advancements influencing product development and shifting consumer preferences impacting demand patterns. Specific growth rates (xx%) and adoption metrics (xx%) are provided for key segments. The report explores the dynamic interplay between consumer demand for healthier options, technological innovations (e.g., improved formulation techniques, sustainable packaging), and the impact of these factors on market growth. The influence of changing lifestyles, health awareness, and government regulations are all considered in projecting future market trends.
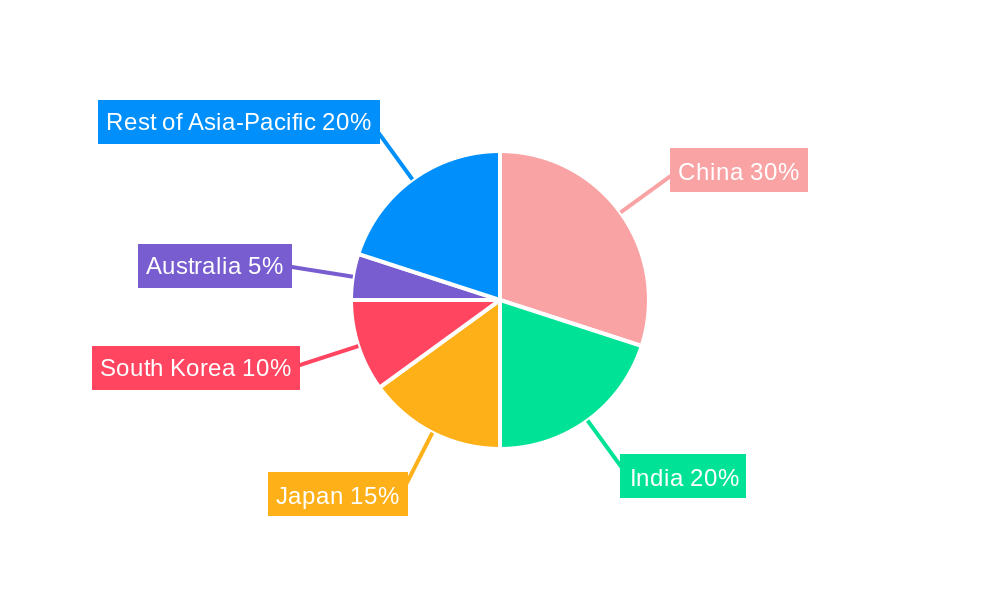
Leading Regions, Countries, or Segments in Asia Pacific Functional Beverages Industry
This section identifies the dominant regions, countries, and segments within the Asia Pacific functional beverages market. Detailed analysis of market leadership is presented for each of the product types (Energy Drinks, Sports Drinks, Fortified Juices, Dairy and Dairy Alternative Beverages, Other Product Types) and distribution channels (Supermarkets/Hypermarkets, Pharmacies/Drug Stores, Convenience Stores, Online Retail Stores, Other Distribution Channels).
Dominant Factors:
- High Growth Potential Markets: China, India, and other rapidly developing economies are identified as key growth areas.
- Product Type: The report details the market share of each product type, highlighting the dominant category and the factors contributing to its leadership.
- Distribution Channel: Analysis identifies the preferred distribution channel and reasons for its prominence, such as retail infrastructure development and consumer shopping habits.
Key Drivers (Examples):
- Investment Trends: Significant investments in research & development, production capacity, and marketing are identified as key drivers for market growth.
- Regulatory Support: Government policies supporting the health and wellness industry may have contributed to the expansion of specific segments.
Asia Pacific Functional Beverages Industry Product Innovations
This section details recent product innovations, focusing on unique selling propositions and technological advancements driving growth. Specific examples of innovative products, their functionalities, and performance metrics are included. This section highlights the competitive advantage gained through innovative product launches and technological upgrades in product formulations, packaging, and processing.
Propelling Factors for Asia Pacific Functional Beverages Industry Growth
Several factors are contributing to the growth of the Asia Pacific functional beverage market. These include rising health consciousness among consumers, increasing disposable incomes, and the proliferation of fitness and wellness trends. Further, technological advancements in product development and distribution are significantly accelerating market growth. The expansion of online retail channels and favorable government regulations are also boosting market expansion.
Obstacles in the Asia Pacific Functional Beverages Industry Market
Despite significant growth opportunities, challenges exist within the Asia Pacific functional beverages industry. These challenges encompass rigorous regulatory hurdles, supply chain disruptions, and intense competition amongst established and emerging players. These barriers may result in increased production costs and impact overall market profitability.
Future Opportunities in Asia Pacific Functional Beverages Industry
Future opportunities for growth are abundant in the Asia Pacific functional beverages industry. The rise of plant-based and organic options, along with innovations catering to niche consumer segments, provide lucrative prospects. Expanding into underserved markets and leveraging technological advancements in product development and marketing will be crucial for seizing future opportunities.
Major Players in the Asia Pacific Functional Beverages Industry Ecosystem
- Vitasoy International Holdings Ltd
- PepsiCo Inc
- Otsuka Holdings
- Suntory Holdings Limited
- Keurig Dr Pepper Inc
- Red Bull GmbH
- Danone S A
- The Coca-Cola Company
- Fonterra Co-operative Group Limited
- Nestlé S A
Key Developments in Asia Pacific Functional Beverages Industry Industry
- February 2022: Nestlé launched the new plant-based Milo in Thailand, expanding the plant-based beverage options.
- February 2022: Red Bull India launched a limited-edition watermelon-flavored energy drink, diversifying its product offerings and targeting consumer preferences.
- August 2022: Coca-Cola India introduced Limca Sportz, a new sports drink catering to the growing demand for hydration beverages. These launches demonstrate a focus on innovation and adaptation to local market demands.
Strategic Asia Pacific Functional Beverages Industry Market Forecast
The Asia Pacific functional beverages market is poised for robust growth over the forecast period (2025-2033), driven by increasing health consciousness, rising disposable incomes, and continuous product innovation. The expansion into new markets and product categories, combined with strategic partnerships and technological advancements, will contribute to this growth trajectory. The market’s future success will hinge on effectively addressing consumer demand for healthier, more convenient, and sustainably produced functional beverages.
Asia Pacific Functional Beverages Industry Segmentation
-
1. Product Type
- 1.1. Energy Drinks
- 1.2. Sports Drinks
- 1.3. Fortified Juices
- 1.4. Dairy and Dairy Alternative Beverage
- 1.5. Other Product Types
-
2. Distribution Channel
- 2.1. Supermarkets/Hypermarkets
- 2.2. Pharmacies/Drug Stores
- 2.3. Convenience Stores
- 2.4. Online Retail Stores
- 2.5. Other Distribution Channels
-
3. Geography
- 3.1. China
- 3.2. India
- 3.3. Japan
- 3.4. Australia
- 3.5. Rest of Asia-Pacific
Asia Pacific Functional Beverages Industry Segmentation By Geography
- 1. China
- 2. India
- 3. Japan
- 4. Australia
- 5. Rest of Asia Pacific
Asia Pacific Functional Beverages Industry REPORT HIGHLIGHTS
| Aspects | Details |
|---|---|
| Study Period | 2019-2033 |
| Base Year | 2024 |
| Estimated Year | 2025 |
| Forecast Period | 2025-2033 |
| Historical Period | 2019-2024 |
| Growth Rate | CAGR of 8.33% from 2019-2033 |
| Segmentation |
|
Table of Contents
- 1. Introduction
- 1.1. Research Scope
- 1.2. Market Segmentation
- 1.3. Research Methodology
- 1.4. Definitions and Assumptions
- 2. Executive Summary
- 2.1. Introduction
- 3. Market Dynamics
- 3.1. Introduction
- 3.2. Market Drivers
- 3.2.1. Growing Consumer Inclination Toward Low-sugar/Sugar-free Beverages; Expenditure on Advertisement and Promotional Activities
- 3.3. Market Restrains
- 3.3.1. Concerns Over Health Issues Associated with Functional Beverages
- 3.4. Market Trends
- 3.4.1. Growing Consumer Inclination Toward Low-Sugar/Sugar-free Beverages
- 4. Market Factor Analysis
- 4.1. Porters Five Forces
- 4.2. Supply/Value Chain
- 4.3. PESTEL analysis
- 4.4. Market Entropy
- 4.5. Patent/Trademark Analysis
- 5. Asia Pacific Functional Beverages Industry Analysis, Insights and Forecast, 2019-2031
- 5.1. Market Analysis, Insights and Forecast - by Product Type
- 5.1.1. Energy Drinks
- 5.1.2. Sports Drinks
- 5.1.3. Fortified Juices
- 5.1.4. Dairy and Dairy Alternative Beverage
- 5.1.5. Other Product Types
- 5.2. Market Analysis, Insights and Forecast - by Distribution Channel
- 5.2.1. Supermarkets/Hypermarkets
- 5.2.2. Pharmacies/Drug Stores
- 5.2.3. Convenience Stores
- 5.2.4. Online Retail Stores
- 5.2.5. Other Distribution Channels
- 5.3. Market Analysis, Insights and Forecast - by Geography
- 5.3.1. China
- 5.3.2. India
- 5.3.3. Japan
- 5.3.4. Australia
- 5.3.5. Rest of Asia-Pacific
- 5.4. Market Analysis, Insights and Forecast - by Region
- 5.4.1. China
- 5.4.2. India
- 5.4.3. Japan
- 5.4.4. Australia
- 5.4.5. Rest of Asia Pacific
- 5.1. Market Analysis, Insights and Forecast - by Product Type
- 6. China Asia Pacific Functional Beverages Industry Analysis, Insights and Forecast, 2019-2031
- 6.1. Market Analysis, Insights and Forecast - by Product Type
- 6.1.1. Energy Drinks
- 6.1.2. Sports Drinks
- 6.1.3. Fortified Juices
- 6.1.4. Dairy and Dairy Alternative Beverage
- 6.1.5. Other Product Types
- 6.2. Market Analysis, Insights and Forecast - by Distribution Channel
- 6.2.1. Supermarkets/Hypermarkets
- 6.2.2. Pharmacies/Drug Stores
- 6.2.3. Convenience Stores
- 6.2.4. Online Retail Stores
- 6.2.5. Other Distribution Channels
- 6.3. Market Analysis, Insights and Forecast - by Geography
- 6.3.1. China
- 6.3.2. India
- 6.3.3. Japan
- 6.3.4. Australia
- 6.3.5. Rest of Asia-Pacific
- 6.1. Market Analysis, Insights and Forecast - by Product Type
- 7. India Asia Pacific Functional Beverages Industry Analysis, Insights and Forecast, 2019-2031
- 7.1. Market Analysis, Insights and Forecast - by Product Type
- 7.1.1. Energy Drinks
- 7.1.2. Sports Drinks
- 7.1.3. Fortified Juices
- 7.1.4. Dairy and Dairy Alternative Beverage
- 7.1.5. Other Product Types
- 7.2. Market Analysis, Insights and Forecast - by Distribution Channel
- 7.2.1. Supermarkets/Hypermarkets
- 7.2.2. Pharmacies/Drug Stores
- 7.2.3. Convenience Stores
- 7.2.4. Online Retail Stores
- 7.2.5. Other Distribution Channels
- 7.3. Market Analysis, Insights and Forecast - by Geography
- 7.3.1. China
- 7.3.2. India
- 7.3.3. Japan
- 7.3.4. Australia
- 7.3.5. Rest of Asia-Pacific
- 7.1. Market Analysis, Insights and Forecast - by Product Type
- 8. Japan Asia Pacific Functional Beverages Industry Analysis, Insights and Forecast, 2019-2031
- 8.1. Market Analysis, Insights and Forecast - by Product Type
- 8.1.1. Energy Drinks
- 8.1.2. Sports Drinks
- 8.1.3. Fortified Juices
- 8.1.4. Dairy and Dairy Alternative Beverage
- 8.1.5. Other Product Types
- 8.2. Market Analysis, Insights and Forecast - by Distribution Channel
- 8.2.1. Supermarkets/Hypermarkets
- 8.2.2. Pharmacies/Drug Stores
- 8.2.3. Convenience Stores
- 8.2.4. Online Retail Stores
- 8.2.5. Other Distribution Channels
- 8.3. Market Analysis, Insights and Forecast - by Geography
- 8.3.1. China
- 8.3.2. India
- 8.3.3. Japan
- 8.3.4. Australia
- 8.3.5. Rest of Asia-Pacific
- 8.1. Market Analysis, Insights and Forecast - by Product Type
- 9. Australia Asia Pacific Functional Beverages Industry Analysis, Insights and Forecast, 2019-2031
- 9.1. Market Analysis, Insights and Forecast - by Product Type
- 9.1.1. Energy Drinks
- 9.1.2. Sports Drinks
- 9.1.3. Fortified Juices
- 9.1.4. Dairy and Dairy Alternative Beverage
- 9.1.5. Other Product Types
- 9.2. Market Analysis, Insights and Forecast - by Distribution Channel
- 9.2.1. Supermarkets/Hypermarkets
- 9.2.2. Pharmacies/Drug Stores
- 9.2.3. Convenience Stores
- 9.2.4. Online Retail Stores
- 9.2.5. Other Distribution Channels
- 9.3. Market Analysis, Insights and Forecast - by Geography
- 9.3.1. China
- 9.3.2. India
- 9.3.3. Japan
- 9.3.4. Australia
- 9.3.5. Rest of Asia-Pacific
- 9.1. Market Analysis, Insights and Forecast - by Product Type
- 10. Rest of Asia Pacific Asia Pacific Functional Beverages Industry Analysis, Insights and Forecast, 2019-2031
- 10.1. Market Analysis, Insights and Forecast - by Product Type
- 10.1.1. Energy Drinks
- 10.1.2. Sports Drinks
- 10.1.3. Fortified Juices
- 10.1.4. Dairy and Dairy Alternative Beverage
- 10.1.5. Other Product Types
- 10.2. Market Analysis, Insights and Forecast - by Distribution Channel
- 10.2.1. Supermarkets/Hypermarkets
- 10.2.2. Pharmacies/Drug Stores
- 10.2.3. Convenience Stores
- 10.2.4. Online Retail Stores
- 10.2.5. Other Distribution Channels
- 10.3. Market Analysis, Insights and Forecast - by Geography
- 10.3.1. China
- 10.3.2. India
- 10.3.3. Japan
- 10.3.4. Australia
- 10.3.5. Rest of Asia-Pacific
- 10.1. Market Analysis, Insights and Forecast - by Product Type
- 11. China Asia Pacific Functional Beverages Industry Analysis, Insights and Forecast, 2019-2031
- 12. Japan Asia Pacific Functional Beverages Industry Analysis, Insights and Forecast, 2019-2031
- 13. India Asia Pacific Functional Beverages Industry Analysis, Insights and Forecast, 2019-2031
- 14. South Korea Asia Pacific Functional Beverages Industry Analysis, Insights and Forecast, 2019-2031
- 15. Taiwan Asia Pacific Functional Beverages Industry Analysis, Insights and Forecast, 2019-2031
- 16. Australia Asia Pacific Functional Beverages Industry Analysis, Insights and Forecast, 2019-2031
- 17. Rest of Asia-Pacific Asia Pacific Functional Beverages Industry Analysis, Insights and Forecast, 2019-2031
- 18. Competitive Analysis
- 18.1. Market Share Analysis 2024
- 18.2. Company Profiles
- 18.2.1 Vitasoy International Holdings Ltd*List Not Exhaustive
- 18.2.1.1. Overview
- 18.2.1.2. Products
- 18.2.1.3. SWOT Analysis
- 18.2.1.4. Recent Developments
- 18.2.1.5. Financials (Based on Availability)
- 18.2.2 PepsiCo Inc
- 18.2.2.1. Overview
- 18.2.2.2. Products
- 18.2.2.3. SWOT Analysis
- 18.2.2.4. Recent Developments
- 18.2.2.5. Financials (Based on Availability)
- 18.2.3 Otsuka Holdings
- 18.2.3.1. Overview
- 18.2.3.2. Products
- 18.2.3.3. SWOT Analysis
- 18.2.3.4. Recent Developments
- 18.2.3.5. Financials (Based on Availability)
- 18.2.4 Suntory Holdings Limited
- 18.2.4.1. Overview
- 18.2.4.2. Products
- 18.2.4.3. SWOT Analysis
- 18.2.4.4. Recent Developments
- 18.2.4.5. Financials (Based on Availability)
- 18.2.5 Keurig Dr Pepper Inc
- 18.2.5.1. Overview
- 18.2.5.2. Products
- 18.2.5.3. SWOT Analysis
- 18.2.5.4. Recent Developments
- 18.2.5.5. Financials (Based on Availability)
- 18.2.6 Red Bull GmbH
- 18.2.6.1. Overview
- 18.2.6.2. Products
- 18.2.6.3. SWOT Analysis
- 18.2.6.4. Recent Developments
- 18.2.6.5. Financials (Based on Availability)
- 18.2.7 Danone S A
- 18.2.7.1. Overview
- 18.2.7.2. Products
- 18.2.7.3. SWOT Analysis
- 18.2.7.4. Recent Developments
- 18.2.7.5. Financials (Based on Availability)
- 18.2.8 The Coca-Cola Company
- 18.2.8.1. Overview
- 18.2.8.2. Products
- 18.2.8.3. SWOT Analysis
- 18.2.8.4. Recent Developments
- 18.2.8.5. Financials (Based on Availability)
- 18.2.9 Fonterra Co-operative Group Limited
- 18.2.9.1. Overview
- 18.2.9.2. Products
- 18.2.9.3. SWOT Analysis
- 18.2.9.4. Recent Developments
- 18.2.9.5. Financials (Based on Availability)
- 18.2.10 Nestlé S A
- 18.2.10.1. Overview
- 18.2.10.2. Products
- 18.2.10.3. SWOT Analysis
- 18.2.10.4. Recent Developments
- 18.2.10.5. Financials (Based on Availability)
- 18.2.1 Vitasoy International Holdings Ltd*List Not Exhaustive
List of Figures
- Figure 1: Asia Pacific Functional Beverages Industry Revenue Breakdown (Million, %) by Product 2024 & 2032
- Figure 2: Asia Pacific Functional Beverages Industry Share (%) by Company 2024
List of Tables
- Table 1: Asia Pacific Functional Beverages Industry Revenue Million Forecast, by Region 2019 & 2032
- Table 2: Asia Pacific Functional Beverages Industry Revenue Million Forecast, by Product Type 2019 & 2032
- Table 3: Asia Pacific Functional Beverages Industry Revenue Million Forecast, by Distribution Channel 2019 & 2032
- Table 4: Asia Pacific Functional Beverages Industry Revenue Million Forecast, by Geography 2019 & 2032
- Table 5: Asia Pacific Functional Beverages Industry Revenue Million Forecast, by Region 2019 & 2032
- Table 6: Asia Pacific Functional Beverages Industry Revenue Million Forecast, by Country 2019 & 2032
- Table 7: China Asia Pacific Functional Beverages Industry Revenue (Million) Forecast, by Application 2019 & 2032
- Table 8: Japan Asia Pacific Functional Beverages Industry Revenue (Million) Forecast, by Application 2019 & 2032
- Table 9: India Asia Pacific Functional Beverages Industry Revenue (Million) Forecast, by Application 2019 & 2032
- Table 10: South Korea Asia Pacific Functional Beverages Industry Revenue (Million) Forecast, by Application 2019 & 2032
- Table 11: Taiwan Asia Pacific Functional Beverages Industry Revenue (Million) Forecast, by Application 2019 & 2032
- Table 12: Australia Asia Pacific Functional Beverages Industry Revenue (Million) Forecast, by Application 2019 & 2032
- Table 13: Rest of Asia-Pacific Asia Pacific Functional Beverages Industry Revenue (Million) Forecast, by Application 2019 & 2032
- Table 14: Asia Pacific Functional Beverages Industry Revenue Million Forecast, by Product Type 2019 & 2032
- Table 15: Asia Pacific Functional Beverages Industry Revenue Million Forecast, by Distribution Channel 2019 & 2032
- Table 16: Asia Pacific Functional Beverages Industry Revenue Million Forecast, by Geography 2019 & 2032
- Table 17: Asia Pacific Functional Beverages Industry Revenue Million Forecast, by Country 2019 & 2032
- Table 18: Asia Pacific Functional Beverages Industry Revenue Million Forecast, by Product Type 2019 & 2032
- Table 19: Asia Pacific Functional Beverages Industry Revenue Million Forecast, by Distribution Channel 2019 & 2032
- Table 20: Asia Pacific Functional Beverages Industry Revenue Million Forecast, by Geography 2019 & 2032
- Table 21: Asia Pacific Functional Beverages Industry Revenue Million Forecast, by Country 2019 & 2032
- Table 22: Asia Pacific Functional Beverages Industry Revenue Million Forecast, by Product Type 2019 & 2032
- Table 23: Asia Pacific Functional Beverages Industry Revenue Million Forecast, by Distribution Channel 2019 & 2032
- Table 24: Asia Pacific Functional Beverages Industry Revenue Million Forecast, by Geography 2019 & 2032
- Table 25: Asia Pacific Functional Beverages Industry Revenue Million Forecast, by Country 2019 & 2032
- Table 26: Asia Pacific Functional Beverages Industry Revenue Million Forecast, by Product Type 2019 & 2032
- Table 27: Asia Pacific Functional Beverages Industry Revenue Million Forecast, by Distribution Channel 2019 & 2032
- Table 28: Asia Pacific Functional Beverages Industry Revenue Million Forecast, by Geography 2019 & 2032
- Table 29: Asia Pacific Functional Beverages Industry Revenue Million Forecast, by Country 2019 & 2032
- Table 30: Asia Pacific Functional Beverages Industry Revenue Million Forecast, by Product Type 2019 & 2032
- Table 31: Asia Pacific Functional Beverages Industry Revenue Million Forecast, by Distribution Channel 2019 & 2032
- Table 32: Asia Pacific Functional Beverages Industry Revenue Million Forecast, by Geography 2019 & 2032
- Table 33: Asia Pacific Functional Beverages Industry Revenue Million Forecast, by Country 2019 & 2032
Frequently Asked Questions
1. What is the projected Compound Annual Growth Rate (CAGR) of the Asia Pacific Functional Beverages Industry?
The projected CAGR is approximately 8.33%.
2. Which companies are prominent players in the Asia Pacific Functional Beverages Industry?
Key companies in the market include Vitasoy International Holdings Ltd*List Not Exhaustive, PepsiCo Inc, Otsuka Holdings, Suntory Holdings Limited, Keurig Dr Pepper Inc, Red Bull GmbH, Danone S A, The Coca-Cola Company, Fonterra Co-operative Group Limited, Nestlé S A.
3. What are the main segments of the Asia Pacific Functional Beverages Industry?
The market segments include Product Type, Distribution Channel, Geography.
4. Can you provide details about the market size?
The market size is estimated to be USD 98.53 Million as of 2022.
5. What are some drivers contributing to market growth?
Growing Consumer Inclination Toward Low-sugar/Sugar-free Beverages; Expenditure on Advertisement and Promotional Activities.
6. What are the notable trends driving market growth?
Growing Consumer Inclination Toward Low-Sugar/Sugar-free Beverages.
7. Are there any restraints impacting market growth?
Concerns Over Health Issues Associated with Functional Beverages.
8. Can you provide examples of recent developments in the market?
August 2022: Coca-Cola India introduced Limca Sportz, an n-fizz beverage based on glucose and electrolytes. Limca Sportz, which is made of water, helps people who are doing physically demanding activities like sports, exercise, and very hard chores rehydrate more quickly.
9. What pricing options are available for accessing the report?
Pricing options include single-user, multi-user, and enterprise licenses priced at USD 4750, USD 5250, and USD 8750 respectively.
10. Is the market size provided in terms of value or volume?
The market size is provided in terms of value, measured in Million.
11. Are there any specific market keywords associated with the report?
Yes, the market keyword associated with the report is "Asia Pacific Functional Beverages Industry," which aids in identifying and referencing the specific market segment covered.
12. How do I determine which pricing option suits my needs best?
The pricing options vary based on user requirements and access needs. Individual users may opt for single-user licenses, while businesses requiring broader access may choose multi-user or enterprise licenses for cost-effective access to the report.
13. Are there any additional resources or data provided in the Asia Pacific Functional Beverages Industry report?
While the report offers comprehensive insights, it's advisable to review the specific contents or supplementary materials provided to ascertain if additional resources or data are available.
14. How can I stay updated on further developments or reports in the Asia Pacific Functional Beverages Industry?
To stay informed about further developments, trends, and reports in the Asia Pacific Functional Beverages Industry, consider subscribing to industry newsletters, following relevant companies and organizations, or regularly checking reputable industry news sources and publications.
Methodology
Step 1 - Identification of Relevant Samples Size from Population Database


Step 2 - Approaches for Defining Global Market Size (Value, Volume* & Price*)

Note*: In applicable scenarios
Step 3 - Data Sources
Primary Research
- Web Analytics
- Survey Reports
- Research Institute
- Latest Research Reports
- Opinion Leaders
Secondary Research
- Annual Reports
- White Paper
- Latest Press Release
- Industry Association
- Paid Database
- Investor Presentations

Step 4 - Data Triangulation
Involves using different sources of information in order to increase the validity of a study
These sources are likely to be stakeholders in a program - participants, other researchers, program staff, other community members, and so on.
Then we put all data in single framework & apply various statistical tools to find out the dynamic on the market.
During the analysis stage, feedback from the stakeholder groups would be compared to determine areas of agreement as well as areas of divergence
