

Key Insights
The Asia-Pacific Demand Response (DR) market is experiencing robust growth, driven by increasing electricity prices, stringent environmental regulations, and the expanding integration of renewable energy sources. The region's diverse energy landscape, coupled with a burgeoning population and rapid industrialization, presents significant opportunities for DR technologies. The market's Compound Annual Growth Rate (CAGR) exceeding 7.20% from 2019 to 2024 indicates a strong upward trajectory, projected to continue throughout the forecast period (2025-2033). The segment breakdown reveals a significant contribution from the commercial and industrial sectors, driven by the cost-saving potential and enhanced grid stability offered by DR programs. China, Japan, India, and South Korea are key contributors to the overall market size, with China holding a potentially dominant share due to its massive energy consumption and government initiatives promoting energy efficiency. Automated Demand Response (ADR) systems are gaining traction over conventional approaches, propelled by advancements in smart grid technologies and the proliferation of interconnected devices. While challenges exist, such as high initial investment costs and a lack of awareness among residential consumers, government incentives and supportive policies are expected to mitigate these restraints. The adoption of DR solutions is likely to be accelerated by increasing electricity demand and the need for grid modernization, ensuring continued market expansion throughout the forecast period.
The competitive landscape features a mix of established players and emerging technology providers, highlighting the industry's dynamic nature. Companies like ABB, Hitachi, and Siemens are leveraging their existing expertise in grid infrastructure and automation to expand their DR offerings. Meanwhile, smaller, specialized companies like Autogrid Systems are focusing on innovative software solutions and data analytics to optimize DR programs. The continued development of advanced analytics, artificial intelligence (AI), and machine learning (ML) within DR systems promises to further enhance efficiency and profitability, driving market growth and attracting further investment. Specific regional data suggests that the Asia-Pacific region, especially the aforementioned major economies, will continue to see significant market expansion, propelled by supportive regulatory environments and increasing energy security concerns.
Asia Pacific Demand Response Industry Market Report: 2019-2033
This comprehensive report provides an in-depth analysis of the Asia Pacific Demand Response industry, offering invaluable insights for stakeholders seeking to navigate this rapidly evolving market. With a focus on the 2019-2033 period, including a base year of 2025 and a forecast period spanning 2025-2033, this report delivers crucial data and forecasts to inform strategic decision-making. The market is valued at xx Million in 2025 and is projected to reach xx Million by 2033, exhibiting a CAGR of xx%.
Asia Pacific Demand Response Industry Market Composition & Trends
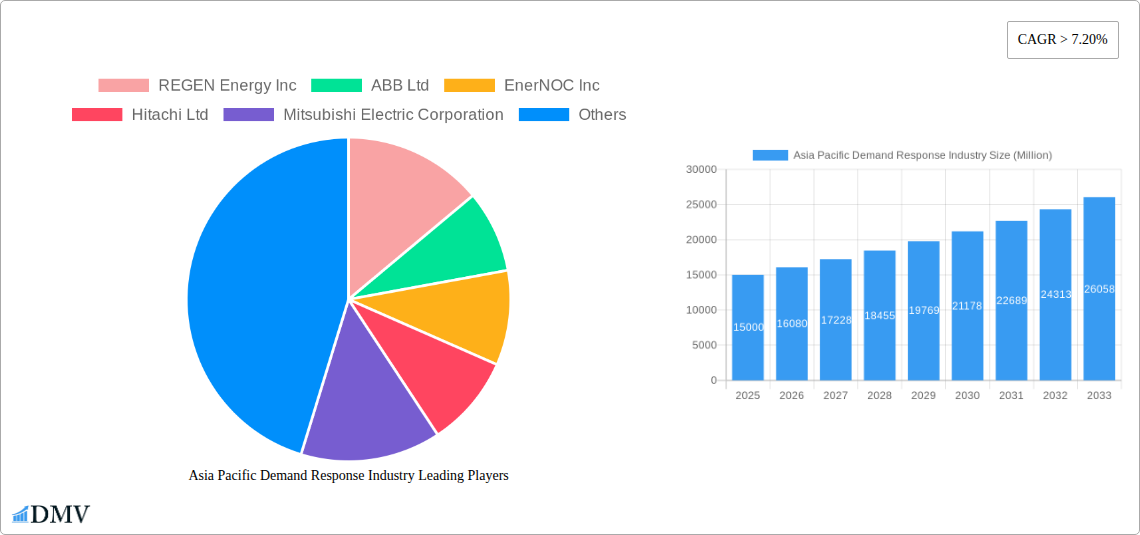
This section delves into the intricate landscape of the Asia Pacific Demand Response market, analyzing market concentration, innovation drivers, regulatory frameworks, substitute products, and end-user profiles. We examine the competitive dynamics, including mergers and acquisitions (M&A) activities. Market share is distributed among key players such as REGEN Energy Inc, ABB Ltd, EnerNOC Inc, Hitachi Ltd, Mitsubishi Electric Corporation, Siemens AG, Schneider Electric SE, Eaton Corporation PLC, Alstom Inc, General Electric Company, Silver Spring Networks, and Autogrid Systems Inc. While precise market share distribution for 2025 requires extensive proprietary data, our analysis suggests a moderately concentrated market with several significant players holding substantial shares. The total value of M&A deals within the industry during the historical period (2019-2024) is estimated at xx Million. Innovation is primarily driven by advancements in smart grid technologies and the increasing adoption of automated demand response systems. Regulatory landscapes vary across the region, with some countries offering more supportive policies than others. Substitute products include traditional energy efficiency measures and alternative energy sources. End-user profiles show a growing adoption across residential, commercial, and industrial sectors, with industrial users currently dominating the market share.
- Market Concentration: Moderately concentrated, with several major players holding significant shares.
- Innovation Catalysts: Smart grid technologies, automated demand response systems.
- Regulatory Landscape: Varies significantly across the region, impacting market growth.
- Substitute Products: Traditional energy efficiency measures, alternative energy sources.
- End-User Profiles: Dominated by industrial users, with growing adoption in residential and commercial sectors.
- M&A Activity: Total deal value (2019-2024) estimated at xx Million.
Asia Pacific Demand Response Industry Industry Evolution
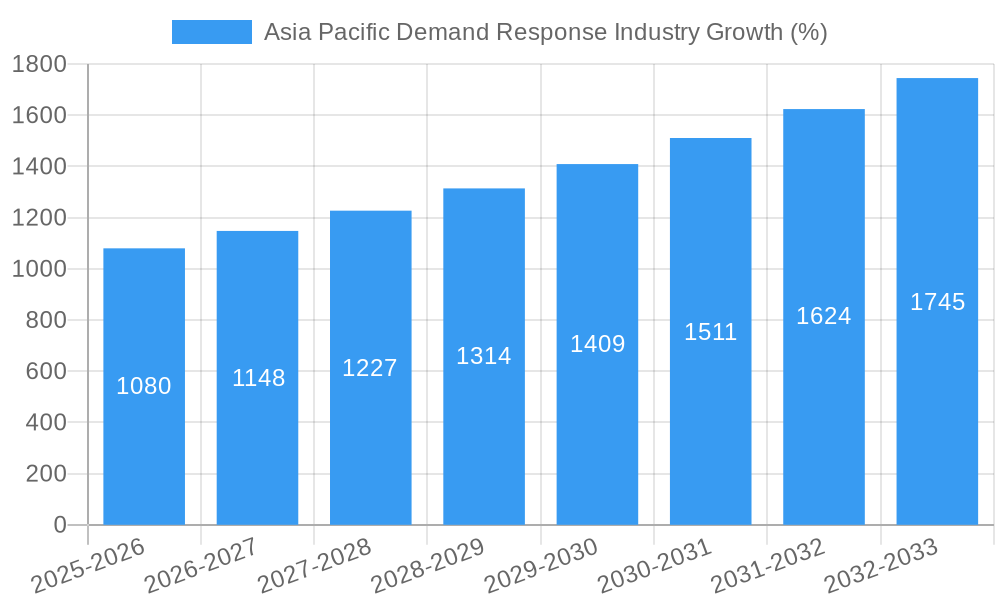
This section analyzes the evolution of the Asia Pacific Demand Response market, tracing its growth trajectory, technological advancements, and the shifting dynamics of consumer demand from 2019 to 2033. The market experienced significant growth during the historical period (2019-2024), driven by increasing energy prices, government regulations promoting energy efficiency, and advancements in smart grid technologies. The growth rate is expected to accelerate during the forecast period (2025-2033) due to factors such as rising energy demand, increasing adoption of renewable energy sources, and continued technological innovation. The adoption of automated demand response systems is rapidly increasing, fueled by the decreasing costs of sensors, communication technologies, and data analytics. Consumer demand is shifting towards more sophisticated and integrated solutions that offer greater control and energy savings. Technological advancements, such as AI-powered optimization algorithms, are enhancing the efficiency and effectiveness of demand response programs. Specific data points, such as precise growth rates and adoption metrics, are presented within the full report.
Leading Regions, Countries, or Segments in Asia Pacific Demand Response Industry
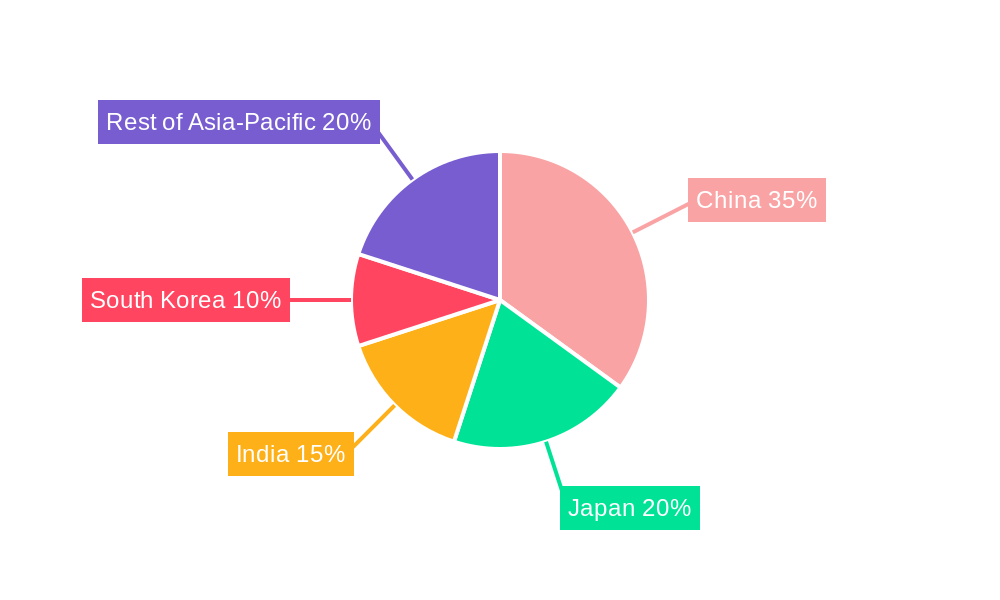
This section identifies the dominant regions, countries, and segments within the Asia Pacific Demand Response market. China, Japan, and India are currently leading the market, driven by factors such as robust economic growth, large energy consumption, and supportive government policies. The industrial segment currently dominates end-use applications, while automated demand response systems are gaining popularity over conventional methods.
- Dominant Regions:
- China: Strong government support for energy efficiency and renewable energy integration, high energy consumption.
- Japan: Advanced technological infrastructure, focus on energy security, supportive regulatory environment.
- India: Rapid economic growth, increasing energy demand, government initiatives promoting energy efficiency.
- Dominant Segments:
- End-Use: Industrial (driven by significant energy consumption and potential for cost savings).
- Type: Automated Demand Response (growing adoption due to technological advancements and enhanced efficiency).
Asia Pacific Demand Response Industry Product Innovations
Recent years have witnessed significant product innovations in the Asia Pacific Demand Response industry. Companies are developing advanced algorithms for predictive load forecasting and real-time optimization of energy consumption. New sensors and communication technologies are improving the accuracy and reliability of demand response programs. The integration of renewable energy sources into demand response systems is also gaining traction, offering greater flexibility and sustainability. These innovations are improving the efficiency, cost-effectiveness, and environmental benefits of demand response programs, driving wider adoption across various sectors.
Propelling Factors for Asia Pacific Demand Response Industry Growth
The Asia Pacific Demand Response market is experiencing robust growth, driven by a confluence of technological, economic, and regulatory factors. Technological advancements, such as the development of sophisticated smart meters and advanced analytics platforms, are enhancing the efficiency and effectiveness of demand response programs. Economically, increasing energy prices and the rising cost of grid infrastructure are incentivizing the adoption of demand response technologies to reduce energy consumption and costs. Regulatory support, in the form of government mandates and financial incentives, is further boosting market growth. Examples include the various renewable energy targets and energy efficiency standards set by governments across the region.
Obstacles in the Asia Pacific Demand Response Industry Market
Despite the significant growth potential, the Asia Pacific Demand Response market faces several challenges. Regulatory hurdles, such as inconsistent policies across different countries and regions, can hinder market expansion. Supply chain disruptions, particularly for critical components like sensors and communication equipment, can affect the timely deployment of demand response solutions. Furthermore, intense competition among established players and new entrants creates pressure on pricing and profitability. These factors collectively pose a significant challenge to the sustained growth of the industry.
Future Opportunities in Asia Pacific Demand Response Industry
The Asia Pacific Demand Response market presents several exciting future opportunities. The expanding adoption of renewable energy sources creates new avenues for integrating demand response technologies into a more sustainable energy ecosystem. The emergence of new technologies, such as AI and machine learning, can further optimize demand response programs and enhance energy efficiency. Additionally, the growing awareness of climate change and the increasing demand for environmentally friendly energy solutions are expected to fuel market expansion.
Major Players in the Asia Pacific Demand Response Industry Ecosystem
- REGEN Energy Inc
- ABB Ltd
- EnerNOC Inc
- Hitachi Ltd
- Mitsubishi Electric Corporation
- Siemens AG
- Schneider Electric SE
- Eaton Corporation PLC
- Alstom Inc
- General Electric Company
- Silver Spring Networks
- Autogrid Systems Inc
Key Developments in Asia Pacific Demand Response Industry Industry
- 2023-Q3: Launch of a new AI-powered demand response platform by ABB Ltd.
- 2022-Q4: Merger between two leading demand response providers in Japan, resulting in a larger market share.
- 2021-Q2: Government of India announces new incentives for the adoption of demand response technologies.
- 2020-Q1: Significant investment in smart grid infrastructure by China’s State Grid Corporation.
- Further key developments will be detailed in the full report.
Strategic Asia Pacific Demand Response Industry Market Forecast
The Asia Pacific Demand Response market is poised for sustained growth over the forecast period (2025-2033). Driven by increasing energy prices, supportive government policies, and technological advancements, the market is expected to experience significant expansion. The growing adoption of renewable energy sources and the increasing awareness of climate change will further accelerate market growth. The rising demand for energy efficiency solutions and the potential for cost savings through demand response programs will continue to attract investments and drive innovation within the industry, creating substantial opportunities for players in this dynamic market.
Asia Pacific Demand Response Industry Segmentation
-
1. Type
- 1.1. Conventional Demand Response
- 1.2. Automated Demand Response
-
2. Geography
- 2.1. Australia
- 2.2. China
- 2.3. India
- 2.4. Japan
- 2.5. Rest of Asia-Pacific
Asia Pacific Demand Response Industry Segmentation By Geography
- 1. Australia
- 2. China
- 3. India
- 4. Japan
- 5. Rest of Asia Pacific
Asia Pacific Demand Response Industry REPORT HIGHLIGHTS
| Aspects | Details |
|---|---|
| Study Period | 2019-2033 |
| Base Year | 2024 |
| Estimated Year | 2025 |
| Forecast Period | 2025-2033 |
| Historical Period | 2019-2024 |
| Growth Rate | CAGR of > 7.20% from 2019-2033 |
| Segmentation |
|
Table of Contents
- 1. Introduction
- 1.1. Research Scope
- 1.2. Market Segmentation
- 1.3. Research Methodology
- 1.4. Definitions and Assumptions
- 2. Executive Summary
- 2.1. Introduction
- 3. Market Dynamics
- 3.1. Introduction
- 3.2. Market Drivers
- 3.2.1. 4.; Growing Demand for Energy As A Service4.; Increasing Adoption of Distributed Energy Generation in Commercial and Industrial Sectors
- 3.3. Market Restrains
- 3.3.1. 4.; Lack of Awareness in Developing Economies and High Technological Costs
- 3.4. Market Trends
- 3.4.1. Automated Demand Response System Likely To Drive The Market
- 4. Market Factor Analysis
- 4.1. Porters Five Forces
- 4.2. Supply/Value Chain
- 4.3. PESTEL analysis
- 4.4. Market Entropy
- 4.5. Patent/Trademark Analysis
- 5. Asia Pacific Demand Response Industry Analysis, Insights and Forecast, 2019-2031
- 5.1. Market Analysis, Insights and Forecast - by Type
- 5.1.1. Conventional Demand Response
- 5.1.2. Automated Demand Response
- 5.2. Market Analysis, Insights and Forecast - by Geography
- 5.2.1. Australia
- 5.2.2. China
- 5.2.3. India
- 5.2.4. Japan
- 5.2.5. Rest of Asia-Pacific
- 5.3. Market Analysis, Insights and Forecast - by Region
- 5.3.1. Australia
- 5.3.2. China
- 5.3.3. India
- 5.3.4. Japan
- 5.3.5. Rest of Asia Pacific
- 5.1. Market Analysis, Insights and Forecast - by Type
- 6. Australia Asia Pacific Demand Response Industry Analysis, Insights and Forecast, 2019-2031
- 6.1. Market Analysis, Insights and Forecast - by Type
- 6.1.1. Conventional Demand Response
- 6.1.2. Automated Demand Response
- 6.2. Market Analysis, Insights and Forecast - by Geography
- 6.2.1. Australia
- 6.2.2. China
- 6.2.3. India
- 6.2.4. Japan
- 6.2.5. Rest of Asia-Pacific
- 6.1. Market Analysis, Insights and Forecast - by Type
- 7. China Asia Pacific Demand Response Industry Analysis, Insights and Forecast, 2019-2031
- 7.1. Market Analysis, Insights and Forecast - by Type
- 7.1.1. Conventional Demand Response
- 7.1.2. Automated Demand Response
- 7.2. Market Analysis, Insights and Forecast - by Geography
- 7.2.1. Australia
- 7.2.2. China
- 7.2.3. India
- 7.2.4. Japan
- 7.2.5. Rest of Asia-Pacific
- 7.1. Market Analysis, Insights and Forecast - by Type
- 8. India Asia Pacific Demand Response Industry Analysis, Insights and Forecast, 2019-2031
- 8.1. Market Analysis, Insights and Forecast - by Type
- 8.1.1. Conventional Demand Response
- 8.1.2. Automated Demand Response
- 8.2. Market Analysis, Insights and Forecast - by Geography
- 8.2.1. Australia
- 8.2.2. China
- 8.2.3. India
- 8.2.4. Japan
- 8.2.5. Rest of Asia-Pacific
- 8.1. Market Analysis, Insights and Forecast - by Type
- 9. Japan Asia Pacific Demand Response Industry Analysis, Insights and Forecast, 2019-2031
- 9.1. Market Analysis, Insights and Forecast - by Type
- 9.1.1. Conventional Demand Response
- 9.1.2. Automated Demand Response
- 9.2. Market Analysis, Insights and Forecast - by Geography
- 9.2.1. Australia
- 9.2.2. China
- 9.2.3. India
- 9.2.4. Japan
- 9.2.5. Rest of Asia-Pacific
- 9.1. Market Analysis, Insights and Forecast - by Type
- 10. Rest of Asia Pacific Asia Pacific Demand Response Industry Analysis, Insights and Forecast, 2019-2031
- 10.1. Market Analysis, Insights and Forecast - by Type
- 10.1.1. Conventional Demand Response
- 10.1.2. Automated Demand Response
- 10.2. Market Analysis, Insights and Forecast - by Geography
- 10.2.1. Australia
- 10.2.2. China
- 10.2.3. India
- 10.2.4. Japan
- 10.2.5. Rest of Asia-Pacific
- 10.1. Market Analysis, Insights and Forecast - by Type
- 11. China Asia Pacific Demand Response Industry Analysis, Insights and Forecast, 2019-2031
- 12. Japan Asia Pacific Demand Response Industry Analysis, Insights and Forecast, 2019-2031
- 13. India Asia Pacific Demand Response Industry Analysis, Insights and Forecast, 2019-2031
- 14. South Korea Asia Pacific Demand Response Industry Analysis, Insights and Forecast, 2019-2031
- 15. Taiwan Asia Pacific Demand Response Industry Analysis, Insights and Forecast, 2019-2031
- 16. Australia Asia Pacific Demand Response Industry Analysis, Insights and Forecast, 2019-2031
- 17. Rest of Asia-Pacific Asia Pacific Demand Response Industry Analysis, Insights and Forecast, 2019-2031
- 18. Competitive Analysis
- 18.1. Market Share Analysis 2024
- 18.2. Company Profiles
- 18.2.1 REGEN Energy Inc
- 18.2.1.1. Overview
- 18.2.1.2. Products
- 18.2.1.3. SWOT Analysis
- 18.2.1.4. Recent Developments
- 18.2.1.5. Financials (Based on Availability)
- 18.2.2 ABB Ltd
- 18.2.2.1. Overview
- 18.2.2.2. Products
- 18.2.2.3. SWOT Analysis
- 18.2.2.4. Recent Developments
- 18.2.2.5. Financials (Based on Availability)
- 18.2.3 EnerNOC Inc
- 18.2.3.1. Overview
- 18.2.3.2. Products
- 18.2.3.3. SWOT Analysis
- 18.2.3.4. Recent Developments
- 18.2.3.5. Financials (Based on Availability)
- 18.2.4 Hitachi Ltd
- 18.2.4.1. Overview
- 18.2.4.2. Products
- 18.2.4.3. SWOT Analysis
- 18.2.4.4. Recent Developments
- 18.2.4.5. Financials (Based on Availability)
- 18.2.5 Mitsubishi Electric Corporation
- 18.2.5.1. Overview
- 18.2.5.2. Products
- 18.2.5.3. SWOT Analysis
- 18.2.5.4. Recent Developments
- 18.2.5.5. Financials (Based on Availability)
- 18.2.6 Siemens AG
- 18.2.6.1. Overview
- 18.2.6.2. Products
- 18.2.6.3. SWOT Analysis
- 18.2.6.4. Recent Developments
- 18.2.6.5. Financials (Based on Availability)
- 18.2.7 Schneider Electric SE
- 18.2.7.1. Overview
- 18.2.7.2. Products
- 18.2.7.3. SWOT Analysis
- 18.2.7.4. Recent Developments
- 18.2.7.5. Financials (Based on Availability)
- 18.2.8 Eaton Corporation PLC
- 18.2.8.1. Overview
- 18.2.8.2. Products
- 18.2.8.3. SWOT Analysis
- 18.2.8.4. Recent Developments
- 18.2.8.5. Financials (Based on Availability)
- 18.2.9 Alstom Inc
- 18.2.9.1. Overview
- 18.2.9.2. Products
- 18.2.9.3. SWOT Analysis
- 18.2.9.4. Recent Developments
- 18.2.9.5. Financials (Based on Availability)
- 18.2.10 General Electric Company
- 18.2.10.1. Overview
- 18.2.10.2. Products
- 18.2.10.3. SWOT Analysis
- 18.2.10.4. Recent Developments
- 18.2.10.5. Financials (Based on Availability)
- 18.2.11 Silver Spring Networks
- 18.2.11.1. Overview
- 18.2.11.2. Products
- 18.2.11.3. SWOT Analysis
- 18.2.11.4. Recent Developments
- 18.2.11.5. Financials (Based on Availability)
- 18.2.12 Autogrid Systems Inc
- 18.2.12.1. Overview
- 18.2.12.2. Products
- 18.2.12.3. SWOT Analysis
- 18.2.12.4. Recent Developments
- 18.2.12.5. Financials (Based on Availability)
- 18.2.1 REGEN Energy Inc
List of Figures
- Figure 1: Asia Pacific Demand Response Industry Revenue Breakdown (Million, %) by Product 2024 & 2032
- Figure 2: Asia Pacific Demand Response Industry Share (%) by Company 2024
List of Tables
- Table 1: Asia Pacific Demand Response Industry Revenue Million Forecast, by Region 2019 & 2032
- Table 2: Asia Pacific Demand Response Industry Revenue Million Forecast, by Type 2019 & 2032
- Table 3: Asia Pacific Demand Response Industry Revenue Million Forecast, by Geography 2019 & 2032
- Table 4: Asia Pacific Demand Response Industry Revenue Million Forecast, by Region 2019 & 2032
- Table 5: Asia Pacific Demand Response Industry Revenue Million Forecast, by Country 2019 & 2032
- Table 6: China Asia Pacific Demand Response Industry Revenue (Million) Forecast, by Application 2019 & 2032
- Table 7: Japan Asia Pacific Demand Response Industry Revenue (Million) Forecast, by Application 2019 & 2032
- Table 8: India Asia Pacific Demand Response Industry Revenue (Million) Forecast, by Application 2019 & 2032
- Table 9: South Korea Asia Pacific Demand Response Industry Revenue (Million) Forecast, by Application 2019 & 2032
- Table 10: Taiwan Asia Pacific Demand Response Industry Revenue (Million) Forecast, by Application 2019 & 2032
- Table 11: Australia Asia Pacific Demand Response Industry Revenue (Million) Forecast, by Application 2019 & 2032
- Table 12: Rest of Asia-Pacific Asia Pacific Demand Response Industry Revenue (Million) Forecast, by Application 2019 & 2032
- Table 13: Asia Pacific Demand Response Industry Revenue Million Forecast, by Type 2019 & 2032
- Table 14: Asia Pacific Demand Response Industry Revenue Million Forecast, by Geography 2019 & 2032
- Table 15: Asia Pacific Demand Response Industry Revenue Million Forecast, by Country 2019 & 2032
- Table 16: Asia Pacific Demand Response Industry Revenue Million Forecast, by Type 2019 & 2032
- Table 17: Asia Pacific Demand Response Industry Revenue Million Forecast, by Geography 2019 & 2032
- Table 18: Asia Pacific Demand Response Industry Revenue Million Forecast, by Country 2019 & 2032
- Table 19: Asia Pacific Demand Response Industry Revenue Million Forecast, by Type 2019 & 2032
- Table 20: Asia Pacific Demand Response Industry Revenue Million Forecast, by Geography 2019 & 2032
- Table 21: Asia Pacific Demand Response Industry Revenue Million Forecast, by Country 2019 & 2032
- Table 22: Asia Pacific Demand Response Industry Revenue Million Forecast, by Type 2019 & 2032
- Table 23: Asia Pacific Demand Response Industry Revenue Million Forecast, by Geography 2019 & 2032
- Table 24: Asia Pacific Demand Response Industry Revenue Million Forecast, by Country 2019 & 2032
- Table 25: Asia Pacific Demand Response Industry Revenue Million Forecast, by Type 2019 & 2032
- Table 26: Asia Pacific Demand Response Industry Revenue Million Forecast, by Geography 2019 & 2032
- Table 27: Asia Pacific Demand Response Industry Revenue Million Forecast, by Country 2019 & 2032
Frequently Asked Questions
1. What is the projected Compound Annual Growth Rate (CAGR) of the Asia Pacific Demand Response Industry?
The projected CAGR is approximately > 7.20%.
2. Which companies are prominent players in the Asia Pacific Demand Response Industry?
Key companies in the market include REGEN Energy Inc, ABB Ltd, EnerNOC Inc, Hitachi Ltd, Mitsubishi Electric Corporation, Siemens AG, Schneider Electric SE, Eaton Corporation PLC, Alstom Inc, General Electric Company, Silver Spring Networks, Autogrid Systems Inc.
3. What are the main segments of the Asia Pacific Demand Response Industry?
The market segments include Type, Geography.
4. Can you provide details about the market size?
The market size is estimated to be USD XX Million as of 2022.
5. What are some drivers contributing to market growth?
4.; Growing Demand for Energy As A Service4.; Increasing Adoption of Distributed Energy Generation in Commercial and Industrial Sectors.
6. What are the notable trends driving market growth?
Automated Demand Response System Likely To Drive The Market.
7. Are there any restraints impacting market growth?
4.; Lack of Awareness in Developing Economies and High Technological Costs.
8. Can you provide examples of recent developments in the market?
N/A
9. What pricing options are available for accessing the report?
Pricing options include single-user, multi-user, and enterprise licenses priced at USD 4750, USD 5250, and USD 8750 respectively.
10. Is the market size provided in terms of value or volume?
The market size is provided in terms of value, measured in Million.
11. Are there any specific market keywords associated with the report?
Yes, the market keyword associated with the report is "Asia Pacific Demand Response Industry," which aids in identifying and referencing the specific market segment covered.
12. How do I determine which pricing option suits my needs best?
The pricing options vary based on user requirements and access needs. Individual users may opt for single-user licenses, while businesses requiring broader access may choose multi-user or enterprise licenses for cost-effective access to the report.
13. Are there any additional resources or data provided in the Asia Pacific Demand Response Industry report?
While the report offers comprehensive insights, it's advisable to review the specific contents or supplementary materials provided to ascertain if additional resources or data are available.
14. How can I stay updated on further developments or reports in the Asia Pacific Demand Response Industry?
To stay informed about further developments, trends, and reports in the Asia Pacific Demand Response Industry, consider subscribing to industry newsletters, following relevant companies and organizations, or regularly checking reputable industry news sources and publications.
Methodology
Step 1 - Identification of Relevant Samples Size from Population Database


Step 2 - Approaches for Defining Global Market Size (Value, Volume* & Price*)

Note*: In applicable scenarios
Step 3 - Data Sources
Primary Research
- Web Analytics
- Survey Reports
- Research Institute
- Latest Research Reports
- Opinion Leaders
Secondary Research
- Annual Reports
- White Paper
- Latest Press Release
- Industry Association
- Paid Database
- Investor Presentations

Step 4 - Data Triangulation
Involves using different sources of information in order to increase the validity of a study
These sources are likely to be stakeholders in a program - participants, other researchers, program staff, other community members, and so on.
Then we put all data in single framework & apply various statistical tools to find out the dynamic on the market.
During the analysis stage, feedback from the stakeholder groups would be compared to determine areas of agreement as well as areas of divergence
