

Key Insights
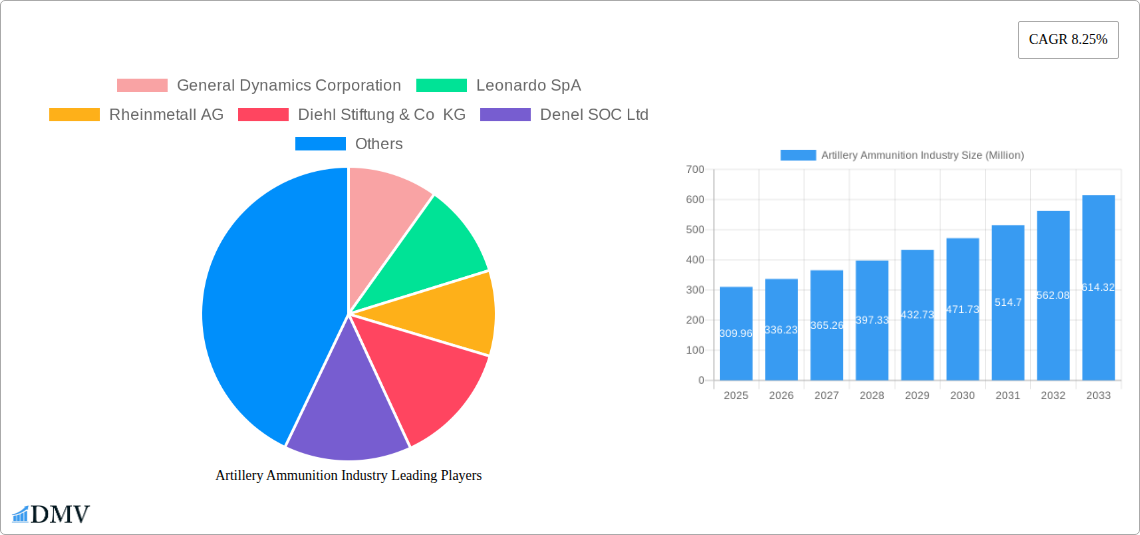
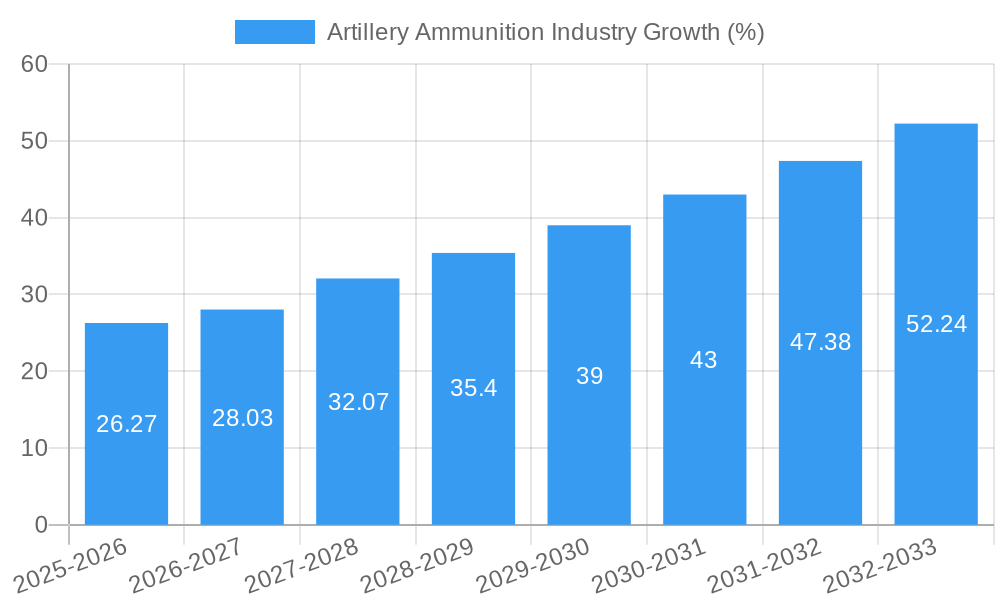
The global artillery ammunition market, valued at $309.96 million in 2025, is projected to experience robust growth, driven by a compound annual growth rate (CAGR) of 8.25% from 2025 to 2033. This expansion is fueled by several key factors. Increased geopolitical instability and regional conflicts are leading to heightened demand for artillery systems and associated ammunition. Modernization efforts by numerous armed forces worldwide, aiming to upgrade their artillery capabilities with more precise and technologically advanced munitions, contribute significantly to market growth. Furthermore, the development and adoption of smart munitions, incorporating features like precision guidance and enhanced lethality, are driving premium pricing and overall market value. The market segmentation reveals a strong preference for calibers above 60mm, reflecting a trend towards larger-caliber artillery shells for increased range and destructive power. Naval forces represent a substantial end-user segment, underscoring the importance of artillery in naval warfare.
The market's growth trajectory, however, is not without challenges. Budgetary constraints faced by some nations, particularly those with developing economies, can limit their procurement of artillery ammunition. Technological advancements, while driving market growth in certain segments, also present challenges for manufacturers needing to adapt and innovate consistently to stay competitive. Furthermore, stringent regulations concerning the production, storage, and transportation of ammunition, aimed at ensuring safety and minimizing environmental impact, can impact operational costs and timelines for manufacturers. Nevertheless, the overall positive outlook for the market is maintained by the persistent demand for artillery ammunition from both established and emerging military powers, suggesting continued market expansion throughout the forecast period. Competition among established players like General Dynamics, Leonardo SpA, and Rheinmetall AG, alongside emerging players, will further shape the market landscape and drive innovation.
Artillery Ammunition Industry Market Report: 2019-2033
This comprehensive report provides a detailed analysis of the global artillery ammunition market, projecting a market value of $XX Million by 2033. It offers invaluable insights for stakeholders, encompassing market trends, technological advancements, leading players, and future opportunities. The report covers the period 2019-2033, with a base year of 2025 and a forecast period of 2025-2033.
Artillery Ammunition Industry Market Composition & Trends
This section delves into the intricate dynamics of the artillery ammunition market, evaluating its concentration, innovation drivers, regulatory landscape, substitute products, and end-user profiles. We analyze mergers and acquisitions (M&A) activities, providing a clear picture of the competitive landscape.
- Market Concentration: The market is moderately concentrated, with key players holding significant market share. The top five players account for approximately XX% of the global market.
- Innovation Catalysts: Advancements in propellants, guidance systems, and smart munitions are driving innovation. The integration of AI and precision-guided munitions is transforming the sector.
- Regulatory Landscape: Stringent export controls and regulations governing the production and trade of artillery ammunition significantly impact market dynamics.
- Substitute Products: While limited, alternative weaponry systems and defensive technologies pose a degree of competitive pressure.
- End-User Profiles: The primary end users include naval forces, ground forces (army, air force, special forces, border security, and federal agencies).
- M&A Activities: The period 2019-2024 witnessed significant M&A activity, with deal values exceeding $XX Million. These acquisitions aim to consolidate market share and expand technological capabilities.
Artillery Ammunition Industry Evolution
This section provides a comprehensive analysis of the artillery ammunition market's evolutionary path, detailing growth trajectories, technological advancements, and evolving consumer demands.
The artillery ammunition market has witnessed a consistent growth trajectory, propelled by escalating geopolitical tensions and increasing defense budgets globally. From 2019 to 2024, the market exhibited a Compound Annual Growth Rate (CAGR) of XX%, reaching $XX Million in 2024. Technological advancements, including the development of precision-guided munitions and smart projectiles, have significantly influenced market growth. The demand for enhanced accuracy, range, and lethality continues to drive innovation. Shifting consumer demands reflect a growing preference for technologically advanced and cost-effective solutions. Furthermore, the increasing adoption of networked artillery systems is expected to further boost market growth in the coming years. The forecast period (2025-2033) projects a CAGR of XX%, driven by sustained demand from both existing and emerging markets.
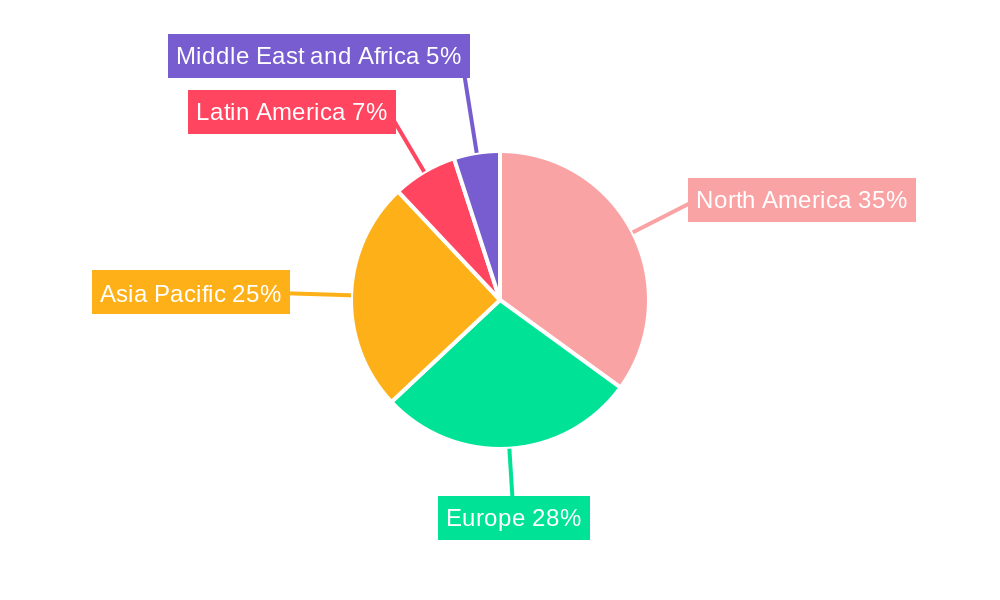
Leading Regions, Countries, or Segments in Artillery Ammunition Industry
This section identifies the dominant regions, countries, and segments within the artillery ammunition market.
- By Caliber Type: The segment above 60mm dominates the market due to its widespread use in large-caliber artillery systems by major global military forces.
- By End User: Ground forces represent the largest end-user segment, driven by significant defense spending and modernization initiatives globally. The Army segment, in particular, constitutes a substantial portion of this demand.
- Key Drivers: Increased defense budgets, modernization programs, and the procurement of advanced artillery systems are key drivers for growth in these dominant segments. Stringent regulatory approvals and international collaborations also influence market dynamics. Investments in research and development, focused on improving accuracy, range, and lethality, further accelerate growth.
Artillery Ammunition Industry Product Innovations
Recent innovations focus on enhanced accuracy, range, and reduced collateral damage. Smart munitions featuring improved guidance systems, extended range projectiles, and reduced-recoil artillery systems are gaining prominence. These innovations aim to enhance battlefield effectiveness and minimize civilian casualties. Unique selling propositions include precise targeting capabilities, advanced fuze technologies, and improved ammunition handling systems.
Propelling Factors for Artillery Ammunition Industry Growth
Several factors contribute to the artillery ammunition market's growth. These include rising defense expenditure worldwide, ongoing geopolitical instability necessitating enhanced defense capabilities, and technological advancements leading to more precise and effective munitions. Furthermore, the increasing adoption of modern artillery systems and the development of smart munitions significantly fuel market expansion.
Obstacles in the Artillery Ammunition Industry Market
The industry faces several challenges. Strict export regulations impose limitations on international trade, while supply chain disruptions caused by geopolitical events can lead to production delays and cost increases. Intense competition among established players and the emergence of new entrants further constrain growth.
Future Opportunities in Artillery Ammunition Industry
Future opportunities lie in the development of more advanced, precise, and cost-effective ammunition. Emerging markets present significant growth potential, particularly in regions with increasing defense budgets. The integration of advanced technologies such as AI and autonomous systems promises further innovation and market expansion.
Major Players in the Artillery Ammunition Industry Ecosystem
- General Dynamics Corporation
- Leonardo SpA
- Rheinmetall AG
- Diehl Stiftung & Co KG
- Denel SOC Ltd
- BAE Systems PLC
- Northrop Grumman
- Raytheon Technologies Corporation
- Global Ordnance
- Nammo AS
- Ukroboronprom
- Saab AB
- ST Engineering
- Nexter group KNDS
Key Developments in Artillery Ammunition Industry Industry
- April 2022: The Armed Forces of Senegal signed a contract with Nexter for 8 105 LG guns and 105 mm ammunition.
- March 2022: The Hungarian Ministry of Defense contracted with Rheinmetall for a multi-million euro ammunition package including 120 mm and 155 mm artillery shells.
Strategic Artillery Ammunition Industry Market Forecast
The artillery ammunition market is poised for significant growth, driven by ongoing technological advancements, increasing defense budgets, and geopolitical uncertainties. The forecast period (2025-2033) anticipates robust expansion, propelled by the demand for advanced munitions and the expansion into new markets. The market's future trajectory is optimistic, with considerable potential for both established and emerging players.
Artillery Ammunition Industry Segmentation
-
1. Caliber Type
- 1.1. 40-60 mm
- 1.2. Above 60 mm
-
2. End User
- 2.1. Naval Forces
- 2.2. Ground F
Artillery Ammunition Industry Segmentation By Geography
-
1. North America
- 1.1. United States
- 1.2. Canada
-
2. Europe
- 2.1. United Kingdom
- 2.2. Germany
- 2.3. France
- 2.4. Russia
- 2.5. Rest of Europe
-
3. Asia Pacific
- 3.1. China
- 3.2. India
- 3.3. Japan
- 3.4. South Korea
- 3.5. Rest of Asia Pacific
-
4. Latin America
- 4.1. Brazil
- 4.2. Rest of Latin America
-
5. Middle East and Africa
- 5.1. United Arab Emirates
- 5.2. Saudi Arabia
- 5.3. Israel
- 5.4. South Africa
- 5.5. Rest of Middle East and Africa
Artillery Ammunition Industry REPORT HIGHLIGHTS
| Aspects | Details |
|---|---|
| Study Period | 2019-2033 |
| Base Year | 2024 |
| Estimated Year | 2025 |
| Forecast Period | 2025-2033 |
| Historical Period | 2019-2024 |
| Growth Rate | CAGR of 8.25% from 2019-2033 |
| Segmentation |
|
Table of Contents
- 1. Introduction
- 1.1. Research Scope
- 1.2. Market Segmentation
- 1.3. Research Methodology
- 1.4. Definitions and Assumptions
- 2. Executive Summary
- 2.1. Introduction
- 3. Market Dynamics
- 3.1. Introduction
- 3.2. Market Drivers
- 3.3. Market Restrains
- 3.4. Market Trends
- 3.4.1. Ground Forces Segment is Projected to Grow with Highest CAGR During the Forecast Period
- 4. Market Factor Analysis
- 4.1. Porters Five Forces
- 4.2. Supply/Value Chain
- 4.3. PESTEL analysis
- 4.4. Market Entropy
- 4.5. Patent/Trademark Analysis
- 5. Global Artillery Ammunition Industry Analysis, Insights and Forecast, 2019-2031
- 5.1. Market Analysis, Insights and Forecast - by Caliber Type
- 5.1.1. 40-60 mm
- 5.1.2. Above 60 mm
- 5.2. Market Analysis, Insights and Forecast - by End User
- 5.2.1. Naval Forces
- 5.2.2. Ground F
- 5.3. Market Analysis, Insights and Forecast - by Region
- 5.3.1. North America
- 5.3.2. Europe
- 5.3.3. Asia Pacific
- 5.3.4. Latin America
- 5.3.5. Middle East and Africa
- 5.1. Market Analysis, Insights and Forecast - by Caliber Type
- 6. North America Artillery Ammunition Industry Analysis, Insights and Forecast, 2019-2031
- 6.1. Market Analysis, Insights and Forecast - by Caliber Type
- 6.1.1. 40-60 mm
- 6.1.2. Above 60 mm
- 6.2. Market Analysis, Insights and Forecast - by End User
- 6.2.1. Naval Forces
- 6.2.2. Ground F
- 6.1. Market Analysis, Insights and Forecast - by Caliber Type
- 7. Europe Artillery Ammunition Industry Analysis, Insights and Forecast, 2019-2031
- 7.1. Market Analysis, Insights and Forecast - by Caliber Type
- 7.1.1. 40-60 mm
- 7.1.2. Above 60 mm
- 7.2. Market Analysis, Insights and Forecast - by End User
- 7.2.1. Naval Forces
- 7.2.2. Ground F
- 7.1. Market Analysis, Insights and Forecast - by Caliber Type
- 8. Asia Pacific Artillery Ammunition Industry Analysis, Insights and Forecast, 2019-2031
- 8.1. Market Analysis, Insights and Forecast - by Caliber Type
- 8.1.1. 40-60 mm
- 8.1.2. Above 60 mm
- 8.2. Market Analysis, Insights and Forecast - by End User
- 8.2.1. Naval Forces
- 8.2.2. Ground F
- 8.1. Market Analysis, Insights and Forecast - by Caliber Type
- 9. Latin America Artillery Ammunition Industry Analysis, Insights and Forecast, 2019-2031
- 9.1. Market Analysis, Insights and Forecast - by Caliber Type
- 9.1.1. 40-60 mm
- 9.1.2. Above 60 mm
- 9.2. Market Analysis, Insights and Forecast - by End User
- 9.2.1. Naval Forces
- 9.2.2. Ground F
- 9.1. Market Analysis, Insights and Forecast - by Caliber Type
- 10. Middle East and Africa Artillery Ammunition Industry Analysis, Insights and Forecast, 2019-2031
- 10.1. Market Analysis, Insights and Forecast - by Caliber Type
- 10.1.1. 40-60 mm
- 10.1.2. Above 60 mm
- 10.2. Market Analysis, Insights and Forecast - by End User
- 10.2.1. Naval Forces
- 10.2.2. Ground F
- 10.1. Market Analysis, Insights and Forecast - by Caliber Type
- 11. North America Artillery Ammunition Industry Analysis, Insights and Forecast, 2019-2031
- 11.1. Market Analysis, Insights and Forecast - By Country/Sub-region
- 11.1.1 United States
- 11.1.2 Canada
- 12. Europe Artillery Ammunition Industry Analysis, Insights and Forecast, 2019-2031
- 12.1. Market Analysis, Insights and Forecast - By Country/Sub-region
- 12.1.1 United Kingdom
- 12.1.2 Germany
- 12.1.3 France
- 12.1.4 Russia
- 12.1.5 Rest of Europe
- 13. Asia Pacific Artillery Ammunition Industry Analysis, Insights and Forecast, 2019-2031
- 13.1. Market Analysis, Insights and Forecast - By Country/Sub-region
- 13.1.1 China
- 13.1.2 India
- 13.1.3 Japan
- 13.1.4 South Korea
- 13.1.5 Rest of Asia Pacific
- 14. Latin America Artillery Ammunition Industry Analysis, Insights and Forecast, 2019-2031
- 14.1. Market Analysis, Insights and Forecast - By Country/Sub-region
- 14.1.1 Brazil
- 14.1.2 Rest of Latin America
- 15. Middle East and Africa Artillery Ammunition Industry Analysis, Insights and Forecast, 2019-2031
- 15.1. Market Analysis, Insights and Forecast - By Country/Sub-region
- 15.1.1 United Arab Emirates
- 15.1.2 Saudi Arabia
- 15.1.3 Israel
- 15.1.4 South Africa
- 15.1.5 Rest of Middle East and Africa
- 16. Competitive Analysis
- 16.1. Global Market Share Analysis 2024
- 16.2. Company Profiles
- 16.2.1 General Dynamics Corporation
- 16.2.1.1. Overview
- 16.2.1.2. Products
- 16.2.1.3. SWOT Analysis
- 16.2.1.4. Recent Developments
- 16.2.1.5. Financials (Based on Availability)
- 16.2.2 Leonardo SpA
- 16.2.2.1. Overview
- 16.2.2.2. Products
- 16.2.2.3. SWOT Analysis
- 16.2.2.4. Recent Developments
- 16.2.2.5. Financials (Based on Availability)
- 16.2.3 Rheinmetall AG
- 16.2.3.1. Overview
- 16.2.3.2. Products
- 16.2.3.3. SWOT Analysis
- 16.2.3.4. Recent Developments
- 16.2.3.5. Financials (Based on Availability)
- 16.2.4 Diehl Stiftung & Co KG
- 16.2.4.1. Overview
- 16.2.4.2. Products
- 16.2.4.3. SWOT Analysis
- 16.2.4.4. Recent Developments
- 16.2.4.5. Financials (Based on Availability)
- 16.2.5 Denel SOC Ltd
- 16.2.5.1. Overview
- 16.2.5.2. Products
- 16.2.5.3. SWOT Analysis
- 16.2.5.4. Recent Developments
- 16.2.5.5. Financials (Based on Availability)
- 16.2.6 BAE Systems PLC
- 16.2.6.1. Overview
- 16.2.6.2. Products
- 16.2.6.3. SWOT Analysis
- 16.2.6.4. Recent Developments
- 16.2.6.5. Financials (Based on Availability)
- 16.2.7 Northrop Grumman
- 16.2.7.1. Overview
- 16.2.7.2. Products
- 16.2.7.3. SWOT Analysis
- 16.2.7.4. Recent Developments
- 16.2.7.5. Financials (Based on Availability)
- 16.2.8 Raytheon Technologies Corporation*List Not Exhaustive
- 16.2.8.1. Overview
- 16.2.8.2. Products
- 16.2.8.3. SWOT Analysis
- 16.2.8.4. Recent Developments
- 16.2.8.5. Financials (Based on Availability)
- 16.2.9 Global Ordnance
- 16.2.9.1. Overview
- 16.2.9.2. Products
- 16.2.9.3. SWOT Analysis
- 16.2.9.4. Recent Developments
- 16.2.9.5. Financials (Based on Availability)
- 16.2.10 Nammo AS
- 16.2.10.1. Overview
- 16.2.10.2. Products
- 16.2.10.3. SWOT Analysis
- 16.2.10.4. Recent Developments
- 16.2.10.5. Financials (Based on Availability)
- 16.2.11 Ukroboronprom
- 16.2.11.1. Overview
- 16.2.11.2. Products
- 16.2.11.3. SWOT Analysis
- 16.2.11.4. Recent Developments
- 16.2.11.5. Financials (Based on Availability)
- 16.2.12 Saab AB
- 16.2.12.1. Overview
- 16.2.12.2. Products
- 16.2.12.3. SWOT Analysis
- 16.2.12.4. Recent Developments
- 16.2.12.5. Financials (Based on Availability)
- 16.2.13 ST Engineering
- 16.2.13.1. Overview
- 16.2.13.2. Products
- 16.2.13.3. SWOT Analysis
- 16.2.13.4. Recent Developments
- 16.2.13.5. Financials (Based on Availability)
- 16.2.14 Nexter group KNDS
- 16.2.14.1. Overview
- 16.2.14.2. Products
- 16.2.14.3. SWOT Analysis
- 16.2.14.4. Recent Developments
- 16.2.14.5. Financials (Based on Availability)
- 16.2.1 General Dynamics Corporation
List of Figures
- Figure 1: Global Artillery Ammunition Industry Revenue Breakdown (Million, %) by Region 2024 & 2032
- Figure 2: North America Artillery Ammunition Industry Revenue (Million), by Country 2024 & 2032
- Figure 3: North America Artillery Ammunition Industry Revenue Share (%), by Country 2024 & 2032
- Figure 4: Europe Artillery Ammunition Industry Revenue (Million), by Country 2024 & 2032
- Figure 5: Europe Artillery Ammunition Industry Revenue Share (%), by Country 2024 & 2032
- Figure 6: Asia Pacific Artillery Ammunition Industry Revenue (Million), by Country 2024 & 2032
- Figure 7: Asia Pacific Artillery Ammunition Industry Revenue Share (%), by Country 2024 & 2032
- Figure 8: Latin America Artillery Ammunition Industry Revenue (Million), by Country 2024 & 2032
- Figure 9: Latin America Artillery Ammunition Industry Revenue Share (%), by Country 2024 & 2032
- Figure 10: Middle East and Africa Artillery Ammunition Industry Revenue (Million), by Country 2024 & 2032
- Figure 11: Middle East and Africa Artillery Ammunition Industry Revenue Share (%), by Country 2024 & 2032
- Figure 12: North America Artillery Ammunition Industry Revenue (Million), by Caliber Type 2024 & 2032
- Figure 13: North America Artillery Ammunition Industry Revenue Share (%), by Caliber Type 2024 & 2032
- Figure 14: North America Artillery Ammunition Industry Revenue (Million), by End User 2024 & 2032
- Figure 15: North America Artillery Ammunition Industry Revenue Share (%), by End User 2024 & 2032
- Figure 16: North America Artillery Ammunition Industry Revenue (Million), by Country 2024 & 2032
- Figure 17: North America Artillery Ammunition Industry Revenue Share (%), by Country 2024 & 2032
- Figure 18: Europe Artillery Ammunition Industry Revenue (Million), by Caliber Type 2024 & 2032
- Figure 19: Europe Artillery Ammunition Industry Revenue Share (%), by Caliber Type 2024 & 2032
- Figure 20: Europe Artillery Ammunition Industry Revenue (Million), by End User 2024 & 2032
- Figure 21: Europe Artillery Ammunition Industry Revenue Share (%), by End User 2024 & 2032
- Figure 22: Europe Artillery Ammunition Industry Revenue (Million), by Country 2024 & 2032
- Figure 23: Europe Artillery Ammunition Industry Revenue Share (%), by Country 2024 & 2032
- Figure 24: Asia Pacific Artillery Ammunition Industry Revenue (Million), by Caliber Type 2024 & 2032
- Figure 25: Asia Pacific Artillery Ammunition Industry Revenue Share (%), by Caliber Type 2024 & 2032
- Figure 26: Asia Pacific Artillery Ammunition Industry Revenue (Million), by End User 2024 & 2032
- Figure 27: Asia Pacific Artillery Ammunition Industry Revenue Share (%), by End User 2024 & 2032
- Figure 28: Asia Pacific Artillery Ammunition Industry Revenue (Million), by Country 2024 & 2032
- Figure 29: Asia Pacific Artillery Ammunition Industry Revenue Share (%), by Country 2024 & 2032
- Figure 30: Latin America Artillery Ammunition Industry Revenue (Million), by Caliber Type 2024 & 2032
- Figure 31: Latin America Artillery Ammunition Industry Revenue Share (%), by Caliber Type 2024 & 2032
- Figure 32: Latin America Artillery Ammunition Industry Revenue (Million), by End User 2024 & 2032
- Figure 33: Latin America Artillery Ammunition Industry Revenue Share (%), by End User 2024 & 2032
- Figure 34: Latin America Artillery Ammunition Industry Revenue (Million), by Country 2024 & 2032
- Figure 35: Latin America Artillery Ammunition Industry Revenue Share (%), by Country 2024 & 2032
- Figure 36: Middle East and Africa Artillery Ammunition Industry Revenue (Million), by Caliber Type 2024 & 2032
- Figure 37: Middle East and Africa Artillery Ammunition Industry Revenue Share (%), by Caliber Type 2024 & 2032
- Figure 38: Middle East and Africa Artillery Ammunition Industry Revenue (Million), by End User 2024 & 2032
- Figure 39: Middle East and Africa Artillery Ammunition Industry Revenue Share (%), by End User 2024 & 2032
- Figure 40: Middle East and Africa Artillery Ammunition Industry Revenue (Million), by Country 2024 & 2032
- Figure 41: Middle East and Africa Artillery Ammunition Industry Revenue Share (%), by Country 2024 & 2032
List of Tables
- Table 1: Global Artillery Ammunition Industry Revenue Million Forecast, by Region 2019 & 2032
- Table 2: Global Artillery Ammunition Industry Revenue Million Forecast, by Caliber Type 2019 & 2032
- Table 3: Global Artillery Ammunition Industry Revenue Million Forecast, by End User 2019 & 2032
- Table 4: Global Artillery Ammunition Industry Revenue Million Forecast, by Region 2019 & 2032
- Table 5: Global Artillery Ammunition Industry Revenue Million Forecast, by Country 2019 & 2032
- Table 6: United States Artillery Ammunition Industry Revenue (Million) Forecast, by Application 2019 & 2032
- Table 7: Canada Artillery Ammunition Industry Revenue (Million) Forecast, by Application 2019 & 2032
- Table 8: Global Artillery Ammunition Industry Revenue Million Forecast, by Country 2019 & 2032
- Table 9: United Kingdom Artillery Ammunition Industry Revenue (Million) Forecast, by Application 2019 & 2032
- Table 10: Germany Artillery Ammunition Industry Revenue (Million) Forecast, by Application 2019 & 2032
- Table 11: France Artillery Ammunition Industry Revenue (Million) Forecast, by Application 2019 & 2032
- Table 12: Russia Artillery Ammunition Industry Revenue (Million) Forecast, by Application 2019 & 2032
- Table 13: Rest of Europe Artillery Ammunition Industry Revenue (Million) Forecast, by Application 2019 & 2032
- Table 14: Global Artillery Ammunition Industry Revenue Million Forecast, by Country 2019 & 2032
- Table 15: China Artillery Ammunition Industry Revenue (Million) Forecast, by Application 2019 & 2032
- Table 16: India Artillery Ammunition Industry Revenue (Million) Forecast, by Application 2019 & 2032
- Table 17: Japan Artillery Ammunition Industry Revenue (Million) Forecast, by Application 2019 & 2032
- Table 18: South Korea Artillery Ammunition Industry Revenue (Million) Forecast, by Application 2019 & 2032
- Table 19: Rest of Asia Pacific Artillery Ammunition Industry Revenue (Million) Forecast, by Application 2019 & 2032
- Table 20: Global Artillery Ammunition Industry Revenue Million Forecast, by Country 2019 & 2032
- Table 21: Brazil Artillery Ammunition Industry Revenue (Million) Forecast, by Application 2019 & 2032
- Table 22: Rest of Latin America Artillery Ammunition Industry Revenue (Million) Forecast, by Application 2019 & 2032
- Table 23: Global Artillery Ammunition Industry Revenue Million Forecast, by Country 2019 & 2032
- Table 24: United Arab Emirates Artillery Ammunition Industry Revenue (Million) Forecast, by Application 2019 & 2032
- Table 25: Saudi Arabia Artillery Ammunition Industry Revenue (Million) Forecast, by Application 2019 & 2032
- Table 26: Israel Artillery Ammunition Industry Revenue (Million) Forecast, by Application 2019 & 2032
- Table 27: South Africa Artillery Ammunition Industry Revenue (Million) Forecast, by Application 2019 & 2032
- Table 28: Rest of Middle East and Africa Artillery Ammunition Industry Revenue (Million) Forecast, by Application 2019 & 2032
- Table 29: Global Artillery Ammunition Industry Revenue Million Forecast, by Caliber Type 2019 & 2032
- Table 30: Global Artillery Ammunition Industry Revenue Million Forecast, by End User 2019 & 2032
- Table 31: Global Artillery Ammunition Industry Revenue Million Forecast, by Country 2019 & 2032
- Table 32: United States Artillery Ammunition Industry Revenue (Million) Forecast, by Application 2019 & 2032
- Table 33: Canada Artillery Ammunition Industry Revenue (Million) Forecast, by Application 2019 & 2032
- Table 34: Global Artillery Ammunition Industry Revenue Million Forecast, by Caliber Type 2019 & 2032
- Table 35: Global Artillery Ammunition Industry Revenue Million Forecast, by End User 2019 & 2032
- Table 36: Global Artillery Ammunition Industry Revenue Million Forecast, by Country 2019 & 2032
- Table 37: United Kingdom Artillery Ammunition Industry Revenue (Million) Forecast, by Application 2019 & 2032
- Table 38: Germany Artillery Ammunition Industry Revenue (Million) Forecast, by Application 2019 & 2032
- Table 39: France Artillery Ammunition Industry Revenue (Million) Forecast, by Application 2019 & 2032
- Table 40: Russia Artillery Ammunition Industry Revenue (Million) Forecast, by Application 2019 & 2032
- Table 41: Rest of Europe Artillery Ammunition Industry Revenue (Million) Forecast, by Application 2019 & 2032
- Table 42: Global Artillery Ammunition Industry Revenue Million Forecast, by Caliber Type 2019 & 2032
- Table 43: Global Artillery Ammunition Industry Revenue Million Forecast, by End User 2019 & 2032
- Table 44: Global Artillery Ammunition Industry Revenue Million Forecast, by Country 2019 & 2032
- Table 45: China Artillery Ammunition Industry Revenue (Million) Forecast, by Application 2019 & 2032
- Table 46: India Artillery Ammunition Industry Revenue (Million) Forecast, by Application 2019 & 2032
- Table 47: Japan Artillery Ammunition Industry Revenue (Million) Forecast, by Application 2019 & 2032
- Table 48: South Korea Artillery Ammunition Industry Revenue (Million) Forecast, by Application 2019 & 2032
- Table 49: Rest of Asia Pacific Artillery Ammunition Industry Revenue (Million) Forecast, by Application 2019 & 2032
- Table 50: Global Artillery Ammunition Industry Revenue Million Forecast, by Caliber Type 2019 & 2032
- Table 51: Global Artillery Ammunition Industry Revenue Million Forecast, by End User 2019 & 2032
- Table 52: Global Artillery Ammunition Industry Revenue Million Forecast, by Country 2019 & 2032
- Table 53: Brazil Artillery Ammunition Industry Revenue (Million) Forecast, by Application 2019 & 2032
- Table 54: Rest of Latin America Artillery Ammunition Industry Revenue (Million) Forecast, by Application 2019 & 2032
- Table 55: Global Artillery Ammunition Industry Revenue Million Forecast, by Caliber Type 2019 & 2032
- Table 56: Global Artillery Ammunition Industry Revenue Million Forecast, by End User 2019 & 2032
- Table 57: Global Artillery Ammunition Industry Revenue Million Forecast, by Country 2019 & 2032
- Table 58: United Arab Emirates Artillery Ammunition Industry Revenue (Million) Forecast, by Application 2019 & 2032
- Table 59: Saudi Arabia Artillery Ammunition Industry Revenue (Million) Forecast, by Application 2019 & 2032
- Table 60: Israel Artillery Ammunition Industry Revenue (Million) Forecast, by Application 2019 & 2032
- Table 61: South Africa Artillery Ammunition Industry Revenue (Million) Forecast, by Application 2019 & 2032
- Table 62: Rest of Middle East and Africa Artillery Ammunition Industry Revenue (Million) Forecast, by Application 2019 & 2032
Frequently Asked Questions
1. What is the projected Compound Annual Growth Rate (CAGR) of the Artillery Ammunition Industry?
The projected CAGR is approximately 8.25%.
2. Which companies are prominent players in the Artillery Ammunition Industry?
Key companies in the market include General Dynamics Corporation, Leonardo SpA, Rheinmetall AG, Diehl Stiftung & Co KG, Denel SOC Ltd, BAE Systems PLC, Northrop Grumman, Raytheon Technologies Corporation*List Not Exhaustive, Global Ordnance, Nammo AS, Ukroboronprom, Saab AB, ST Engineering, Nexter group KNDS.
3. What are the main segments of the Artillery Ammunition Industry?
The market segments include Caliber Type, End User.
4. Can you provide details about the market size?
The market size is estimated to be USD 309.96 Million as of 2022.
5. What are some drivers contributing to market growth?
N/A
6. What are the notable trends driving market growth?
Ground Forces Segment is Projected to Grow with Highest CAGR During the Forecast Period.
7. Are there any restraints impacting market growth?
N/A
8. Can you provide examples of recent developments in the market?
In April 2022, the Armed Forces of Senegal signed a contract with Nexter to supply 8 105 LG guns and 105 mm ammunition. The 105LG is a 105 mm towed artillery gun known for its reliability and unmatched lightness (1,650 kg) and can be used in extreme climates and difficult terrains.
9. What pricing options are available for accessing the report?
Pricing options include single-user, multi-user, and enterprise licenses priced at USD 4750, USD 5250, and USD 8750 respectively.
10. Is the market size provided in terms of value or volume?
The market size is provided in terms of value, measured in Million.
11. Are there any specific market keywords associated with the report?
Yes, the market keyword associated with the report is "Artillery Ammunition Industry," which aids in identifying and referencing the specific market segment covered.
12. How do I determine which pricing option suits my needs best?
The pricing options vary based on user requirements and access needs. Individual users may opt for single-user licenses, while businesses requiring broader access may choose multi-user or enterprise licenses for cost-effective access to the report.
13. Are there any additional resources or data provided in the Artillery Ammunition Industry report?
While the report offers comprehensive insights, it's advisable to review the specific contents or supplementary materials provided to ascertain if additional resources or data are available.
14. How can I stay updated on further developments or reports in the Artillery Ammunition Industry?
To stay informed about further developments, trends, and reports in the Artillery Ammunition Industry, consider subscribing to industry newsletters, following relevant companies and organizations, or regularly checking reputable industry news sources and publications.
Methodology
Step 1 - Identification of Relevant Samples Size from Population Database


Step 2 - Approaches for Defining Global Market Size (Value, Volume* & Price*)

Note*: In applicable scenarios
Step 3 - Data Sources
Primary Research
- Web Analytics
- Survey Reports
- Research Institute
- Latest Research Reports
- Opinion Leaders
Secondary Research
- Annual Reports
- White Paper
- Latest Press Release
- Industry Association
- Paid Database
- Investor Presentations

Step 4 - Data Triangulation
Involves using different sources of information in order to increase the validity of a study
These sources are likely to be stakeholders in a program - participants, other researchers, program staff, other community members, and so on.
Then we put all data in single framework & apply various statistical tools to find out the dynamic on the market.
During the analysis stage, feedback from the stakeholder groups would be compared to determine areas of agreement as well as areas of divergence
