

Key Insights
The global artificial tendons and ligaments market is experiencing robust growth, projected to reach a substantial size driven by several key factors. The rising prevalence of sports-related injuries, particularly knee, foot and ankle, and shoulder injuries, is a major catalyst. An aging population globally further contributes to the increased demand for effective and durable solutions for ligament and tendon repair. Technological advancements in biomaterials, leading to the development of stronger, more biocompatible artificial tendons and ligaments, are also fueling market expansion. Minimally invasive surgical techniques are gaining traction, reducing recovery times and increasing patient preference for these solutions. While the high cost of these procedures and potential complications can act as restraints, the long-term benefits in terms of improved functionality and quality of life outweigh these concerns for many patients. The market is segmented by application (knee, foot & ankle, shoulder, and other injuries), with knee injuries currently dominating the market share due to the high incidence of ACL and meniscus tears. Major players like Mathys AG Bettlach, Arthrex Inc., and Stryker Corporation are actively involved in research and development, driving innovation and competition within the sector. Geographic distribution shows significant market concentration in North America and Europe, owing to advanced healthcare infrastructure and high healthcare expenditure. However, the Asia-Pacific region is poised for significant growth, driven by rising disposable incomes and increasing awareness about advanced surgical procedures.
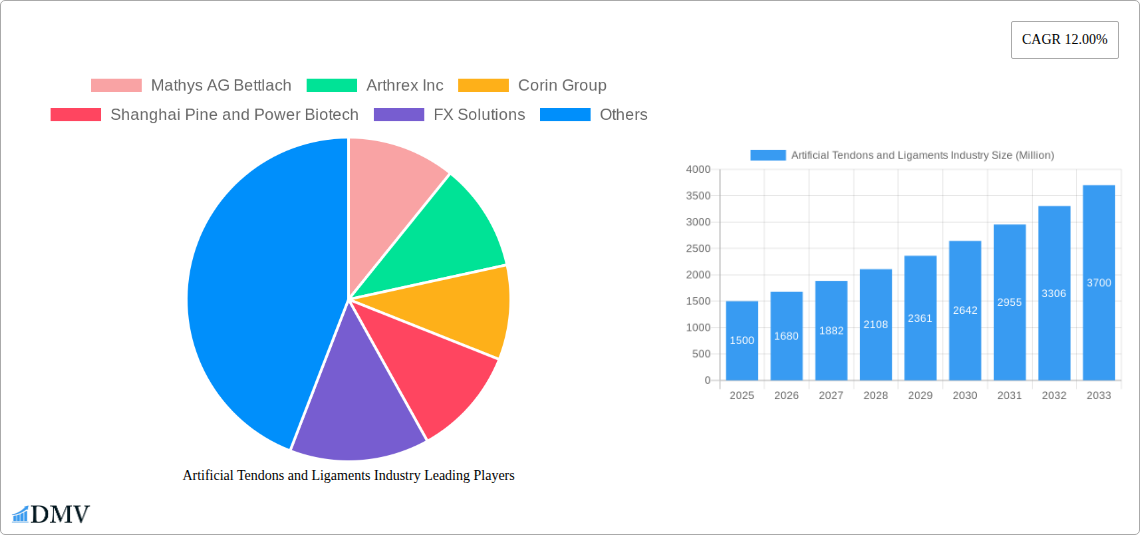
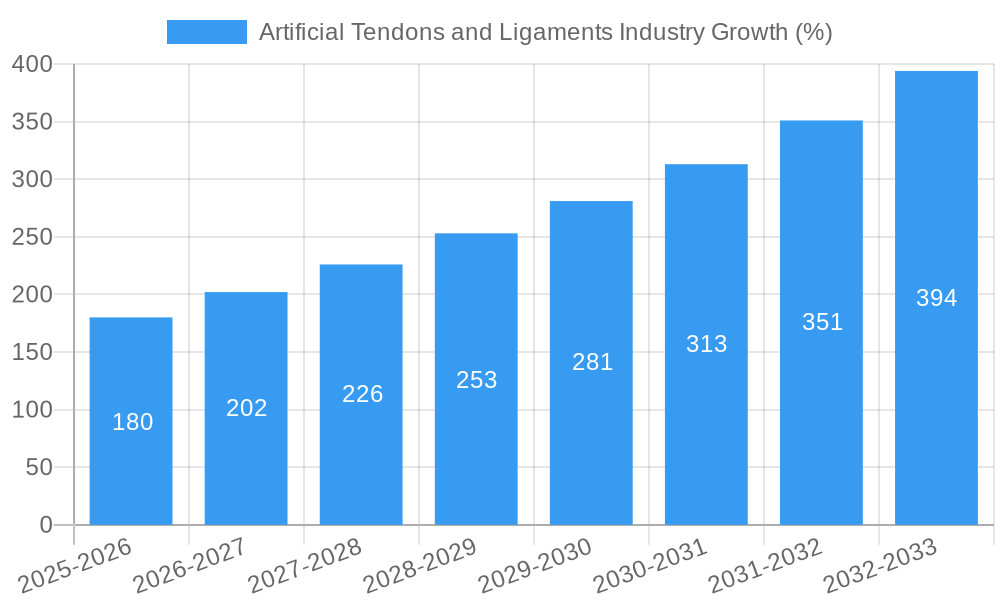
The forecast period (2025-2033) anticipates continued expansion, fueled by the factors mentioned above. The market's CAGR of 12% indicates a substantial increase in market value over the next decade. This growth will be influenced by the introduction of novel biomaterials, the expansion of minimally invasive surgical techniques, and increased adoption in emerging markets. While challenges remain, the long-term outlook for the artificial tendons and ligaments market is extremely positive, with significant potential for growth across various regions and application segments. The continued focus on improving the biocompatibility, strength, and longevity of these implants, along with wider accessibility, will be key drivers in shaping the market's future trajectory.
Artificial Tendons and Ligaments Industry Market Report: 2019-2033
This comprehensive report provides an in-depth analysis of the Artificial Tendons and Ligaments industry, encompassing market size, growth drivers, competitive landscape, and future projections. The study period spans from 2019 to 2033, with 2025 serving as the base and estimated year. The forecast period covers 2025-2033, while the historical period analyzed is 2019-2024. The report is invaluable for stakeholders seeking to understand the evolving dynamics of this crucial sector within the medical device market. The global market is expected to reach xx Million by 2033, representing a significant growth trajectory.
Artificial Tendons and Ligaments Industry Market Composition & Trends
This section delves into the intricate composition of the artificial tendons and ligaments market, analyzing key factors that shape its current trajectory and future prospects. Market concentration is moderately high, with several key players holding significant market share, but a growing number of smaller companies contributing to innovation. The market size in 2025 is estimated at xx Million.
Market Share Distribution: While precise figures are proprietary to the full report, Stryker Corporation, Arthrex Inc., and Mathys AG Bettlach are expected to hold the largest market shares, accounting for approximately xx% collectively in 2025. The remaining share is distributed among a diverse group of companies, including smaller players and regional manufacturers.
Innovation Catalysts: The demand for minimally invasive surgical techniques and improved patient outcomes fuels significant investment in R&D. Biocompatible materials, advanced manufacturing processes (such as 3D printing), and improved surgical techniques are driving product innovation.
Regulatory Landscape: Stringent regulatory approvals (like FDA clearance in the US) are crucial for market entry and growth. Regulatory bodies influence product development, safety standards, and market access, presenting both challenges and opportunities.
Substitute Products: Autologous tissue grafts represent a primary substitute, but their limitations (donor site morbidity, limited availability) create a strong market for artificial alternatives. The cost-effectiveness and improved performance of artificial products are key advantages.
End-User Profiles: The primary end-users are orthopedic surgeons, hospitals, and ambulatory surgical centers. Growing aging populations and increased incidence of sports-related injuries are driving demand.
M&A Activities: The market has witnessed several mergers and acquisitions in recent years, with deal values averaging xx Million per transaction (this is a conservative estimate, exact data is within the full report). These activities reflect the strategic importance of the market and the pursuit of greater market share and technological capabilities.
Artificial Tendons and Ligaments Industry Industry Evolution
The artificial tendons and ligaments market has experienced significant evolution, driven by technological advancements and shifting consumer demands. The historical period (2019-2024) showed a Compound Annual Growth Rate (CAGR) of xx%, reflecting a consistently expanding market. This growth is projected to continue, with a forecast CAGR of xx% from 2025 to 2033. The market size is anticipated to reach xx Million by 2033.
Technological advancements, such as the development of biocompatible and highly durable materials (e.g., PLLA, PCL), have significantly improved the performance and longevity of artificial tendons and ligaments. Minimally invasive surgical techniques have also increased adoption rates, reducing recovery times and improving patient satisfaction. The shift toward value-based healthcare, with an emphasis on cost-effectiveness and long-term outcomes, also plays a significant role, pushing innovation in material science and manufacturing processes.
The increasing prevalence of sports injuries, particularly among younger populations, combined with the growing geriatric population susceptible to age-related tendon and ligament degeneration, fuels consistent market expansion. Consumer demand is driven by the desire for improved functionality, faster recovery times, and a better quality of life.
Leading Regions, Countries, or Segments in Artificial Tendons and Ligaments Industry
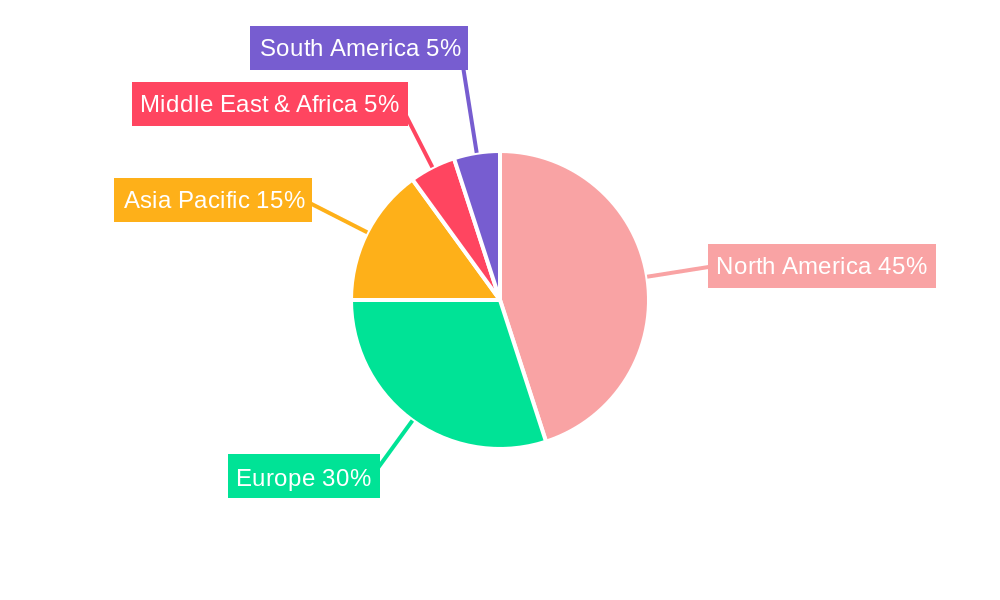
North America currently holds the largest market share, driven by high healthcare expenditure, a robust regulatory framework supporting innovation, and a significant number of surgical procedures performed annually. This dominance is further supported by substantial investments in medical research and technology and the strong presence of major industry players.
- Key Drivers for North America Dominance:
- High healthcare expenditure and insurance coverage.
- Significant investment in medical research and development.
- Strong regulatory framework supporting medical device innovation.
- High prevalence of sports-related injuries and an aging population.
- Presence of major industry players like Arthrex, Stryker, and others.
Knee injuries represent the largest segment by application, primarily due to the high incidence of ACL tears, meniscus injuries, and other knee-related problems, particularly in sports and active individuals.
- Key Drivers for Knee Injuries Segment Dominance:
- High incidence of ACL and other knee ligament injuries.
- Increased participation in sports and strenuous activities.
- Growing awareness of minimally invasive surgical techniques.
- Improved product performance and patient outcomes.
While North America currently leads, the Asia-Pacific region exhibits significant growth potential due to rising disposable incomes, increasing healthcare awareness, and a rapidly expanding middle class.
Artificial Tendons and Ligaments Industry Product Innovations
Recent innovations focus on biomimicry, using materials and designs that closely replicate the natural properties of tendons and ligaments. This includes advancements in biocompatible polymers, improved fixation techniques, and the integration of intelligent materials for enhanced performance and healing. Products like CoNextions TR Tendon Repair System and Medtronic's LigaPASS 2.0 exemplify the industry's commitment to delivering improved patient outcomes and enhanced surgical experiences through innovative designs and materials. Unique selling propositions center around improved biocompatibility, strength, and reduced complications.
Propelling Factors for Artificial Tendons and Ligaments Industry Growth
Technological advancements in biomaterials and surgical techniques are primary growth drivers. The rising prevalence of sports injuries and age-related degenerative conditions fuels increased demand. Favorable regulatory environments that expedite the approval of innovative products further stimulate market expansion. Furthermore, economic factors such as growing disposable incomes and increased healthcare expenditure, particularly in developing economies, propel market growth.
Obstacles in the Artificial Tendons and Ligaments Industry Market
Stringent regulatory hurdles and lengthy approval processes can delay product launches and impact market entry. Supply chain disruptions, particularly concerning raw materials and manufacturing capacity, can lead to production delays and price increases. Intense competition among established players and emerging companies adds pressure on pricing and margins, affecting profitability.
Future Opportunities in Artificial Tendons and Ligaments Industry
Emerging markets in developing economies present significant growth potential. Advancements in bioprinting and regenerative medicine offer opportunities for developing personalized and more effective solutions. The development of smart implants with integrated sensors for monitoring healing progress and providing real-time data represents a promising area for future innovation.
Major Players in the Artificial Tendons and Ligaments Industry Ecosystem
- Mathys AG Bettlach
- Arthrex Inc
- Corin Group
- Shanghai Pine and Power Biotech
- FX Solutions
- Orthomed S A S
- Cousin Biotech
- LARS
- Stryker Corporation
- Neoligaments
- FH Orthopedics
Key Developments in Artificial Tendons and Ligaments Industry Industry
- July 2022: CoNextions Inc. received FDA clearance for its CoNextions TR Tendon Repair System.
- June 2022: Medtronic received FDA 510(k) clearance and breakthrough device designation for its LigaPASS 2.0 ligament augmentation system.
Strategic Artificial Tendons and Ligaments Industry Market Forecast
The artificial tendons and ligaments market is poised for continued growth, driven by technological advancements, a growing need for effective solutions for musculoskeletal injuries, and an expanding global population. The market's future success hinges on ongoing innovation in biomaterials, minimally invasive surgical techniques, and personalized medicine. The increasing prevalence of sports injuries and an aging global population will sustain demand for advanced and effective artificial tendons and ligaments for years to come.
Artificial Tendons and Ligaments Industry Segmentation
-
1. Application
- 1.1. Knee Injuries
- 1.2. Foot and Ankle Injuries
- 1.3. Shoulder Injuries
- 1.4. Others
-
2. End-User
- 2.1. Hospitals
- 2.2. Ambulatory Surgery Centers
- 2.3. Orthopedic Clinics
Artificial Tendons and Ligaments Industry Segmentation By Geography
-
1. North America
- 1.1. United States
- 1.2. Canada
- 1.3. Mexico
-
2. Europe
- 2.1. Germany
- 2.2. United Kingdom
- 2.3. France
- 2.4. Italy
- 2.5. Spain
- 2.6. Rest of Europe
-
3. Asia Pacific
- 3.1. China
- 3.2. Japan
- 3.3. India
- 3.4. Australia
- 3.5. South Korea
- 3.6. Rest of Asia Pacific
-
4. Middle East and Africa
- 4.1. GCC
- 4.2. South Africa
- 4.3. Rest of Middle East and Africa
-
5. South America
- 5.1. Brazil
- 5.2. Argentina
- 5.3. Rest of South America
Artificial Tendons and Ligaments Industry REPORT HIGHLIGHTS
| Aspects | Details |
|---|---|
| Study Period | 2019-2033 |
| Base Year | 2024 |
| Estimated Year | 2025 |
| Forecast Period | 2025-2033 |
| Historical Period | 2019-2024 |
| Growth Rate | CAGR of 12.00% from 2019-2033 |
| Segmentation |
|
Table of Contents
- 1. Introduction
- 1.1. Research Scope
- 1.2. Market Segmentation
- 1.3. Research Methodology
- 1.4. Definitions and Assumptions
- 2. Executive Summary
- 2.1. Introduction
- 3. Market Dynamics
- 3.1. Introduction
- 3.2. Market Drivers
- 3.2.1. Increased Global Incidence of Sports Injuries; Increased Preference for Minimally Invasive Surgical Procedures
- 3.3. Market Restrains
- 3.3.1. High Prices of Procedures and Unfavorable Reimbursement Policies Across Major Markets; Unwillingness of Healthcare Providers to Use Artificial Tendons and Ligaments
- 3.4. Market Trends
- 3.4.1. Knee Injuries Segment is Expected to Hold the Largest Market Share in the Artificial Tendons and Ligaments Market
- 4. Market Factor Analysis
- 4.1. Porters Five Forces
- 4.2. Supply/Value Chain
- 4.3. PESTEL analysis
- 4.4. Market Entropy
- 4.5. Patent/Trademark Analysis
- 5. Global Artificial Tendons and Ligaments Industry Analysis, Insights and Forecast, 2019-2031
- 5.1. Market Analysis, Insights and Forecast - by Application
- 5.1.1. Knee Injuries
- 5.1.2. Foot and Ankle Injuries
- 5.1.3. Shoulder Injuries
- 5.1.4. Others
- 5.2. Market Analysis, Insights and Forecast - by End-User
- 5.2.1. Hospitals
- 5.2.2. Ambulatory Surgery Centers
- 5.2.3. Orthopedic Clinics
- 5.3. Market Analysis, Insights and Forecast - by Region
- 5.3.1. North America
- 5.3.2. Europe
- 5.3.3. Asia Pacific
- 5.3.4. Middle East and Africa
- 5.3.5. South America
- 5.1. Market Analysis, Insights and Forecast - by Application
- 6. North America Artificial Tendons and Ligaments Industry Analysis, Insights and Forecast, 2019-2031
- 6.1. Market Analysis, Insights and Forecast - by Application
- 6.1.1. Knee Injuries
- 6.1.2. Foot and Ankle Injuries
- 6.1.3. Shoulder Injuries
- 6.1.4. Others
- 6.2. Market Analysis, Insights and Forecast - by End-User
- 6.2.1. Hospitals
- 6.2.2. Ambulatory Surgery Centers
- 6.2.3. Orthopedic Clinics
- 6.1. Market Analysis, Insights and Forecast - by Application
- 7. Europe Artificial Tendons and Ligaments Industry Analysis, Insights and Forecast, 2019-2031
- 7.1. Market Analysis, Insights and Forecast - by Application
- 7.1.1. Knee Injuries
- 7.1.2. Foot and Ankle Injuries
- 7.1.3. Shoulder Injuries
- 7.1.4. Others
- 7.2. Market Analysis, Insights and Forecast - by End-User
- 7.2.1. Hospitals
- 7.2.2. Ambulatory Surgery Centers
- 7.2.3. Orthopedic Clinics
- 7.1. Market Analysis, Insights and Forecast - by Application
- 8. Asia Pacific Artificial Tendons and Ligaments Industry Analysis, Insights and Forecast, 2019-2031
- 8.1. Market Analysis, Insights and Forecast - by Application
- 8.1.1. Knee Injuries
- 8.1.2. Foot and Ankle Injuries
- 8.1.3. Shoulder Injuries
- 8.1.4. Others
- 8.2. Market Analysis, Insights and Forecast - by End-User
- 8.2.1. Hospitals
- 8.2.2. Ambulatory Surgery Centers
- 8.2.3. Orthopedic Clinics
- 8.1. Market Analysis, Insights and Forecast - by Application
- 9. Middle East and Africa Artificial Tendons and Ligaments Industry Analysis, Insights and Forecast, 2019-2031
- 9.1. Market Analysis, Insights and Forecast - by Application
- 9.1.1. Knee Injuries
- 9.1.2. Foot and Ankle Injuries
- 9.1.3. Shoulder Injuries
- 9.1.4. Others
- 9.2. Market Analysis, Insights and Forecast - by End-User
- 9.2.1. Hospitals
- 9.2.2. Ambulatory Surgery Centers
- 9.2.3. Orthopedic Clinics
- 9.1. Market Analysis, Insights and Forecast - by Application
- 10. South America Artificial Tendons and Ligaments Industry Analysis, Insights and Forecast, 2019-2031
- 10.1. Market Analysis, Insights and Forecast - by Application
- 10.1.1. Knee Injuries
- 10.1.2. Foot and Ankle Injuries
- 10.1.3. Shoulder Injuries
- 10.1.4. Others
- 10.2. Market Analysis, Insights and Forecast - by End-User
- 10.2.1. Hospitals
- 10.2.2. Ambulatory Surgery Centers
- 10.2.3. Orthopedic Clinics
- 10.1. Market Analysis, Insights and Forecast - by Application
- 11. North America Artificial Tendons and Ligaments Industry Analysis, Insights and Forecast, 2019-2031
- 11.1. Market Analysis, Insights and Forecast - By Country/Sub-region
- 11.1.1 United States
- 11.1.2 Canada
- 11.1.3 Mexico
- 12. Europe Artificial Tendons and Ligaments Industry Analysis, Insights and Forecast, 2019-2031
- 12.1. Market Analysis, Insights and Forecast - By Country/Sub-region
- 12.1.1 Germany
- 12.1.2 United Kingdom
- 12.1.3 France
- 12.1.4 Italy
- 12.1.5 Spain
- 12.1.6 Rest of Europe
- 13. Asia Pacific Artificial Tendons and Ligaments Industry Analysis, Insights and Forecast, 2019-2031
- 13.1. Market Analysis, Insights and Forecast - By Country/Sub-region
- 13.1.1 China
- 13.1.2 Japan
- 13.1.3 India
- 13.1.4 Australia
- 13.1.5 South Korea
- 13.1.6 Rest of Asia Pacific
- 14. Middle East and Africa Artificial Tendons and Ligaments Industry Analysis, Insights and Forecast, 2019-2031
- 14.1. Market Analysis, Insights and Forecast - By Country/Sub-region
- 14.1.1 GCC
- 14.1.2 South Africa
- 14.1.3 Rest of Middle East and Africa
- 15. South America Artificial Tendons and Ligaments Industry Analysis, Insights and Forecast, 2019-2031
- 15.1. Market Analysis, Insights and Forecast - By Country/Sub-region
- 15.1.1 Brazil
- 15.1.2 Argentina
- 15.1.3 Rest of South America
- 16. Competitive Analysis
- 16.1. Global Market Share Analysis 2024
- 16.2. Company Profiles
- 16.2.1 Mathys AG Bettlach
- 16.2.1.1. Overview
- 16.2.1.2. Products
- 16.2.1.3. SWOT Analysis
- 16.2.1.4. Recent Developments
- 16.2.1.5. Financials (Based on Availability)
- 16.2.2 Arthrex Inc
- 16.2.2.1. Overview
- 16.2.2.2. Products
- 16.2.2.3. SWOT Analysis
- 16.2.2.4. Recent Developments
- 16.2.2.5. Financials (Based on Availability)
- 16.2.3 Corin Group
- 16.2.3.1. Overview
- 16.2.3.2. Products
- 16.2.3.3. SWOT Analysis
- 16.2.3.4. Recent Developments
- 16.2.3.5. Financials (Based on Availability)
- 16.2.4 Shanghai Pine and Power Biotech
- 16.2.4.1. Overview
- 16.2.4.2. Products
- 16.2.4.3. SWOT Analysis
- 16.2.4.4. Recent Developments
- 16.2.4.5. Financials (Based on Availability)
- 16.2.5 FX Solutions
- 16.2.5.1. Overview
- 16.2.5.2. Products
- 16.2.5.3. SWOT Analysis
- 16.2.5.4. Recent Developments
- 16.2.5.5. Financials (Based on Availability)
- 16.2.6 Orthomed S A S
- 16.2.6.1. Overview
- 16.2.6.2. Products
- 16.2.6.3. SWOT Analysis
- 16.2.6.4. Recent Developments
- 16.2.6.5. Financials (Based on Availability)
- 16.2.7 Cousin Biotech
- 16.2.7.1. Overview
- 16.2.7.2. Products
- 16.2.7.3. SWOT Analysis
- 16.2.7.4. Recent Developments
- 16.2.7.5. Financials (Based on Availability)
- 16.2.8 LARS
- 16.2.8.1. Overview
- 16.2.8.2. Products
- 16.2.8.3. SWOT Analysis
- 16.2.8.4. Recent Developments
- 16.2.8.5. Financials (Based on Availability)
- 16.2.9 Stryker Corporation
- 16.2.9.1. Overview
- 16.2.9.2. Products
- 16.2.9.3. SWOT Analysis
- 16.2.9.4. Recent Developments
- 16.2.9.5. Financials (Based on Availability)
- 16.2.10 Neoligaments
- 16.2.10.1. Overview
- 16.2.10.2. Products
- 16.2.10.3. SWOT Analysis
- 16.2.10.4. Recent Developments
- 16.2.10.5. Financials (Based on Availability)
- 16.2.11 FH Orthopedics
- 16.2.11.1. Overview
- 16.2.11.2. Products
- 16.2.11.3. SWOT Analysis
- 16.2.11.4. Recent Developments
- 16.2.11.5. Financials (Based on Availability)
- 16.2.1 Mathys AG Bettlach
List of Figures
- Figure 1: Global Artificial Tendons and Ligaments Industry Revenue Breakdown (Million, %) by Region 2024 & 2032
- Figure 2: Global Artificial Tendons and Ligaments Industry Volume Breakdown (K Unit, %) by Region 2024 & 2032
- Figure 3: North America Artificial Tendons and Ligaments Industry Revenue (Million), by Country 2024 & 2032
- Figure 4: North America Artificial Tendons and Ligaments Industry Volume (K Unit), by Country 2024 & 2032
- Figure 5: North America Artificial Tendons and Ligaments Industry Revenue Share (%), by Country 2024 & 2032
- Figure 6: North America Artificial Tendons and Ligaments Industry Volume Share (%), by Country 2024 & 2032
- Figure 7: Europe Artificial Tendons and Ligaments Industry Revenue (Million), by Country 2024 & 2032
- Figure 8: Europe Artificial Tendons and Ligaments Industry Volume (K Unit), by Country 2024 & 2032
- Figure 9: Europe Artificial Tendons and Ligaments Industry Revenue Share (%), by Country 2024 & 2032
- Figure 10: Europe Artificial Tendons and Ligaments Industry Volume Share (%), by Country 2024 & 2032
- Figure 11: Asia Pacific Artificial Tendons and Ligaments Industry Revenue (Million), by Country 2024 & 2032
- Figure 12: Asia Pacific Artificial Tendons and Ligaments Industry Volume (K Unit), by Country 2024 & 2032
- Figure 13: Asia Pacific Artificial Tendons and Ligaments Industry Revenue Share (%), by Country 2024 & 2032
- Figure 14: Asia Pacific Artificial Tendons and Ligaments Industry Volume Share (%), by Country 2024 & 2032
- Figure 15: Middle East and Africa Artificial Tendons and Ligaments Industry Revenue (Million), by Country 2024 & 2032
- Figure 16: Middle East and Africa Artificial Tendons and Ligaments Industry Volume (K Unit), by Country 2024 & 2032
- Figure 17: Middle East and Africa Artificial Tendons and Ligaments Industry Revenue Share (%), by Country 2024 & 2032
- Figure 18: Middle East and Africa Artificial Tendons and Ligaments Industry Volume Share (%), by Country 2024 & 2032
- Figure 19: South America Artificial Tendons and Ligaments Industry Revenue (Million), by Country 2024 & 2032
- Figure 20: South America Artificial Tendons and Ligaments Industry Volume (K Unit), by Country 2024 & 2032
- Figure 21: South America Artificial Tendons and Ligaments Industry Revenue Share (%), by Country 2024 & 2032
- Figure 22: South America Artificial Tendons and Ligaments Industry Volume Share (%), by Country 2024 & 2032
- Figure 23: North America Artificial Tendons and Ligaments Industry Revenue (Million), by Application 2024 & 2032
- Figure 24: North America Artificial Tendons and Ligaments Industry Volume (K Unit), by Application 2024 & 2032
- Figure 25: North America Artificial Tendons and Ligaments Industry Revenue Share (%), by Application 2024 & 2032
- Figure 26: North America Artificial Tendons and Ligaments Industry Volume Share (%), by Application 2024 & 2032
- Figure 27: North America Artificial Tendons and Ligaments Industry Revenue (Million), by End-User 2024 & 2032
- Figure 28: North America Artificial Tendons and Ligaments Industry Volume (K Unit), by End-User 2024 & 2032
- Figure 29: North America Artificial Tendons and Ligaments Industry Revenue Share (%), by End-User 2024 & 2032
- Figure 30: North America Artificial Tendons and Ligaments Industry Volume Share (%), by End-User 2024 & 2032
- Figure 31: North America Artificial Tendons and Ligaments Industry Revenue (Million), by Country 2024 & 2032
- Figure 32: North America Artificial Tendons and Ligaments Industry Volume (K Unit), by Country 2024 & 2032
- Figure 33: North America Artificial Tendons and Ligaments Industry Revenue Share (%), by Country 2024 & 2032
- Figure 34: North America Artificial Tendons and Ligaments Industry Volume Share (%), by Country 2024 & 2032
- Figure 35: Europe Artificial Tendons and Ligaments Industry Revenue (Million), by Application 2024 & 2032
- Figure 36: Europe Artificial Tendons and Ligaments Industry Volume (K Unit), by Application 2024 & 2032
- Figure 37: Europe Artificial Tendons and Ligaments Industry Revenue Share (%), by Application 2024 & 2032
- Figure 38: Europe Artificial Tendons and Ligaments Industry Volume Share (%), by Application 2024 & 2032
- Figure 39: Europe Artificial Tendons and Ligaments Industry Revenue (Million), by End-User 2024 & 2032
- Figure 40: Europe Artificial Tendons and Ligaments Industry Volume (K Unit), by End-User 2024 & 2032
- Figure 41: Europe Artificial Tendons and Ligaments Industry Revenue Share (%), by End-User 2024 & 2032
- Figure 42: Europe Artificial Tendons and Ligaments Industry Volume Share (%), by End-User 2024 & 2032
- Figure 43: Europe Artificial Tendons and Ligaments Industry Revenue (Million), by Country 2024 & 2032
- Figure 44: Europe Artificial Tendons and Ligaments Industry Volume (K Unit), by Country 2024 & 2032
- Figure 45: Europe Artificial Tendons and Ligaments Industry Revenue Share (%), by Country 2024 & 2032
- Figure 46: Europe Artificial Tendons and Ligaments Industry Volume Share (%), by Country 2024 & 2032
- Figure 47: Asia Pacific Artificial Tendons and Ligaments Industry Revenue (Million), by Application 2024 & 2032
- Figure 48: Asia Pacific Artificial Tendons and Ligaments Industry Volume (K Unit), by Application 2024 & 2032
- Figure 49: Asia Pacific Artificial Tendons and Ligaments Industry Revenue Share (%), by Application 2024 & 2032
- Figure 50: Asia Pacific Artificial Tendons and Ligaments Industry Volume Share (%), by Application 2024 & 2032
- Figure 51: Asia Pacific Artificial Tendons and Ligaments Industry Revenue (Million), by End-User 2024 & 2032
- Figure 52: Asia Pacific Artificial Tendons and Ligaments Industry Volume (K Unit), by End-User 2024 & 2032
- Figure 53: Asia Pacific Artificial Tendons and Ligaments Industry Revenue Share (%), by End-User 2024 & 2032
- Figure 54: Asia Pacific Artificial Tendons and Ligaments Industry Volume Share (%), by End-User 2024 & 2032
- Figure 55: Asia Pacific Artificial Tendons and Ligaments Industry Revenue (Million), by Country 2024 & 2032
- Figure 56: Asia Pacific Artificial Tendons and Ligaments Industry Volume (K Unit), by Country 2024 & 2032
- Figure 57: Asia Pacific Artificial Tendons and Ligaments Industry Revenue Share (%), by Country 2024 & 2032
- Figure 58: Asia Pacific Artificial Tendons and Ligaments Industry Volume Share (%), by Country 2024 & 2032
- Figure 59: Middle East and Africa Artificial Tendons and Ligaments Industry Revenue (Million), by Application 2024 & 2032
- Figure 60: Middle East and Africa Artificial Tendons and Ligaments Industry Volume (K Unit), by Application 2024 & 2032
- Figure 61: Middle East and Africa Artificial Tendons and Ligaments Industry Revenue Share (%), by Application 2024 & 2032
- Figure 62: Middle East and Africa Artificial Tendons and Ligaments Industry Volume Share (%), by Application 2024 & 2032
- Figure 63: Middle East and Africa Artificial Tendons and Ligaments Industry Revenue (Million), by End-User 2024 & 2032
- Figure 64: Middle East and Africa Artificial Tendons and Ligaments Industry Volume (K Unit), by End-User 2024 & 2032
- Figure 65: Middle East and Africa Artificial Tendons and Ligaments Industry Revenue Share (%), by End-User 2024 & 2032
- Figure 66: Middle East and Africa Artificial Tendons and Ligaments Industry Volume Share (%), by End-User 2024 & 2032
- Figure 67: Middle East and Africa Artificial Tendons and Ligaments Industry Revenue (Million), by Country 2024 & 2032
- Figure 68: Middle East and Africa Artificial Tendons and Ligaments Industry Volume (K Unit), by Country 2024 & 2032
- Figure 69: Middle East and Africa Artificial Tendons and Ligaments Industry Revenue Share (%), by Country 2024 & 2032
- Figure 70: Middle East and Africa Artificial Tendons and Ligaments Industry Volume Share (%), by Country 2024 & 2032
- Figure 71: South America Artificial Tendons and Ligaments Industry Revenue (Million), by Application 2024 & 2032
- Figure 72: South America Artificial Tendons and Ligaments Industry Volume (K Unit), by Application 2024 & 2032
- Figure 73: South America Artificial Tendons and Ligaments Industry Revenue Share (%), by Application 2024 & 2032
- Figure 74: South America Artificial Tendons and Ligaments Industry Volume Share (%), by Application 2024 & 2032
- Figure 75: South America Artificial Tendons and Ligaments Industry Revenue (Million), by End-User 2024 & 2032
- Figure 76: South America Artificial Tendons and Ligaments Industry Volume (K Unit), by End-User 2024 & 2032
- Figure 77: South America Artificial Tendons and Ligaments Industry Revenue Share (%), by End-User 2024 & 2032
- Figure 78: South America Artificial Tendons and Ligaments Industry Volume Share (%), by End-User 2024 & 2032
- Figure 79: South America Artificial Tendons and Ligaments Industry Revenue (Million), by Country 2024 & 2032
- Figure 80: South America Artificial Tendons and Ligaments Industry Volume (K Unit), by Country 2024 & 2032
- Figure 81: South America Artificial Tendons and Ligaments Industry Revenue Share (%), by Country 2024 & 2032
- Figure 82: South America Artificial Tendons and Ligaments Industry Volume Share (%), by Country 2024 & 2032
List of Tables
- Table 1: Global Artificial Tendons and Ligaments Industry Revenue Million Forecast, by Region 2019 & 2032
- Table 2: Global Artificial Tendons and Ligaments Industry Volume K Unit Forecast, by Region 2019 & 2032
- Table 3: Global Artificial Tendons and Ligaments Industry Revenue Million Forecast, by Application 2019 & 2032
- Table 4: Global Artificial Tendons and Ligaments Industry Volume K Unit Forecast, by Application 2019 & 2032
- Table 5: Global Artificial Tendons and Ligaments Industry Revenue Million Forecast, by End-User 2019 & 2032
- Table 6: Global Artificial Tendons and Ligaments Industry Volume K Unit Forecast, by End-User 2019 & 2032
- Table 7: Global Artificial Tendons and Ligaments Industry Revenue Million Forecast, by Region 2019 & 2032
- Table 8: Global Artificial Tendons and Ligaments Industry Volume K Unit Forecast, by Region 2019 & 2032
- Table 9: Global Artificial Tendons and Ligaments Industry Revenue Million Forecast, by Country 2019 & 2032
- Table 10: Global Artificial Tendons and Ligaments Industry Volume K Unit Forecast, by Country 2019 & 2032
- Table 11: United States Artificial Tendons and Ligaments Industry Revenue (Million) Forecast, by Application 2019 & 2032
- Table 12: United States Artificial Tendons and Ligaments Industry Volume (K Unit) Forecast, by Application 2019 & 2032
- Table 13: Canada Artificial Tendons and Ligaments Industry Revenue (Million) Forecast, by Application 2019 & 2032
- Table 14: Canada Artificial Tendons and Ligaments Industry Volume (K Unit) Forecast, by Application 2019 & 2032
- Table 15: Mexico Artificial Tendons and Ligaments Industry Revenue (Million) Forecast, by Application 2019 & 2032
- Table 16: Mexico Artificial Tendons and Ligaments Industry Volume (K Unit) Forecast, by Application 2019 & 2032
- Table 17: Global Artificial Tendons and Ligaments Industry Revenue Million Forecast, by Country 2019 & 2032
- Table 18: Global Artificial Tendons and Ligaments Industry Volume K Unit Forecast, by Country 2019 & 2032
- Table 19: Germany Artificial Tendons and Ligaments Industry Revenue (Million) Forecast, by Application 2019 & 2032
- Table 20: Germany Artificial Tendons and Ligaments Industry Volume (K Unit) Forecast, by Application 2019 & 2032
- Table 21: United Kingdom Artificial Tendons and Ligaments Industry Revenue (Million) Forecast, by Application 2019 & 2032
- Table 22: United Kingdom Artificial Tendons and Ligaments Industry Volume (K Unit) Forecast, by Application 2019 & 2032
- Table 23: France Artificial Tendons and Ligaments Industry Revenue (Million) Forecast, by Application 2019 & 2032
- Table 24: France Artificial Tendons and Ligaments Industry Volume (K Unit) Forecast, by Application 2019 & 2032
- Table 25: Italy Artificial Tendons and Ligaments Industry Revenue (Million) Forecast, by Application 2019 & 2032
- Table 26: Italy Artificial Tendons and Ligaments Industry Volume (K Unit) Forecast, by Application 2019 & 2032
- Table 27: Spain Artificial Tendons and Ligaments Industry Revenue (Million) Forecast, by Application 2019 & 2032
- Table 28: Spain Artificial Tendons and Ligaments Industry Volume (K Unit) Forecast, by Application 2019 & 2032
- Table 29: Rest of Europe Artificial Tendons and Ligaments Industry Revenue (Million) Forecast, by Application 2019 & 2032
- Table 30: Rest of Europe Artificial Tendons and Ligaments Industry Volume (K Unit) Forecast, by Application 2019 & 2032
- Table 31: Global Artificial Tendons and Ligaments Industry Revenue Million Forecast, by Country 2019 & 2032
- Table 32: Global Artificial Tendons and Ligaments Industry Volume K Unit Forecast, by Country 2019 & 2032
- Table 33: China Artificial Tendons and Ligaments Industry Revenue (Million) Forecast, by Application 2019 & 2032
- Table 34: China Artificial Tendons and Ligaments Industry Volume (K Unit) Forecast, by Application 2019 & 2032
- Table 35: Japan Artificial Tendons and Ligaments Industry Revenue (Million) Forecast, by Application 2019 & 2032
- Table 36: Japan Artificial Tendons and Ligaments Industry Volume (K Unit) Forecast, by Application 2019 & 2032
- Table 37: India Artificial Tendons and Ligaments Industry Revenue (Million) Forecast, by Application 2019 & 2032
- Table 38: India Artificial Tendons and Ligaments Industry Volume (K Unit) Forecast, by Application 2019 & 2032
- Table 39: Australia Artificial Tendons and Ligaments Industry Revenue (Million) Forecast, by Application 2019 & 2032
- Table 40: Australia Artificial Tendons and Ligaments Industry Volume (K Unit) Forecast, by Application 2019 & 2032
- Table 41: South Korea Artificial Tendons and Ligaments Industry Revenue (Million) Forecast, by Application 2019 & 2032
- Table 42: South Korea Artificial Tendons and Ligaments Industry Volume (K Unit) Forecast, by Application 2019 & 2032
- Table 43: Rest of Asia Pacific Artificial Tendons and Ligaments Industry Revenue (Million) Forecast, by Application 2019 & 2032
- Table 44: Rest of Asia Pacific Artificial Tendons and Ligaments Industry Volume (K Unit) Forecast, by Application 2019 & 2032
- Table 45: Global Artificial Tendons and Ligaments Industry Revenue Million Forecast, by Country 2019 & 2032
- Table 46: Global Artificial Tendons and Ligaments Industry Volume K Unit Forecast, by Country 2019 & 2032
- Table 47: GCC Artificial Tendons and Ligaments Industry Revenue (Million) Forecast, by Application 2019 & 2032
- Table 48: GCC Artificial Tendons and Ligaments Industry Volume (K Unit) Forecast, by Application 2019 & 2032
- Table 49: South Africa Artificial Tendons and Ligaments Industry Revenue (Million) Forecast, by Application 2019 & 2032
- Table 50: South Africa Artificial Tendons and Ligaments Industry Volume (K Unit) Forecast, by Application 2019 & 2032
- Table 51: Rest of Middle East and Africa Artificial Tendons and Ligaments Industry Revenue (Million) Forecast, by Application 2019 & 2032
- Table 52: Rest of Middle East and Africa Artificial Tendons and Ligaments Industry Volume (K Unit) Forecast, by Application 2019 & 2032
- Table 53: Global Artificial Tendons and Ligaments Industry Revenue Million Forecast, by Country 2019 & 2032
- Table 54: Global Artificial Tendons and Ligaments Industry Volume K Unit Forecast, by Country 2019 & 2032
- Table 55: Brazil Artificial Tendons and Ligaments Industry Revenue (Million) Forecast, by Application 2019 & 2032
- Table 56: Brazil Artificial Tendons and Ligaments Industry Volume (K Unit) Forecast, by Application 2019 & 2032
- Table 57: Argentina Artificial Tendons and Ligaments Industry Revenue (Million) Forecast, by Application 2019 & 2032
- Table 58: Argentina Artificial Tendons and Ligaments Industry Volume (K Unit) Forecast, by Application 2019 & 2032
- Table 59: Rest of South America Artificial Tendons and Ligaments Industry Revenue (Million) Forecast, by Application 2019 & 2032
- Table 60: Rest of South America Artificial Tendons and Ligaments Industry Volume (K Unit) Forecast, by Application 2019 & 2032
- Table 61: Global Artificial Tendons and Ligaments Industry Revenue Million Forecast, by Application 2019 & 2032
- Table 62: Global Artificial Tendons and Ligaments Industry Volume K Unit Forecast, by Application 2019 & 2032
- Table 63: Global Artificial Tendons and Ligaments Industry Revenue Million Forecast, by End-User 2019 & 2032
- Table 64: Global Artificial Tendons and Ligaments Industry Volume K Unit Forecast, by End-User 2019 & 2032
- Table 65: Global Artificial Tendons and Ligaments Industry Revenue Million Forecast, by Country 2019 & 2032
- Table 66: Global Artificial Tendons and Ligaments Industry Volume K Unit Forecast, by Country 2019 & 2032
- Table 67: United States Artificial Tendons and Ligaments Industry Revenue (Million) Forecast, by Application 2019 & 2032
- Table 68: United States Artificial Tendons and Ligaments Industry Volume (K Unit) Forecast, by Application 2019 & 2032
- Table 69: Canada Artificial Tendons and Ligaments Industry Revenue (Million) Forecast, by Application 2019 & 2032
- Table 70: Canada Artificial Tendons and Ligaments Industry Volume (K Unit) Forecast, by Application 2019 & 2032
- Table 71: Mexico Artificial Tendons and Ligaments Industry Revenue (Million) Forecast, by Application 2019 & 2032
- Table 72: Mexico Artificial Tendons and Ligaments Industry Volume (K Unit) Forecast, by Application 2019 & 2032
- Table 73: Global Artificial Tendons and Ligaments Industry Revenue Million Forecast, by Application 2019 & 2032
- Table 74: Global Artificial Tendons and Ligaments Industry Volume K Unit Forecast, by Application 2019 & 2032
- Table 75: Global Artificial Tendons and Ligaments Industry Revenue Million Forecast, by End-User 2019 & 2032
- Table 76: Global Artificial Tendons and Ligaments Industry Volume K Unit Forecast, by End-User 2019 & 2032
- Table 77: Global Artificial Tendons and Ligaments Industry Revenue Million Forecast, by Country 2019 & 2032
- Table 78: Global Artificial Tendons and Ligaments Industry Volume K Unit Forecast, by Country 2019 & 2032
- Table 79: Germany Artificial Tendons and Ligaments Industry Revenue (Million) Forecast, by Application 2019 & 2032
- Table 80: Germany Artificial Tendons and Ligaments Industry Volume (K Unit) Forecast, by Application 2019 & 2032
- Table 81: United Kingdom Artificial Tendons and Ligaments Industry Revenue (Million) Forecast, by Application 2019 & 2032
- Table 82: United Kingdom Artificial Tendons and Ligaments Industry Volume (K Unit) Forecast, by Application 2019 & 2032
- Table 83: France Artificial Tendons and Ligaments Industry Revenue (Million) Forecast, by Application 2019 & 2032
- Table 84: France Artificial Tendons and Ligaments Industry Volume (K Unit) Forecast, by Application 2019 & 2032
- Table 85: Italy Artificial Tendons and Ligaments Industry Revenue (Million) Forecast, by Application 2019 & 2032
- Table 86: Italy Artificial Tendons and Ligaments Industry Volume (K Unit) Forecast, by Application 2019 & 2032
- Table 87: Spain Artificial Tendons and Ligaments Industry Revenue (Million) Forecast, by Application 2019 & 2032
- Table 88: Spain Artificial Tendons and Ligaments Industry Volume (K Unit) Forecast, by Application 2019 & 2032
- Table 89: Rest of Europe Artificial Tendons and Ligaments Industry Revenue (Million) Forecast, by Application 2019 & 2032
- Table 90: Rest of Europe Artificial Tendons and Ligaments Industry Volume (K Unit) Forecast, by Application 2019 & 2032
- Table 91: Global Artificial Tendons and Ligaments Industry Revenue Million Forecast, by Application 2019 & 2032
- Table 92: Global Artificial Tendons and Ligaments Industry Volume K Unit Forecast, by Application 2019 & 2032
- Table 93: Global Artificial Tendons and Ligaments Industry Revenue Million Forecast, by End-User 2019 & 2032
- Table 94: Global Artificial Tendons and Ligaments Industry Volume K Unit Forecast, by End-User 2019 & 2032
- Table 95: Global Artificial Tendons and Ligaments Industry Revenue Million Forecast, by Country 2019 & 2032
- Table 96: Global Artificial Tendons and Ligaments Industry Volume K Unit Forecast, by Country 2019 & 2032
- Table 97: China Artificial Tendons and Ligaments Industry Revenue (Million) Forecast, by Application 2019 & 2032
- Table 98: China Artificial Tendons and Ligaments Industry Volume (K Unit) Forecast, by Application 2019 & 2032
- Table 99: Japan Artificial Tendons and Ligaments Industry Revenue (Million) Forecast, by Application 2019 & 2032
- Table 100: Japan Artificial Tendons and Ligaments Industry Volume (K Unit) Forecast, by Application 2019 & 2032
- Table 101: India Artificial Tendons and Ligaments Industry Revenue (Million) Forecast, by Application 2019 & 2032
- Table 102: India Artificial Tendons and Ligaments Industry Volume (K Unit) Forecast, by Application 2019 & 2032
- Table 103: Australia Artificial Tendons and Ligaments Industry Revenue (Million) Forecast, by Application 2019 & 2032
- Table 104: Australia Artificial Tendons and Ligaments Industry Volume (K Unit) Forecast, by Application 2019 & 2032
- Table 105: South Korea Artificial Tendons and Ligaments Industry Revenue (Million) Forecast, by Application 2019 & 2032
- Table 106: South Korea Artificial Tendons and Ligaments Industry Volume (K Unit) Forecast, by Application 2019 & 2032
- Table 107: Rest of Asia Pacific Artificial Tendons and Ligaments Industry Revenue (Million) Forecast, by Application 2019 & 2032
- Table 108: Rest of Asia Pacific Artificial Tendons and Ligaments Industry Volume (K Unit) Forecast, by Application 2019 & 2032
- Table 109: Global Artificial Tendons and Ligaments Industry Revenue Million Forecast, by Application 2019 & 2032
- Table 110: Global Artificial Tendons and Ligaments Industry Volume K Unit Forecast, by Application 2019 & 2032
- Table 111: Global Artificial Tendons and Ligaments Industry Revenue Million Forecast, by End-User 2019 & 2032
- Table 112: Global Artificial Tendons and Ligaments Industry Volume K Unit Forecast, by End-User 2019 & 2032
- Table 113: Global Artificial Tendons and Ligaments Industry Revenue Million Forecast, by Country 2019 & 2032
- Table 114: Global Artificial Tendons and Ligaments Industry Volume K Unit Forecast, by Country 2019 & 2032
- Table 115: GCC Artificial Tendons and Ligaments Industry Revenue (Million) Forecast, by Application 2019 & 2032
- Table 116: GCC Artificial Tendons and Ligaments Industry Volume (K Unit) Forecast, by Application 2019 & 2032
- Table 117: South Africa Artificial Tendons and Ligaments Industry Revenue (Million) Forecast, by Application 2019 & 2032
- Table 118: South Africa Artificial Tendons and Ligaments Industry Volume (K Unit) Forecast, by Application 2019 & 2032
- Table 119: Rest of Middle East and Africa Artificial Tendons and Ligaments Industry Revenue (Million) Forecast, by Application 2019 & 2032
- Table 120: Rest of Middle East and Africa Artificial Tendons and Ligaments Industry Volume (K Unit) Forecast, by Application 2019 & 2032
- Table 121: Global Artificial Tendons and Ligaments Industry Revenue Million Forecast, by Application 2019 & 2032
- Table 122: Global Artificial Tendons and Ligaments Industry Volume K Unit Forecast, by Application 2019 & 2032
- Table 123: Global Artificial Tendons and Ligaments Industry Revenue Million Forecast, by End-User 2019 & 2032
- Table 124: Global Artificial Tendons and Ligaments Industry Volume K Unit Forecast, by End-User 2019 & 2032
- Table 125: Global Artificial Tendons and Ligaments Industry Revenue Million Forecast, by Country 2019 & 2032
- Table 126: Global Artificial Tendons and Ligaments Industry Volume K Unit Forecast, by Country 2019 & 2032
- Table 127: Brazil Artificial Tendons and Ligaments Industry Revenue (Million) Forecast, by Application 2019 & 2032
- Table 128: Brazil Artificial Tendons and Ligaments Industry Volume (K Unit) Forecast, by Application 2019 & 2032
- Table 129: Argentina Artificial Tendons and Ligaments Industry Revenue (Million) Forecast, by Application 2019 & 2032
- Table 130: Argentina Artificial Tendons and Ligaments Industry Volume (K Unit) Forecast, by Application 2019 & 2032
- Table 131: Rest of South America Artificial Tendons and Ligaments Industry Revenue (Million) Forecast, by Application 2019 & 2032
- Table 132: Rest of South America Artificial Tendons and Ligaments Industry Volume (K Unit) Forecast, by Application 2019 & 2032
Frequently Asked Questions
1. What is the projected Compound Annual Growth Rate (CAGR) of the Artificial Tendons and Ligaments Industry?
The projected CAGR is approximately 12.00%.
2. Which companies are prominent players in the Artificial Tendons and Ligaments Industry?
Key companies in the market include Mathys AG Bettlach, Arthrex Inc, Corin Group, Shanghai Pine and Power Biotech, FX Solutions, Orthomed S A S, Cousin Biotech, LARS, Stryker Corporation, Neoligaments, FH Orthopedics.
3. What are the main segments of the Artificial Tendons and Ligaments Industry?
The market segments include Application, End-User.
4. Can you provide details about the market size?
The market size is estimated to be USD XX Million as of 2022.
5. What are some drivers contributing to market growth?
Increased Global Incidence of Sports Injuries; Increased Preference for Minimally Invasive Surgical Procedures.
6. What are the notable trends driving market growth?
Knee Injuries Segment is Expected to Hold the Largest Market Share in the Artificial Tendons and Ligaments Market.
7. Are there any restraints impacting market growth?
High Prices of Procedures and Unfavorable Reimbursement Policies Across Major Markets; Unwillingness of Healthcare Providers to Use Artificial Tendons and Ligaments.
8. Can you provide examples of recent developments in the market?
In July 2022, CoNextions Inc announced that CoNextions TR Tendon Repair System has received FDA Clearance. The CoNextions TR device is another example of CoNextions' commitment to providing innovative and advanced solutions for soft-tissue repair leading to improved patient outcomes and surgeon experience.
9. What pricing options are available for accessing the report?
Pricing options include single-user, multi-user, and enterprise licenses priced at USD 4750, USD 5250, and USD 8750 respectively.
10. Is the market size provided in terms of value or volume?
The market size is provided in terms of value, measured in Million and volume, measured in K Unit.
11. Are there any specific market keywords associated with the report?
Yes, the market keyword associated with the report is "Artificial Tendons and Ligaments Industry," which aids in identifying and referencing the specific market segment covered.
12. How do I determine which pricing option suits my needs best?
The pricing options vary based on user requirements and access needs. Individual users may opt for single-user licenses, while businesses requiring broader access may choose multi-user or enterprise licenses for cost-effective access to the report.
13. Are there any additional resources or data provided in the Artificial Tendons and Ligaments Industry report?
While the report offers comprehensive insights, it's advisable to review the specific contents or supplementary materials provided to ascertain if additional resources or data are available.
14. How can I stay updated on further developments or reports in the Artificial Tendons and Ligaments Industry?
To stay informed about further developments, trends, and reports in the Artificial Tendons and Ligaments Industry, consider subscribing to industry newsletters, following relevant companies and organizations, or regularly checking reputable industry news sources and publications.
Methodology
Step 1 - Identification of Relevant Samples Size from Population Database


Step 2 - Approaches for Defining Global Market Size (Value, Volume* & Price*)

Note*: In applicable scenarios
Step 3 - Data Sources
Primary Research
- Web Analytics
- Survey Reports
- Research Institute
- Latest Research Reports
- Opinion Leaders
Secondary Research
- Annual Reports
- White Paper
- Latest Press Release
- Industry Association
- Paid Database
- Investor Presentations

Step 4 - Data Triangulation
Involves using different sources of information in order to increase the validity of a study
These sources are likely to be stakeholders in a program - participants, other researchers, program staff, other community members, and so on.
Then we put all data in single framework & apply various statistical tools to find out the dynamic on the market.
During the analysis stage, feedback from the stakeholder groups would be compared to determine areas of agreement as well as areas of divergence
