

Key Insights
The Asia-Pacific (APAC) water automation and instrumentation market is experiencing robust growth, driven by increasing urbanization, industrialization, and stringent government regulations aimed at improving water resource management and minimizing water loss. The market's expansion is fueled by the rising adoption of advanced technologies like SCADA, PLC, and HMI systems for efficient water treatment and distribution. Furthermore, the growing need for precise water quality monitoring and leak detection is bolstering demand for sophisticated instrumentation solutions, including pressure, level, and flow sensors. Significant investments in infrastructure development projects across countries like China, India, and Australia are further contributing to market expansion. The chemical, manufacturing, and food and beverage industries are key end-users, relying heavily on automation and instrumentation for operational efficiency and regulatory compliance. While the initial investment costs associated with implementing these technologies can be a restraint, the long-term benefits of improved water management, reduced operational expenses, and minimized environmental impact are driving wider adoption. Competitive dynamics within the market are intense, with both established international players and regional companies vying for market share. This competition fosters innovation and offers consumers a wide range of solutions catering to diverse needs and budgets. The market's future growth trajectory is projected to remain positive, supported by continuous technological advancements and ongoing government initiatives promoting sustainable water management practices across the APAC region.
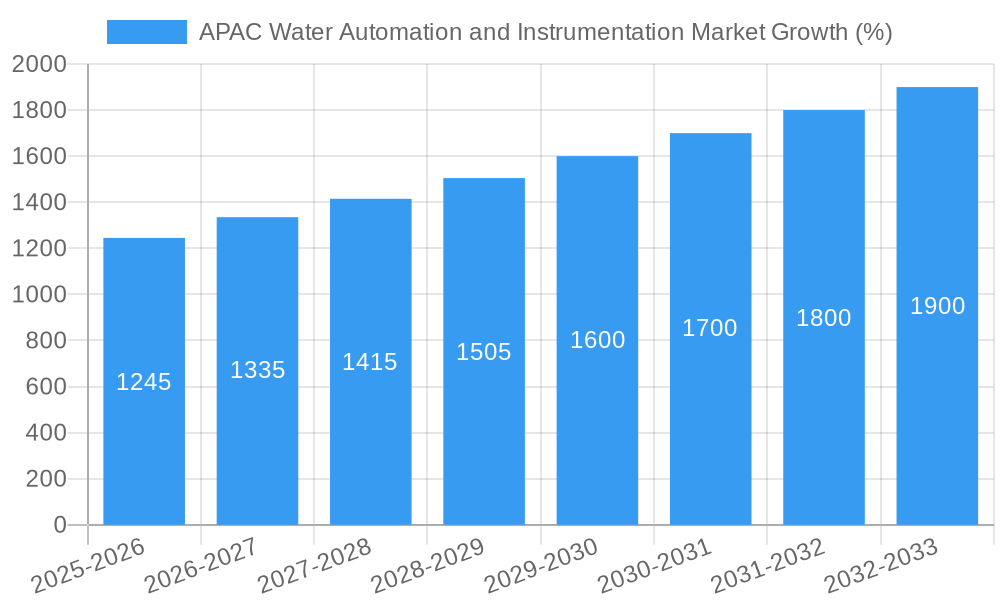
The projected CAGR of 8.10% indicates substantial growth opportunities in the APAC water automation and instrumentation market over the forecast period (2025-2033). This growth is expected to be unevenly distributed across different segments and countries. China and India, owing to their large populations and rapid industrialization, are likely to dominate the market, while countries like Australia and Japan will contribute significantly due to their well-established infrastructure and focus on technological advancements. The segment comprising water automation solutions (DCS, SCADA, PLC, HMI) is anticipated to experience higher growth compared to the instrumentation segment, as the overall automation of water management systems gains momentum. However, the instrumentation segment will continue to grow steadily due to the increasing need for precise and real-time water quality monitoring. Future growth will be influenced by factors like technological innovation (e.g., IoT integration, AI-driven analytics), government policies promoting water conservation, and the increasing awareness of water scarcity issues.

APAC Water Automation and Instrumentation Market: A Comprehensive Report (2019-2033)
This insightful report provides a detailed analysis of the Asia-Pacific (APAC) Water Automation and Instrumentation Market, offering a comprehensive overview of market trends, growth drivers, challenges, and future opportunities. The report covers the period from 2019 to 2033, with a focus on the estimated year 2025 and a forecast period of 2025-2033. The market is segmented by Water Automation Solutions (DCS, SCADA, PLC, HMI, Other), Water Instrumentation Solutions (Pressure Transmitter, Level Transmitter, Temperature Transmitter, Liquid Analyzers, Gas Analyzers, Leakage Detection Systems, Flow Sensors/Transmitters, Other), and End-User Industries (Chemical, Manufacturing, Food and Beverages), across key countries including Australia, China, Japan, India, and the Rest of Asia Pacific. The report’s findings are crucial for stakeholders seeking to understand market dynamics and capitalize on growth prospects within this rapidly evolving sector. The market is estimated to be worth xx Million in 2025.
APAC Water Automation and Instrumentation Market Composition & Trends
This section delves into the competitive landscape, analyzing market concentration, innovation drivers, regulatory frameworks, and substitute products within the APAC water automation and instrumentation market. The report examines the impact of mergers and acquisitions (M&A) activities, providing insights into deal values and their influence on market share distribution.
- Market Concentration: The APAC water automation and instrumentation market exhibits a moderately concentrated structure, with key players such as NALCO, Phoenix Contact, Endress + Hauser Pvt Ltd, GE Corporation, KROHNE LT, MJK Automation, Siemens AG, Schneider Electric SE, Emerson Electric, ABB Group, Rockwell Automation Inc, Yokogawa Electric Corporation, Mitsubishi Motors Corporation, and Eurotek India holding significant market share. The exact distribution is detailed within the report.
- Innovation Catalysts: Stringent environmental regulations and the growing need for efficient water management are driving innovation in automation and instrumentation technologies. The development of advanced sensors, cloud-based solutions, and AI-powered analytics is transforming the sector.
- Regulatory Landscape: Government initiatives promoting water conservation and infrastructure development significantly influence market growth. Variations in regulatory frameworks across APAC countries are analyzed in detail.
- Substitute Products: While direct substitutes are limited, the cost-effectiveness of certain traditional methods may pose a competitive challenge.
- M&A Activities: The report includes a detailed analysis of recent M&A activities, including deal values (xx Million) and their impact on market consolidation. This section provides a detailed timeline of significant M&A events within the last five years.
- End-User Profiles: A qualitative analysis of end-user industries (chemical, manufacturing, food and beverages) highlights their specific needs and adoption rates of water automation and instrumentation technologies.
APAC Water Automation and Instrumentation Market Industry Evolution
This section provides a comprehensive analysis of the APAC water automation and instrumentation market's growth trajectory, technological advancements, and evolving consumer demands over the study period (2019-2024). The market witnessed a Compound Annual Growth Rate (CAGR) of xx% during this period, driven primarily by increasing government investments in water infrastructure and the rising adoption of advanced automation technologies. The transition towards smart water management solutions, driven by the need for improved efficiency and reduced water loss, is a key factor. Technological advancements, such as the integration of IoT (Internet of Things) sensors and Artificial Intelligence (AI), have enabled real-time monitoring and predictive maintenance, leading to significant improvements in operational efficiency and cost savings. Changing consumer demands, particularly an increased focus on sustainability and environmental protection, have further fueled market growth. Specific data points on growth rates and adoption metrics are presented within the full report.
Leading Regions, Countries, or Segments in APAC Water Automation and Instrumentation Market
This section identifies the dominant regions, countries, and segments within the APAC water automation and instrumentation market.
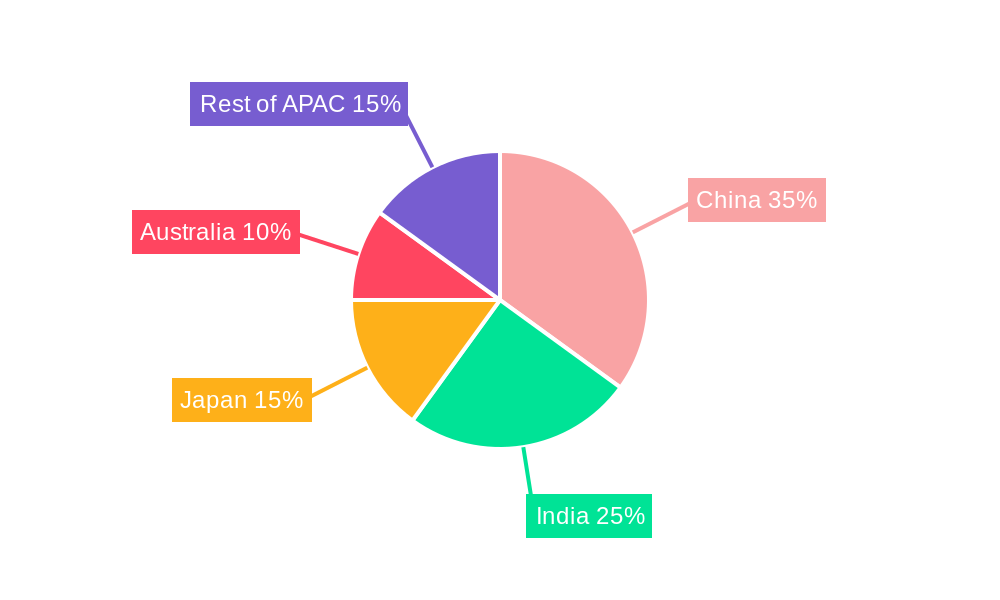
- Dominant Region: China is identified as the leading region, driven by substantial investments in water infrastructure, rapid industrialization, and a growing emphasis on water conservation.
- Dominant Country: China's dominance is further emphasized at the country level, owing to its vast size, economic growth, and substantial government support for water infrastructure projects. India is another key country showing significant potential for growth.
- Dominant Segments:
- Water Automation Solutions: SCADA systems hold a significant market share due to their ability to manage complex water distribution networks efficiently. PLC systems are also witnessing high adoption, driven by their cost-effectiveness and ease of implementation in smaller-scale applications.
- Water Instrumentation Solutions: Pressure transmitters and level transmitters dominate this segment, owing to their essential role in monitoring and controlling water pressure and levels within water treatment plants and distribution networks.
- End-User Industry: The chemical and manufacturing sectors exhibit the highest adoption rates of water automation and instrumentation technologies due to their stringent requirements for precise water management and quality control.
Key Drivers:
- Significant Government Investments: Various APAC governments are investing heavily in upgrading water infrastructure, creating significant demand for advanced automation and instrumentation solutions.
- Stringent Environmental Regulations: Growing environmental concerns and stricter regulations are pushing industries to adopt more efficient and sustainable water management practices.
- Technological Advancements: Continuous innovation in sensor technology, data analytics, and cloud-based solutions is driving the adoption of advanced automation and instrumentation technologies.
APAC Water Automation and Instrumentation Market Product Innovations
Recent innovations include the development of smart sensors with enhanced accuracy and reliability, advanced analytics platforms for real-time data processing and decision-making, and cloud-based solutions for remote monitoring and control. These advancements offer improved operational efficiency, reduced water loss, and enhanced sustainability. Unique selling propositions include features like predictive maintenance capabilities, reduced operational costs, and enhanced water quality monitoring.
Propelling Factors for APAC Water Automation and Instrumentation Market Growth
The APAC water automation and instrumentation market is propelled by several key factors: growing urbanization and industrialization leading to increased water demand; stringent government regulations aimed at improving water efficiency and reducing waste; rising adoption of smart water management technologies; and increasing investments in water infrastructure development projects. Technological advancements, such as the Internet of Things (IoT) and Artificial Intelligence (AI), further enhance the efficiency and effectiveness of water management systems, driving market growth.
Obstacles in the APAC Water Automation and Instrumentation Market
Challenges hindering market growth include high initial investment costs associated with implementing advanced automation technologies; the need for skilled personnel to operate and maintain these systems; concerns about data security and cyber threats; and the presence of legacy infrastructure in some regions that may be incompatible with new technologies. Supply chain disruptions, particularly those related to electronic components, can also impact market growth.
Future Opportunities in APAC Water Automation and Instrumentation Market
Future opportunities lie in the growing adoption of smart water management solutions, integrating advanced analytics and AI capabilities for predictive maintenance and optimized resource allocation. The expansion into emerging markets and the development of cost-effective, easy-to-implement solutions for smaller-scale applications will also drive growth. Furthermore, the increasing focus on water reuse and recycling presents significant opportunities for innovative solutions.
Major Players in the APAC Water Automation and Instrumentation Market Ecosystem
- NALCO
- Phoenix Contact
- Endress + Hauser Pvt Ltd
- GE Corporation
- KROHNE LT
- MJK Automation
- Siemens AG
- Schneider Electric SE
- Emerson Electric
- ABB Group
- Rockwell Automation Inc
- Yokogawa Electric Corporation
- Mitsubishi Motors Corporation
- Eurotek India
Key Developments in APAC Water Automation and Instrumentation Market Industry
- August 2020: Wellin Tech introduced a SCADA system solution for a large water conservancy pumping station, improving operational efficiency and management.
- March 2021: Hokkaido University, Robotic Biology Institute Inc., iLAC Co., Ltd, and Shionogi & Co., Ltd. collaborated on an automated system for novel coronavirus analysis in wastewater, highlighting the adaptability of automation technology.
Strategic APAC Water Automation and Instrumentation Market Forecast
The APAC water automation and instrumentation market is poised for significant growth over the forecast period (2025-2033), driven by continued investment in water infrastructure, technological advancements, and a growing focus on sustainable water management practices. The increasing adoption of smart water management solutions, coupled with favorable government policies and rising environmental awareness, will further fuel market expansion. The market is expected to witness a substantial increase in value, reaching xx Million by 2033.
APAC Water Automation and Instrumentation Market Segmentation
-
1. Water Automation Solution
- 1.1. DCS
- 1.2. SCADA
- 1.3. PLC
- 1.4. HMI
- 1.5. Other Water Automation Solutions
-
2. Water Instrumentation Solution
- 2.1. Pressure Transmitter
- 2.2. Level Transmitter
- 2.3. Temperature Transmitter
- 2.4. Liquid Analyzers
- 2.5. Gas Analyzers
- 2.6. Leakage Detection Systems
- 2.7. Flow Sensors/Transmitters
- 2.8. Other Water Instrumentation Solutions
-
3. End-User Industry (Qualitative Analysis)
- 3.1. Chemical
- 3.2. Manufacturing
- 3.3. Food and Beverages
APAC Water Automation and Instrumentation Market Segmentation By Geography
-
1. North America
- 1.1. United States
- 1.2. Canada
- 1.3. Mexico
-
2. South America
- 2.1. Brazil
- 2.2. Argentina
- 2.3. Rest of South America
-
3. Europe
- 3.1. United Kingdom
- 3.2. Germany
- 3.3. France
- 3.4. Italy
- 3.5. Spain
- 3.6. Russia
- 3.7. Benelux
- 3.8. Nordics
- 3.9. Rest of Europe
-
4. Middle East & Africa
- 4.1. Turkey
- 4.2. Israel
- 4.3. GCC
- 4.4. North Africa
- 4.5. South Africa
- 4.6. Rest of Middle East & Africa
-
5. Asia Pacific
- 5.1. China
- 5.2. India
- 5.3. Japan
- 5.4. South Korea
- 5.5. ASEAN
- 5.6. Oceania
- 5.7. Rest of Asia Pacific
APAC Water Automation and Instrumentation Market REPORT HIGHLIGHTS
| Aspects | Details |
|---|---|
| Study Period | 2019-2033 |
| Base Year | 2024 |
| Estimated Year | 2025 |
| Forecast Period | 2025-2033 |
| Historical Period | 2019-2024 |
| Growth Rate | CAGR of 8.10% from 2019-2033 |
| Segmentation |
|
Table of Contents
- 1. Introduction
- 1.1. Research Scope
- 1.2. Market Segmentation
- 1.3. Research Methodology
- 1.4. Definitions and Assumptions
- 2. Executive Summary
- 2.1. Introduction
- 3. Market Dynamics
- 3.1. Introduction
- 3.2. Market Drivers
- 3.2.1. Government Regulation to Save Water Resources and Energy; Increase in Adoption of Smart Water Technologies
- 3.3. Market Restrains
- 3.3.1. Data Privacy; The Complex Structure of Cloud Storage
- 3.4. Market Trends
- 3.4.1. Demand from Food and Beverage Industry to Witness a Significant Growth Rate
- 4. Market Factor Analysis
- 4.1. Porters Five Forces
- 4.2. Supply/Value Chain
- 4.3. PESTEL analysis
- 4.4. Market Entropy
- 4.5. Patent/Trademark Analysis
- 5. Global APAC Water Automation and Instrumentation Market Analysis, Insights and Forecast, 2019-2031
- 5.1. Market Analysis, Insights and Forecast - by Water Automation Solution
- 5.1.1. DCS
- 5.1.2. SCADA
- 5.1.3. PLC
- 5.1.4. HMI
- 5.1.5. Other Water Automation Solutions
- 5.2. Market Analysis, Insights and Forecast - by Water Instrumentation Solution
- 5.2.1. Pressure Transmitter
- 5.2.2. Level Transmitter
- 5.2.3. Temperature Transmitter
- 5.2.4. Liquid Analyzers
- 5.2.5. Gas Analyzers
- 5.2.6. Leakage Detection Systems
- 5.2.7. Flow Sensors/Transmitters
- 5.2.8. Other Water Instrumentation Solutions
- 5.3. Market Analysis, Insights and Forecast - by End-User Industry (Qualitative Analysis)
- 5.3.1. Chemical
- 5.3.2. Manufacturing
- 5.3.3. Food and Beverages
- 5.4. Market Analysis, Insights and Forecast - by Region
- 5.4.1. North America
- 5.4.2. South America
- 5.4.3. Europe
- 5.4.4. Middle East & Africa
- 5.4.5. Asia Pacific
- 5.1. Market Analysis, Insights and Forecast - by Water Automation Solution
- 6. North America APAC Water Automation and Instrumentation Market Analysis, Insights and Forecast, 2019-2031
- 6.1. Market Analysis, Insights and Forecast - by Water Automation Solution
- 6.1.1. DCS
- 6.1.2. SCADA
- 6.1.3. PLC
- 6.1.4. HMI
- 6.1.5. Other Water Automation Solutions
- 6.2. Market Analysis, Insights and Forecast - by Water Instrumentation Solution
- 6.2.1. Pressure Transmitter
- 6.2.2. Level Transmitter
- 6.2.3. Temperature Transmitter
- 6.2.4. Liquid Analyzers
- 6.2.5. Gas Analyzers
- 6.2.6. Leakage Detection Systems
- 6.2.7. Flow Sensors/Transmitters
- 6.2.8. Other Water Instrumentation Solutions
- 6.3. Market Analysis, Insights and Forecast - by End-User Industry (Qualitative Analysis)
- 6.3.1. Chemical
- 6.3.2. Manufacturing
- 6.3.3. Food and Beverages
- 6.1. Market Analysis, Insights and Forecast - by Water Automation Solution
- 7. South America APAC Water Automation and Instrumentation Market Analysis, Insights and Forecast, 2019-2031
- 7.1. Market Analysis, Insights and Forecast - by Water Automation Solution
- 7.1.1. DCS
- 7.1.2. SCADA
- 7.1.3. PLC
- 7.1.4. HMI
- 7.1.5. Other Water Automation Solutions
- 7.2. Market Analysis, Insights and Forecast - by Water Instrumentation Solution
- 7.2.1. Pressure Transmitter
- 7.2.2. Level Transmitter
- 7.2.3. Temperature Transmitter
- 7.2.4. Liquid Analyzers
- 7.2.5. Gas Analyzers
- 7.2.6. Leakage Detection Systems
- 7.2.7. Flow Sensors/Transmitters
- 7.2.8. Other Water Instrumentation Solutions
- 7.3. Market Analysis, Insights and Forecast - by End-User Industry (Qualitative Analysis)
- 7.3.1. Chemical
- 7.3.2. Manufacturing
- 7.3.3. Food and Beverages
- 7.1. Market Analysis, Insights and Forecast - by Water Automation Solution
- 8. Europe APAC Water Automation and Instrumentation Market Analysis, Insights and Forecast, 2019-2031
- 8.1. Market Analysis, Insights and Forecast - by Water Automation Solution
- 8.1.1. DCS
- 8.1.2. SCADA
- 8.1.3. PLC
- 8.1.4. HMI
- 8.1.5. Other Water Automation Solutions
- 8.2. Market Analysis, Insights and Forecast - by Water Instrumentation Solution
- 8.2.1. Pressure Transmitter
- 8.2.2. Level Transmitter
- 8.2.3. Temperature Transmitter
- 8.2.4. Liquid Analyzers
- 8.2.5. Gas Analyzers
- 8.2.6. Leakage Detection Systems
- 8.2.7. Flow Sensors/Transmitters
- 8.2.8. Other Water Instrumentation Solutions
- 8.3. Market Analysis, Insights and Forecast - by End-User Industry (Qualitative Analysis)
- 8.3.1. Chemical
- 8.3.2. Manufacturing
- 8.3.3. Food and Beverages
- 8.1. Market Analysis, Insights and Forecast - by Water Automation Solution
- 9. Middle East & Africa APAC Water Automation and Instrumentation Market Analysis, Insights and Forecast, 2019-2031
- 9.1. Market Analysis, Insights and Forecast - by Water Automation Solution
- 9.1.1. DCS
- 9.1.2. SCADA
- 9.1.3. PLC
- 9.1.4. HMI
- 9.1.5. Other Water Automation Solutions
- 9.2. Market Analysis, Insights and Forecast - by Water Instrumentation Solution
- 9.2.1. Pressure Transmitter
- 9.2.2. Level Transmitter
- 9.2.3. Temperature Transmitter
- 9.2.4. Liquid Analyzers
- 9.2.5. Gas Analyzers
- 9.2.6. Leakage Detection Systems
- 9.2.7. Flow Sensors/Transmitters
- 9.2.8. Other Water Instrumentation Solutions
- 9.3. Market Analysis, Insights and Forecast - by End-User Industry (Qualitative Analysis)
- 9.3.1. Chemical
- 9.3.2. Manufacturing
- 9.3.3. Food and Beverages
- 9.1. Market Analysis, Insights and Forecast - by Water Automation Solution
- 10. Asia Pacific APAC Water Automation and Instrumentation Market Analysis, Insights and Forecast, 2019-2031
- 10.1. Market Analysis, Insights and Forecast - by Water Automation Solution
- 10.1.1. DCS
- 10.1.2. SCADA
- 10.1.3. PLC
- 10.1.4. HMI
- 10.1.5. Other Water Automation Solutions
- 10.2. Market Analysis, Insights and Forecast - by Water Instrumentation Solution
- 10.2.1. Pressure Transmitter
- 10.2.2. Level Transmitter
- 10.2.3. Temperature Transmitter
- 10.2.4. Liquid Analyzers
- 10.2.5. Gas Analyzers
- 10.2.6. Leakage Detection Systems
- 10.2.7. Flow Sensors/Transmitters
- 10.2.8. Other Water Instrumentation Solutions
- 10.3. Market Analysis, Insights and Forecast - by End-User Industry (Qualitative Analysis)
- 10.3.1. Chemical
- 10.3.2. Manufacturing
- 10.3.3. Food and Beverages
- 10.1. Market Analysis, Insights and Forecast - by Water Automation Solution
- 11. China APAC Water Automation and Instrumentation Market Analysis, Insights and Forecast, 2019-2031
- 12. India APAC Water Automation and Instrumentation Market Analysis, Insights and Forecast, 2019-2031
- 13. Japan APAC Water Automation and Instrumentation Market Analysis, Insights and Forecast, 2019-2031
- 14. Australia New Zealand APAC Water Automation and Instrumentation Market Analysis, Insights and Forecast, 2019-2031
- 15. Rest of Asia Pacific APAC Water Automation and Instrumentation Market Analysis, Insights and Forecast, 2019-2031
- 16. Competitive Analysis
- 16.1. Global Market Share Analysis 2024
- 16.2. Company Profiles
- 16.2.1 NALCO
- 16.2.1.1. Overview
- 16.2.1.2. Products
- 16.2.1.3. SWOT Analysis
- 16.2.1.4. Recent Developments
- 16.2.1.5. Financials (Based on Availability)
- 16.2.2 Phoenix Contact
- 16.2.2.1. Overview
- 16.2.2.2. Products
- 16.2.2.3. SWOT Analysis
- 16.2.2.4. Recent Developments
- 16.2.2.5. Financials (Based on Availability)
- 16.2.3 Endress + Hauser Pvt Ltd
- 16.2.3.1. Overview
- 16.2.3.2. Products
- 16.2.3.3. SWOT Analysis
- 16.2.3.4. Recent Developments
- 16.2.3.5. Financials (Based on Availability)
- 16.2.4 GE Corporation
- 16.2.4.1. Overview
- 16.2.4.2. Products
- 16.2.4.3. SWOT Analysis
- 16.2.4.4. Recent Developments
- 16.2.4.5. Financials (Based on Availability)
- 16.2.5 KROHNE LT
- 16.2.5.1. Overview
- 16.2.5.2. Products
- 16.2.5.3. SWOT Analysis
- 16.2.5.4. Recent Developments
- 16.2.5.5. Financials (Based on Availability)
- 16.2.6 MJK Automation
- 16.2.6.1. Overview
- 16.2.6.2. Products
- 16.2.6.3. SWOT Analysis
- 16.2.6.4. Recent Developments
- 16.2.6.5. Financials (Based on Availability)
- 16.2.7 Siemens AG
- 16.2.7.1. Overview
- 16.2.7.2. Products
- 16.2.7.3. SWOT Analysis
- 16.2.7.4. Recent Developments
- 16.2.7.5. Financials (Based on Availability)
- 16.2.8 Schneider Electric SE
- 16.2.8.1. Overview
- 16.2.8.2. Products
- 16.2.8.3. SWOT Analysis
- 16.2.8.4. Recent Developments
- 16.2.8.5. Financials (Based on Availability)
- 16.2.9 Emerson Electric
- 16.2.9.1. Overview
- 16.2.9.2. Products
- 16.2.9.3. SWOT Analysis
- 16.2.9.4. Recent Developments
- 16.2.9.5. Financials (Based on Availability)
- 16.2.10 ABB Group
- 16.2.10.1. Overview
- 16.2.10.2. Products
- 16.2.10.3. SWOT Analysis
- 16.2.10.4. Recent Developments
- 16.2.10.5. Financials (Based on Availability)
- 16.2.11 Rockwell Automation Inc
- 16.2.11.1. Overview
- 16.2.11.2. Products
- 16.2.11.3. SWOT Analysis
- 16.2.11.4. Recent Developments
- 16.2.11.5. Financials (Based on Availability)
- 16.2.12 Yokogawa Electric Corporation
- 16.2.12.1. Overview
- 16.2.12.2. Products
- 16.2.12.3. SWOT Analysis
- 16.2.12.4. Recent Developments
- 16.2.12.5. Financials (Based on Availability)
- 16.2.13 Mitsubishi Motors Corporation
- 16.2.13.1. Overview
- 16.2.13.2. Products
- 16.2.13.3. SWOT Analysis
- 16.2.13.4. Recent Developments
- 16.2.13.5. Financials (Based on Availability)
- 16.2.14 Eurotek India
- 16.2.14.1. Overview
- 16.2.14.2. Products
- 16.2.14.3. SWOT Analysis
- 16.2.14.4. Recent Developments
- 16.2.14.5. Financials (Based on Availability)
- 16.2.1 NALCO
List of Figures
- Figure 1: Global APAC Water Automation and Instrumentation Market Revenue Breakdown (Million, %) by Region 2024 & 2032
- Figure 2: Asia Pacific APAC Water Automation and Instrumentation Market Revenue (Million), by Country 2024 & 2032
- Figure 3: Asia Pacific APAC Water Automation and Instrumentation Market Revenue Share (%), by Country 2024 & 2032
- Figure 4: North America APAC Water Automation and Instrumentation Market Revenue (Million), by Water Automation Solution 2024 & 2032
- Figure 5: North America APAC Water Automation and Instrumentation Market Revenue Share (%), by Water Automation Solution 2024 & 2032
- Figure 6: North America APAC Water Automation and Instrumentation Market Revenue (Million), by Water Instrumentation Solution 2024 & 2032
- Figure 7: North America APAC Water Automation and Instrumentation Market Revenue Share (%), by Water Instrumentation Solution 2024 & 2032
- Figure 8: North America APAC Water Automation and Instrumentation Market Revenue (Million), by End-User Industry (Qualitative Analysis) 2024 & 2032
- Figure 9: North America APAC Water Automation and Instrumentation Market Revenue Share (%), by End-User Industry (Qualitative Analysis) 2024 & 2032
- Figure 10: North America APAC Water Automation and Instrumentation Market Revenue (Million), by Country 2024 & 2032
- Figure 11: North America APAC Water Automation and Instrumentation Market Revenue Share (%), by Country 2024 & 2032
- Figure 12: South America APAC Water Automation and Instrumentation Market Revenue (Million), by Water Automation Solution 2024 & 2032
- Figure 13: South America APAC Water Automation and Instrumentation Market Revenue Share (%), by Water Automation Solution 2024 & 2032
- Figure 14: South America APAC Water Automation and Instrumentation Market Revenue (Million), by Water Instrumentation Solution 2024 & 2032
- Figure 15: South America APAC Water Automation and Instrumentation Market Revenue Share (%), by Water Instrumentation Solution 2024 & 2032
- Figure 16: South America APAC Water Automation and Instrumentation Market Revenue (Million), by End-User Industry (Qualitative Analysis) 2024 & 2032
- Figure 17: South America APAC Water Automation and Instrumentation Market Revenue Share (%), by End-User Industry (Qualitative Analysis) 2024 & 2032
- Figure 18: South America APAC Water Automation and Instrumentation Market Revenue (Million), by Country 2024 & 2032
- Figure 19: South America APAC Water Automation and Instrumentation Market Revenue Share (%), by Country 2024 & 2032
- Figure 20: Europe APAC Water Automation and Instrumentation Market Revenue (Million), by Water Automation Solution 2024 & 2032
- Figure 21: Europe APAC Water Automation and Instrumentation Market Revenue Share (%), by Water Automation Solution 2024 & 2032
- Figure 22: Europe APAC Water Automation and Instrumentation Market Revenue (Million), by Water Instrumentation Solution 2024 & 2032
- Figure 23: Europe APAC Water Automation and Instrumentation Market Revenue Share (%), by Water Instrumentation Solution 2024 & 2032
- Figure 24: Europe APAC Water Automation and Instrumentation Market Revenue (Million), by End-User Industry (Qualitative Analysis) 2024 & 2032
- Figure 25: Europe APAC Water Automation and Instrumentation Market Revenue Share (%), by End-User Industry (Qualitative Analysis) 2024 & 2032
- Figure 26: Europe APAC Water Automation and Instrumentation Market Revenue (Million), by Country 2024 & 2032
- Figure 27: Europe APAC Water Automation and Instrumentation Market Revenue Share (%), by Country 2024 & 2032
- Figure 28: Middle East & Africa APAC Water Automation and Instrumentation Market Revenue (Million), by Water Automation Solution 2024 & 2032
- Figure 29: Middle East & Africa APAC Water Automation and Instrumentation Market Revenue Share (%), by Water Automation Solution 2024 & 2032
- Figure 30: Middle East & Africa APAC Water Automation and Instrumentation Market Revenue (Million), by Water Instrumentation Solution 2024 & 2032
- Figure 31: Middle East & Africa APAC Water Automation and Instrumentation Market Revenue Share (%), by Water Instrumentation Solution 2024 & 2032
- Figure 32: Middle East & Africa APAC Water Automation and Instrumentation Market Revenue (Million), by End-User Industry (Qualitative Analysis) 2024 & 2032
- Figure 33: Middle East & Africa APAC Water Automation and Instrumentation Market Revenue Share (%), by End-User Industry (Qualitative Analysis) 2024 & 2032
- Figure 34: Middle East & Africa APAC Water Automation and Instrumentation Market Revenue (Million), by Country 2024 & 2032
- Figure 35: Middle East & Africa APAC Water Automation and Instrumentation Market Revenue Share (%), by Country 2024 & 2032
- Figure 36: Asia Pacific APAC Water Automation and Instrumentation Market Revenue (Million), by Water Automation Solution 2024 & 2032
- Figure 37: Asia Pacific APAC Water Automation and Instrumentation Market Revenue Share (%), by Water Automation Solution 2024 & 2032
- Figure 38: Asia Pacific APAC Water Automation and Instrumentation Market Revenue (Million), by Water Instrumentation Solution 2024 & 2032
- Figure 39: Asia Pacific APAC Water Automation and Instrumentation Market Revenue Share (%), by Water Instrumentation Solution 2024 & 2032
- Figure 40: Asia Pacific APAC Water Automation and Instrumentation Market Revenue (Million), by End-User Industry (Qualitative Analysis) 2024 & 2032
- Figure 41: Asia Pacific APAC Water Automation and Instrumentation Market Revenue Share (%), by End-User Industry (Qualitative Analysis) 2024 & 2032
- Figure 42: Asia Pacific APAC Water Automation and Instrumentation Market Revenue (Million), by Country 2024 & 2032
- Figure 43: Asia Pacific APAC Water Automation and Instrumentation Market Revenue Share (%), by Country 2024 & 2032
List of Tables
- Table 1: Global APAC Water Automation and Instrumentation Market Revenue Million Forecast, by Region 2019 & 2032
- Table 2: Global APAC Water Automation and Instrumentation Market Revenue Million Forecast, by Water Automation Solution 2019 & 2032
- Table 3: Global APAC Water Automation and Instrumentation Market Revenue Million Forecast, by Water Instrumentation Solution 2019 & 2032
- Table 4: Global APAC Water Automation and Instrumentation Market Revenue Million Forecast, by End-User Industry (Qualitative Analysis) 2019 & 2032
- Table 5: Global APAC Water Automation and Instrumentation Market Revenue Million Forecast, by Region 2019 & 2032
- Table 6: Global APAC Water Automation and Instrumentation Market Revenue Million Forecast, by Country 2019 & 2032
- Table 7: China APAC Water Automation and Instrumentation Market Revenue (Million) Forecast, by Application 2019 & 2032
- Table 8: India APAC Water Automation and Instrumentation Market Revenue (Million) Forecast, by Application 2019 & 2032
- Table 9: Japan APAC Water Automation and Instrumentation Market Revenue (Million) Forecast, by Application 2019 & 2032
- Table 10: Australia New Zealand APAC Water Automation and Instrumentation Market Revenue (Million) Forecast, by Application 2019 & 2032
- Table 11: Rest of Asia Pacific APAC Water Automation and Instrumentation Market Revenue (Million) Forecast, by Application 2019 & 2032
- Table 12: Global APAC Water Automation and Instrumentation Market Revenue Million Forecast, by Water Automation Solution 2019 & 2032
- Table 13: Global APAC Water Automation and Instrumentation Market Revenue Million Forecast, by Water Instrumentation Solution 2019 & 2032
- Table 14: Global APAC Water Automation and Instrumentation Market Revenue Million Forecast, by End-User Industry (Qualitative Analysis) 2019 & 2032
- Table 15: Global APAC Water Automation and Instrumentation Market Revenue Million Forecast, by Country 2019 & 2032
- Table 16: United States APAC Water Automation and Instrumentation Market Revenue (Million) Forecast, by Application 2019 & 2032
- Table 17: Canada APAC Water Automation and Instrumentation Market Revenue (Million) Forecast, by Application 2019 & 2032
- Table 18: Mexico APAC Water Automation and Instrumentation Market Revenue (Million) Forecast, by Application 2019 & 2032
- Table 19: Global APAC Water Automation and Instrumentation Market Revenue Million Forecast, by Water Automation Solution 2019 & 2032
- Table 20: Global APAC Water Automation and Instrumentation Market Revenue Million Forecast, by Water Instrumentation Solution 2019 & 2032
- Table 21: Global APAC Water Automation and Instrumentation Market Revenue Million Forecast, by End-User Industry (Qualitative Analysis) 2019 & 2032
- Table 22: Global APAC Water Automation and Instrumentation Market Revenue Million Forecast, by Country 2019 & 2032
- Table 23: Brazil APAC Water Automation and Instrumentation Market Revenue (Million) Forecast, by Application 2019 & 2032
- Table 24: Argentina APAC Water Automation and Instrumentation Market Revenue (Million) Forecast, by Application 2019 & 2032
- Table 25: Rest of South America APAC Water Automation and Instrumentation Market Revenue (Million) Forecast, by Application 2019 & 2032
- Table 26: Global APAC Water Automation and Instrumentation Market Revenue Million Forecast, by Water Automation Solution 2019 & 2032
- Table 27: Global APAC Water Automation and Instrumentation Market Revenue Million Forecast, by Water Instrumentation Solution 2019 & 2032
- Table 28: Global APAC Water Automation and Instrumentation Market Revenue Million Forecast, by End-User Industry (Qualitative Analysis) 2019 & 2032
- Table 29: Global APAC Water Automation and Instrumentation Market Revenue Million Forecast, by Country 2019 & 2032
- Table 30: United Kingdom APAC Water Automation and Instrumentation Market Revenue (Million) Forecast, by Application 2019 & 2032
- Table 31: Germany APAC Water Automation and Instrumentation Market Revenue (Million) Forecast, by Application 2019 & 2032
- Table 32: France APAC Water Automation and Instrumentation Market Revenue (Million) Forecast, by Application 2019 & 2032
- Table 33: Italy APAC Water Automation and Instrumentation Market Revenue (Million) Forecast, by Application 2019 & 2032
- Table 34: Spain APAC Water Automation and Instrumentation Market Revenue (Million) Forecast, by Application 2019 & 2032
- Table 35: Russia APAC Water Automation and Instrumentation Market Revenue (Million) Forecast, by Application 2019 & 2032
- Table 36: Benelux APAC Water Automation and Instrumentation Market Revenue (Million) Forecast, by Application 2019 & 2032
- Table 37: Nordics APAC Water Automation and Instrumentation Market Revenue (Million) Forecast, by Application 2019 & 2032
- Table 38: Rest of Europe APAC Water Automation and Instrumentation Market Revenue (Million) Forecast, by Application 2019 & 2032
- Table 39: Global APAC Water Automation and Instrumentation Market Revenue Million Forecast, by Water Automation Solution 2019 & 2032
- Table 40: Global APAC Water Automation and Instrumentation Market Revenue Million Forecast, by Water Instrumentation Solution 2019 & 2032
- Table 41: Global APAC Water Automation and Instrumentation Market Revenue Million Forecast, by End-User Industry (Qualitative Analysis) 2019 & 2032
- Table 42: Global APAC Water Automation and Instrumentation Market Revenue Million Forecast, by Country 2019 & 2032
- Table 43: Turkey APAC Water Automation and Instrumentation Market Revenue (Million) Forecast, by Application 2019 & 2032
- Table 44: Israel APAC Water Automation and Instrumentation Market Revenue (Million) Forecast, by Application 2019 & 2032
- Table 45: GCC APAC Water Automation and Instrumentation Market Revenue (Million) Forecast, by Application 2019 & 2032
- Table 46: North Africa APAC Water Automation and Instrumentation Market Revenue (Million) Forecast, by Application 2019 & 2032
- Table 47: South Africa APAC Water Automation and Instrumentation Market Revenue (Million) Forecast, by Application 2019 & 2032
- Table 48: Rest of Middle East & Africa APAC Water Automation and Instrumentation Market Revenue (Million) Forecast, by Application 2019 & 2032
- Table 49: Global APAC Water Automation and Instrumentation Market Revenue Million Forecast, by Water Automation Solution 2019 & 2032
- Table 50: Global APAC Water Automation and Instrumentation Market Revenue Million Forecast, by Water Instrumentation Solution 2019 & 2032
- Table 51: Global APAC Water Automation and Instrumentation Market Revenue Million Forecast, by End-User Industry (Qualitative Analysis) 2019 & 2032
- Table 52: Global APAC Water Automation and Instrumentation Market Revenue Million Forecast, by Country 2019 & 2032
- Table 53: China APAC Water Automation and Instrumentation Market Revenue (Million) Forecast, by Application 2019 & 2032
- Table 54: India APAC Water Automation and Instrumentation Market Revenue (Million) Forecast, by Application 2019 & 2032
- Table 55: Japan APAC Water Automation and Instrumentation Market Revenue (Million) Forecast, by Application 2019 & 2032
- Table 56: South Korea APAC Water Automation and Instrumentation Market Revenue (Million) Forecast, by Application 2019 & 2032
- Table 57: ASEAN APAC Water Automation and Instrumentation Market Revenue (Million) Forecast, by Application 2019 & 2032
- Table 58: Oceania APAC Water Automation and Instrumentation Market Revenue (Million) Forecast, by Application 2019 & 2032
- Table 59: Rest of Asia Pacific APAC Water Automation and Instrumentation Market Revenue (Million) Forecast, by Application 2019 & 2032
Frequently Asked Questions
1. What is the projected Compound Annual Growth Rate (CAGR) of the APAC Water Automation and Instrumentation Market?
The projected CAGR is approximately 8.10%.
2. Which companies are prominent players in the APAC Water Automation and Instrumentation Market?
Key companies in the market include NALCO, Phoenix Contact, Endress + Hauser Pvt Ltd, GE Corporation, KROHNE LT, MJK Automation, Siemens AG, Schneider Electric SE, Emerson Electric, ABB Group, Rockwell Automation Inc, Yokogawa Electric Corporation, Mitsubishi Motors Corporation, Eurotek India.
3. What are the main segments of the APAC Water Automation and Instrumentation Market?
The market segments include Water Automation Solution, Water Instrumentation Solution, End-User Industry (Qualitative Analysis).
4. Can you provide details about the market size?
The market size is estimated to be USD XX Million as of 2022.
5. What are some drivers contributing to market growth?
Government Regulation to Save Water Resources and Energy; Increase in Adoption of Smart Water Technologies.
6. What are the notable trends driving market growth?
Demand from Food and Beverage Industry to Witness a Significant Growth Rate.
7. Are there any restraints impacting market growth?
Data Privacy; The Complex Structure of Cloud Storage.
8. Can you provide examples of recent developments in the market?
March 2021 - In response to the COVID-19 pandemic, Hokkaido University, Robotic Biology Institute Inc., iLAC Co., Ltd, and Shionogi & Co., Ltd entered a memorandum of understanding toward the establishment of an automated system for the analysis of the novel coronavirus in wastewater.
9. What pricing options are available for accessing the report?
Pricing options include single-user, multi-user, and enterprise licenses priced at USD 4750, USD 4950, and USD 6800 respectively.
10. Is the market size provided in terms of value or volume?
The market size is provided in terms of value, measured in Million.
11. Are there any specific market keywords associated with the report?
Yes, the market keyword associated with the report is "APAC Water Automation and Instrumentation Market," which aids in identifying and referencing the specific market segment covered.
12. How do I determine which pricing option suits my needs best?
The pricing options vary based on user requirements and access needs. Individual users may opt for single-user licenses, while businesses requiring broader access may choose multi-user or enterprise licenses for cost-effective access to the report.
13. Are there any additional resources or data provided in the APAC Water Automation and Instrumentation Market report?
While the report offers comprehensive insights, it's advisable to review the specific contents or supplementary materials provided to ascertain if additional resources or data are available.
14. How can I stay updated on further developments or reports in the APAC Water Automation and Instrumentation Market?
To stay informed about further developments, trends, and reports in the APAC Water Automation and Instrumentation Market, consider subscribing to industry newsletters, following relevant companies and organizations, or regularly checking reputable industry news sources and publications.
Methodology
Step 1 - Identification of Relevant Samples Size from Population Database


Step 2 - Approaches for Defining Global Market Size (Value, Volume* & Price*)

Note*: In applicable scenarios
Step 3 - Data Sources
Primary Research
- Web Analytics
- Survey Reports
- Research Institute
- Latest Research Reports
- Opinion Leaders
Secondary Research
- Annual Reports
- White Paper
- Latest Press Release
- Industry Association
- Paid Database
- Investor Presentations

Step 4 - Data Triangulation
Involves using different sources of information in order to increase the validity of a study
These sources are likely to be stakeholders in a program - participants, other researchers, program staff, other community members, and so on.
Then we put all data in single framework & apply various statistical tools to find out the dynamic on the market.
During the analysis stage, feedback from the stakeholder groups would be compared to determine areas of agreement as well as areas of divergence
