

Key Insights
The Asia-Pacific (APAC) Safety Instrumented Systems (SIS) market is experiencing robust growth, driven by increasing industrial automation, stringent safety regulations across sectors like oil & gas, chemicals, and power generation, and a rising focus on preventing catastrophic accidents. The market's Compound Annual Growth Rate (CAGR) of 12.50% from 2019-2024 indicates significant expansion. This growth is fueled by several key trends: the increasing adoption of advanced technologies like artificial intelligence and machine learning for predictive maintenance and enhanced safety; the rising demand for sophisticated SIS solutions to manage complex industrial processes; and the expanding presence of multinational corporations in APAC, pushing for higher safety standards. Significant growth is anticipated in countries like India and China, driven by their burgeoning industrial sectors and government initiatives promoting industrial safety. While the initial investment in SIS can be high, the long-term benefits in terms of reduced operational downtime, improved safety, and enhanced regulatory compliance far outweigh the costs, making it a strategically sound investment for industries.
The segmentation within the APAC SIS market reflects diverse needs across various applications. The Emergency Shutdown Systems (ESD) segment likely holds a substantial market share, followed by Fire & Gas Monitoring and Control (F&GC) and High Integrity Pressure Protection Systems (HIPPS). The Oil & Gas and Chemicals & Petrochemicals end-user segments are significant contributors to the market due to their inherent process risks. However, growth is anticipated across other end-users like pharmaceuticals and food & beverage as safety consciousness increases. Competition in the market is intense, with established players like Honeywell, ABB, and Siemens vying for market share alongside specialized SIS providers. While challenges remain, such as the need for skilled professionals to install and maintain SIS and the potential for high initial capital expenditure, the overall outlook for the APAC SIS market remains highly positive, promising substantial expansion through 2033.
APAC Safety Instrumented Systems Market: A Comprehensive Report (2019-2033)
This insightful report provides a deep dive into the Asia-Pacific Safety Instrumented Systems (SIS) market, offering a comprehensive analysis of its current state, future trajectory, and key players. With a study period spanning 2019-2033, a base year of 2025, and a forecast period of 2025-2033, this report is an invaluable resource for stakeholders seeking to understand and capitalize on the opportunities within this dynamic market. The market size in 2025 is estimated to be xx Million.
APAC Safety Instrumented Systems Market Composition & Trends
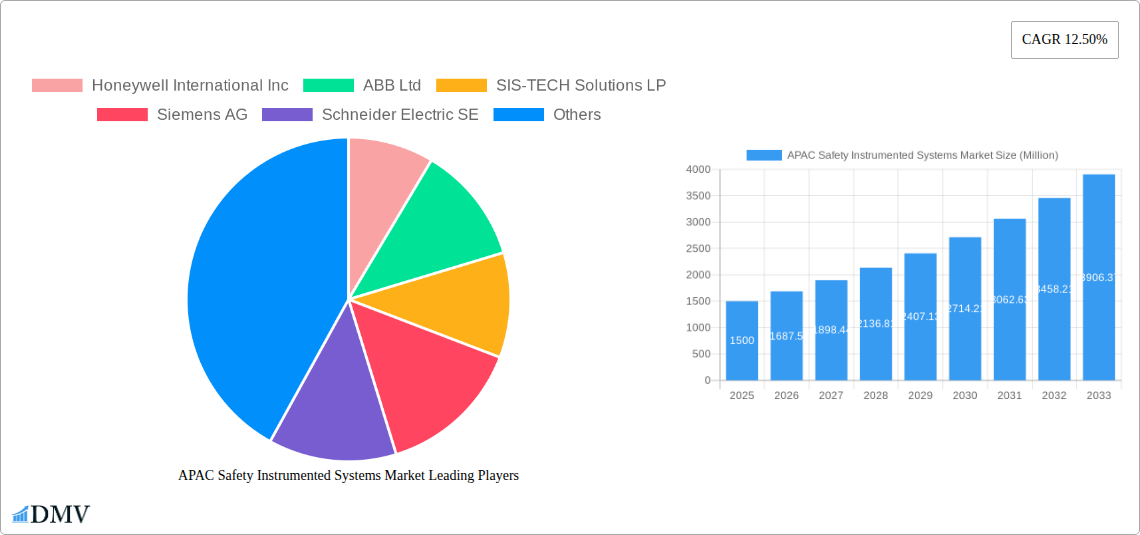
This section analyzes the competitive landscape of the APAC SIS market, encompassing market concentration, innovation drivers, regulatory frameworks, substitute products, end-user profiles, and mergers and acquisitions (M&A) activities. The market is characterized by a moderately concentrated structure, with key players such as Honeywell International Inc, ABB Ltd, and Siemens AG holding significant market share. However, the presence of several regional and specialized players contributes to competitive intensity. Innovation is driven by stringent safety regulations, particularly in the oil and gas and chemical sectors, demanding advanced SIS technologies. The increasing adoption of Industry 4.0 principles and the integration of digital technologies like IoT and AI are further propelling innovation.
- Market Share Distribution (2025): Honeywell (xx%), ABB (xx%), Siemens (xx%), Others (xx%).
- M&A Activity (2019-2024): Total deal value estimated at xx Million, with a focus on acquiring specialized SIS technology providers and expanding regional presence.
- Regulatory Landscape: Stringent safety regulations across APAC nations, especially in sectors like oil & gas, are driving demand. Harmonization efforts are ongoing, but variations persist across countries.
- Substitute Products: While direct substitutes are limited, alternative safety systems and process control strategies pose indirect competition.
- End-User Profiles: The market is largely driven by the oil & gas, chemical, and power generation sectors, with growing contributions from pharmaceuticals and food & beverage.
APAC Safety Instrumented Systems Market Industry Evolution
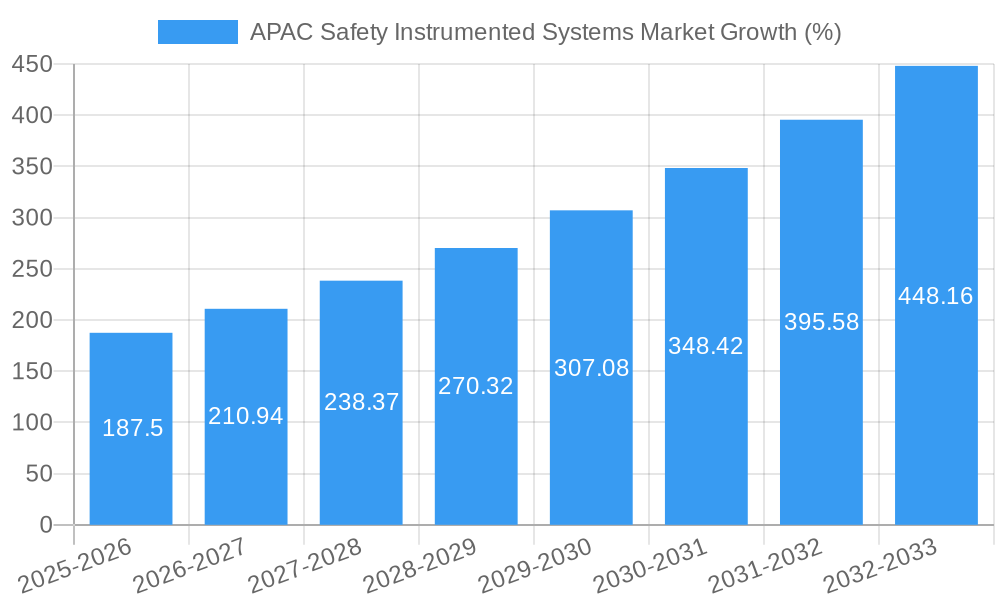
The APAC SIS market has witnessed significant growth during the historical period (2019-2024), primarily driven by increasing industrialization, rising investments in infrastructure projects, and the implementation of stricter safety regulations. Technological advancements, such as the incorporation of advanced sensors, sophisticated analytics, and improved control algorithms, have enhanced the capabilities and efficiency of SIS. The shift towards predictive maintenance, enabled by data analytics and machine learning, is another key factor. Consumer demand is evolving towards more integrated, reliable, and cost-effective SIS solutions. This is pushing vendors to offer customized solutions and flexible service models. The market is expected to maintain a robust Compound Annual Growth Rate (CAGR) of xx% during the forecast period (2025-2033), reaching xx Million by 2033. Adoption rates are highest in developed economies like Japan and South Korea, but significant growth is anticipated in emerging economies like India and Vietnam.
Leading Regions, Countries, or Segments in APAC Safety Instrumented Systems Market
China and India represent the largest and fastest-growing SIS markets in APAC, driven by substantial industrial expansion and significant investments in energy and infrastructure. Japan maintains a strong position due to its advanced industrial base and stringent safety standards.
- By Component: Programmable devices hold the largest market share, followed by sensors and actuators.
- By Application: Emergency Shutdown Systems (ESD) dominate the application segment, driven by stringent regulatory requirements across various industries.
- By End-User: The oil and gas sector accounts for the largest share, followed by chemicals and petrochemicals.
Key Drivers for Dominant Regions:
- China: Massive industrial expansion, government investments in infrastructure, and growing adoption of advanced technologies.
- India: Rapid industrialization, burgeoning energy sector, and increasing focus on safety regulations.
- Japan: Advanced industrial base, robust technological capabilities, and strict regulatory frameworks.
The dominance of certain segments and countries is primarily attributed to factors like stringent safety regulations, industrial growth, and the adoption of sophisticated technologies.
APAP Safety Instrumented Systems Market Product Innovations
Recent innovations focus on enhancing system reliability, improving diagnostics, and integrating advanced technologies. The adoption of artificial intelligence (AI) and machine learning (ML) for predictive maintenance and improved safety analysis is gaining traction. Wireless communication technologies are improving system flexibility and reducing installation costs. Miniaturization of components and the development of modular systems are contributing to enhanced flexibility and reduced maintenance requirements. Unique selling propositions often center on enhanced diagnostic capabilities, reduced downtime, and seamless integration with existing plant systems.
Propelling Factors for APAC Safety Instrumented Systems Market Growth
Several factors are driving growth in the APAC SIS market. Stringent safety regulations across various industries are mandating the adoption of SIS, particularly in sectors such as oil and gas, chemicals, and power generation. The growing industrialization and infrastructure development in several APAC countries are fueling demand for advanced SIS solutions. Technological advancements, such as AI-powered predictive maintenance and IoT-enabled remote monitoring, are improving system efficiency and reliability, driving adoption. Government initiatives promoting industrial safety and automation are further boosting market growth. For example, initiatives focused on digital transformation in key industries are encouraging the integration of advanced SIS technologies.
Obstacles in the APAC Safety Instrumented Systems Market
The APAC SIS market faces several challenges. The high initial investment costs associated with implementing SIS can be a barrier for smaller companies. Supply chain disruptions and the volatility of raw material prices can impact the production and availability of SIS components. Competition from established players and the emergence of new entrants create competitive pressures, affecting pricing and market share. Lack of skilled personnel for installation, maintenance, and operation of SIS can hinder market growth. Regulatory variations and complex approval processes across different countries can also present hurdles. These factors are estimated to reduce market growth by approximately xx% during the forecast period.
Future Opportunities in APAC Safety Instrumented Systems Market
The APAC SIS market presents numerous future opportunities. The growing adoption of Industry 4.0 and the integration of IoT and AI technologies will offer new avenues for innovation and development. The expansion of renewable energy sources, like solar and wind power, will necessitate advanced safety systems, creating new demand. Increasing focus on cybersecurity within industrial automation will drive demand for secure SIS solutions. Emerging markets in Southeast Asia present significant growth potential, as industrialization and infrastructure development gather pace.
Major Players in the APAC Safety Instrumented Systems Market Ecosystem
- Honeywell International Inc
- ABB Ltd
- SIS-TECH Solutions LP
- Siemens AG
- Schneider Electric SE
- HIMA Paul Hildebrandt GmbH
- Rockwell Automation Inc
- Schlumberger Limite
- Yokogawa Electric Corporation
- Emerson Electric Company
Key Developments in APAC Safety Instrumented Systems Market Industry
- June 2021: Emerson Electric announced the incorporation of MTP into its DeltaV and PACSystems automation systems, simplifying integration and reducing costs for end-users.
Strategic APAC Safety Instrumented Systems Market Forecast
The APAC SIS market is poised for significant growth, driven by increasing industrialization, stringent safety regulations, and technological advancements. The integration of AI, IoT, and other advanced technologies will further enhance system capabilities, leading to greater adoption. Expanding into emerging markets and focusing on customized solutions will be critical for success. The market's robust growth trajectory is expected to continue throughout the forecast period, presenting lucrative opportunities for both established players and new entrants.
APAC Safety Instrumented Systems Market Segmentation
-
1. Component
- 1.1. Sensors
- 1.2. Switches
- 1.3. Programmable Devices
- 1.4. Actuators and Valves
- 1.5. Other Components
-
2. Application
- 2.1. Emergency Shutdown Systems (ESD)
- 2.2. Fire and Gas Monitoring and Control (F&GC)
- 2.3. High Integrity Pressure Protection Systems (HIPPS)
- 2.4. Burner Management Systems (BMS)
- 2.5. Turbo Machinery Control
- 2.6. Other Applications
-
3. End-User
- 3.1. Chemicals and Petrochemicals
- 3.2. Power Generation
- 3.3. Pharmaceutical
- 3.4. Food and Beverage
- 3.5. Oil and Gas
- 3.6. Other End-Users
APAC Safety Instrumented Systems Market Segmentation By Geography
-
1. North America
- 1.1. United States
- 1.2. Canada
- 1.3. Mexico
-
2. South America
- 2.1. Brazil
- 2.2. Argentina
- 2.3. Rest of South America
-
3. Europe
- 3.1. United Kingdom
- 3.2. Germany
- 3.3. France
- 3.4. Italy
- 3.5. Spain
- 3.6. Russia
- 3.7. Benelux
- 3.8. Nordics
- 3.9. Rest of Europe
-
4. Middle East & Africa
- 4.1. Turkey
- 4.2. Israel
- 4.3. GCC
- 4.4. North Africa
- 4.5. South Africa
- 4.6. Rest of Middle East & Africa
-
5. Asia Pacific
- 5.1. China
- 5.2. India
- 5.3. Japan
- 5.4. South Korea
- 5.5. ASEAN
- 5.6. Oceania
- 5.7. Rest of Asia Pacific
APAC Safety Instrumented Systems Market REPORT HIGHLIGHTS
| Aspects | Details |
|---|---|
| Study Period | 2019-2033 |
| Base Year | 2024 |
| Estimated Year | 2025 |
| Forecast Period | 2025-2033 |
| Historical Period | 2019-2024 |
| Growth Rate | CAGR of 12.50% from 2019-2033 |
| Segmentation |
|
Table of Contents
- 1. Introduction
- 1.1. Research Scope
- 1.2. Market Segmentation
- 1.3. Research Methodology
- 1.4. Definitions and Assumptions
- 2. Executive Summary
- 2.1. Introduction
- 3. Market Dynamics
- 3.1. Introduction
- 3.2. Market Drivers
- 3.2.1. Growing Regulatory Environment in the Industry; Presence of Robust SIS Service Ecosystem
- 3.3. Market Restrains
- 3.3.1. Operational Complexity Coupled with High Maintenance Costs
- 3.4. Market Trends
- 3.4.1. Food and Beverage Hold the Major Market Share
- 4. Market Factor Analysis
- 4.1. Porters Five Forces
- 4.2. Supply/Value Chain
- 4.3. PESTEL analysis
- 4.4. Market Entropy
- 4.5. Patent/Trademark Analysis
- 5. Global APAC Safety Instrumented Systems Market Analysis, Insights and Forecast, 2019-2031
- 5.1. Market Analysis, Insights and Forecast - by Component
- 5.1.1. Sensors
- 5.1.2. Switches
- 5.1.3. Programmable Devices
- 5.1.4. Actuators and Valves
- 5.1.5. Other Components
- 5.2. Market Analysis, Insights and Forecast - by Application
- 5.2.1. Emergency Shutdown Systems (ESD)
- 5.2.2. Fire and Gas Monitoring and Control (F&GC)
- 5.2.3. High Integrity Pressure Protection Systems (HIPPS)
- 5.2.4. Burner Management Systems (BMS)
- 5.2.5. Turbo Machinery Control
- 5.2.6. Other Applications
- 5.3. Market Analysis, Insights and Forecast - by End-User
- 5.3.1. Chemicals and Petrochemicals
- 5.3.2. Power Generation
- 5.3.3. Pharmaceutical
- 5.3.4. Food and Beverage
- 5.3.5. Oil and Gas
- 5.3.6. Other End-Users
- 5.4. Market Analysis, Insights and Forecast - by Region
- 5.4.1. North America
- 5.4.2. South America
- 5.4.3. Europe
- 5.4.4. Middle East & Africa
- 5.4.5. Asia Pacific
- 5.1. Market Analysis, Insights and Forecast - by Component
- 6. North America APAC Safety Instrumented Systems Market Analysis, Insights and Forecast, 2019-2031
- 6.1. Market Analysis, Insights and Forecast - by Component
- 6.1.1. Sensors
- 6.1.2. Switches
- 6.1.3. Programmable Devices
- 6.1.4. Actuators and Valves
- 6.1.5. Other Components
- 6.2. Market Analysis, Insights and Forecast - by Application
- 6.2.1. Emergency Shutdown Systems (ESD)
- 6.2.2. Fire and Gas Monitoring and Control (F&GC)
- 6.2.3. High Integrity Pressure Protection Systems (HIPPS)
- 6.2.4. Burner Management Systems (BMS)
- 6.2.5. Turbo Machinery Control
- 6.2.6. Other Applications
- 6.3. Market Analysis, Insights and Forecast - by End-User
- 6.3.1. Chemicals and Petrochemicals
- 6.3.2. Power Generation
- 6.3.3. Pharmaceutical
- 6.3.4. Food and Beverage
- 6.3.5. Oil and Gas
- 6.3.6. Other End-Users
- 6.1. Market Analysis, Insights and Forecast - by Component
- 7. South America APAC Safety Instrumented Systems Market Analysis, Insights and Forecast, 2019-2031
- 7.1. Market Analysis, Insights and Forecast - by Component
- 7.1.1. Sensors
- 7.1.2. Switches
- 7.1.3. Programmable Devices
- 7.1.4. Actuators and Valves
- 7.1.5. Other Components
- 7.2. Market Analysis, Insights and Forecast - by Application
- 7.2.1. Emergency Shutdown Systems (ESD)
- 7.2.2. Fire and Gas Monitoring and Control (F&GC)
- 7.2.3. High Integrity Pressure Protection Systems (HIPPS)
- 7.2.4. Burner Management Systems (BMS)
- 7.2.5. Turbo Machinery Control
- 7.2.6. Other Applications
- 7.3. Market Analysis, Insights and Forecast - by End-User
- 7.3.1. Chemicals and Petrochemicals
- 7.3.2. Power Generation
- 7.3.3. Pharmaceutical
- 7.3.4. Food and Beverage
- 7.3.5. Oil and Gas
- 7.3.6. Other End-Users
- 7.1. Market Analysis, Insights and Forecast - by Component
- 8. Europe APAC Safety Instrumented Systems Market Analysis, Insights and Forecast, 2019-2031
- 8.1. Market Analysis, Insights and Forecast - by Component
- 8.1.1. Sensors
- 8.1.2. Switches
- 8.1.3. Programmable Devices
- 8.1.4. Actuators and Valves
- 8.1.5. Other Components
- 8.2. Market Analysis, Insights and Forecast - by Application
- 8.2.1. Emergency Shutdown Systems (ESD)
- 8.2.2. Fire and Gas Monitoring and Control (F&GC)
- 8.2.3. High Integrity Pressure Protection Systems (HIPPS)
- 8.2.4. Burner Management Systems (BMS)
- 8.2.5. Turbo Machinery Control
- 8.2.6. Other Applications
- 8.3. Market Analysis, Insights and Forecast - by End-User
- 8.3.1. Chemicals and Petrochemicals
- 8.3.2. Power Generation
- 8.3.3. Pharmaceutical
- 8.3.4. Food and Beverage
- 8.3.5. Oil and Gas
- 8.3.6. Other End-Users
- 8.1. Market Analysis, Insights and Forecast - by Component
- 9. Middle East & Africa APAC Safety Instrumented Systems Market Analysis, Insights and Forecast, 2019-2031
- 9.1. Market Analysis, Insights and Forecast - by Component
- 9.1.1. Sensors
- 9.1.2. Switches
- 9.1.3. Programmable Devices
- 9.1.4. Actuators and Valves
- 9.1.5. Other Components
- 9.2. Market Analysis, Insights and Forecast - by Application
- 9.2.1. Emergency Shutdown Systems (ESD)
- 9.2.2. Fire and Gas Monitoring and Control (F&GC)
- 9.2.3. High Integrity Pressure Protection Systems (HIPPS)
- 9.2.4. Burner Management Systems (BMS)
- 9.2.5. Turbo Machinery Control
- 9.2.6. Other Applications
- 9.3. Market Analysis, Insights and Forecast - by End-User
- 9.3.1. Chemicals and Petrochemicals
- 9.3.2. Power Generation
- 9.3.3. Pharmaceutical
- 9.3.4. Food and Beverage
- 9.3.5. Oil and Gas
- 9.3.6. Other End-Users
- 9.1. Market Analysis, Insights and Forecast - by Component
- 10. Asia Pacific APAC Safety Instrumented Systems Market Analysis, Insights and Forecast, 2019-2031
- 10.1. Market Analysis, Insights and Forecast - by Component
- 10.1.1. Sensors
- 10.1.2. Switches
- 10.1.3. Programmable Devices
- 10.1.4. Actuators and Valves
- 10.1.5. Other Components
- 10.2. Market Analysis, Insights and Forecast - by Application
- 10.2.1. Emergency Shutdown Systems (ESD)
- 10.2.2. Fire and Gas Monitoring and Control (F&GC)
- 10.2.3. High Integrity Pressure Protection Systems (HIPPS)
- 10.2.4. Burner Management Systems (BMS)
- 10.2.5. Turbo Machinery Control
- 10.2.6. Other Applications
- 10.3. Market Analysis, Insights and Forecast - by End-User
- 10.3.1. Chemicals and Petrochemicals
- 10.3.2. Power Generation
- 10.3.3. Pharmaceutical
- 10.3.4. Food and Beverage
- 10.3.5. Oil and Gas
- 10.3.6. Other End-Users
- 10.1. Market Analysis, Insights and Forecast - by Component
- 11. North America APAC Safety Instrumented Systems Market Analysis, Insights and Forecast, 2019-2031
- 11.1. Market Analysis, Insights and Forecast - By Country/Sub-region
- 11.1.1 United States
- 11.1.2 Canada
- 12. Europe APAC Safety Instrumented Systems Market Analysis, Insights and Forecast, 2019-2031
- 12.1. Market Analysis, Insights and Forecast - By Country/Sub-region
- 12.1.1 United Kingdom
- 12.1.2 Germany
- 12.1.3 France
- 12.1.4 Rest of Europe
- 13. Asia Pacific APAC Safety Instrumented Systems Market Analysis, Insights and Forecast, 2019-2031
- 13.1. Market Analysis, Insights and Forecast - By Country/Sub-region
- 13.1.1 China
- 13.1.2 Japan
- 13.1.3 India
- 13.1.4 Rest of Asia Pacific
- 14. Latin America APAC Safety Instrumented Systems Market Analysis, Insights and Forecast, 2019-2031
- 14.1. Market Analysis, Insights and Forecast - By Country/Sub-region
- 14.1.1.
- 15. Middle East and Africa APAC Safety Instrumented Systems Market Analysis, Insights and Forecast, 2019-2031
- 15.1. Market Analysis, Insights and Forecast - By Country/Sub-region
- 15.1.1.
- 16. Competitive Analysis
- 16.1. Global Market Share Analysis 2024
- 16.2. Company Profiles
- 16.2.1 Honeywell International Inc
- 16.2.1.1. Overview
- 16.2.1.2. Products
- 16.2.1.3. SWOT Analysis
- 16.2.1.4. Recent Developments
- 16.2.1.5. Financials (Based on Availability)
- 16.2.2 ABB Ltd
- 16.2.2.1. Overview
- 16.2.2.2. Products
- 16.2.2.3. SWOT Analysis
- 16.2.2.4. Recent Developments
- 16.2.2.5. Financials (Based on Availability)
- 16.2.3 SIS-TECH Solutions LP
- 16.2.3.1. Overview
- 16.2.3.2. Products
- 16.2.3.3. SWOT Analysis
- 16.2.3.4. Recent Developments
- 16.2.3.5. Financials (Based on Availability)
- 16.2.4 Siemens AG
- 16.2.4.1. Overview
- 16.2.4.2. Products
- 16.2.4.3. SWOT Analysis
- 16.2.4.4. Recent Developments
- 16.2.4.5. Financials (Based on Availability)
- 16.2.5 Schneider Electric SE
- 16.2.5.1. Overview
- 16.2.5.2. Products
- 16.2.5.3. SWOT Analysis
- 16.2.5.4. Recent Developments
- 16.2.5.5. Financials (Based on Availability)
- 16.2.6 HIMA Paul Hildebrandt GmbH
- 16.2.6.1. Overview
- 16.2.6.2. Products
- 16.2.6.3. SWOT Analysis
- 16.2.6.4. Recent Developments
- 16.2.6.5. Financials (Based on Availability)
- 16.2.7 Rockwell Automation Inc
- 16.2.7.1. Overview
- 16.2.7.2. Products
- 16.2.7.3. SWOT Analysis
- 16.2.7.4. Recent Developments
- 16.2.7.5. Financials (Based on Availability)
- 16.2.8 Schlumberger Limite
- 16.2.8.1. Overview
- 16.2.8.2. Products
- 16.2.8.3. SWOT Analysis
- 16.2.8.4. Recent Developments
- 16.2.8.5. Financials (Based on Availability)
- 16.2.9 Yokogawa Electric Corporation
- 16.2.9.1. Overview
- 16.2.9.2. Products
- 16.2.9.3. SWOT Analysis
- 16.2.9.4. Recent Developments
- 16.2.9.5. Financials (Based on Availability)
- 16.2.10 Emerson Electric Company
- 16.2.10.1. Overview
- 16.2.10.2. Products
- 16.2.10.3. SWOT Analysis
- 16.2.10.4. Recent Developments
- 16.2.10.5. Financials (Based on Availability)
- 16.2.1 Honeywell International Inc
List of Figures
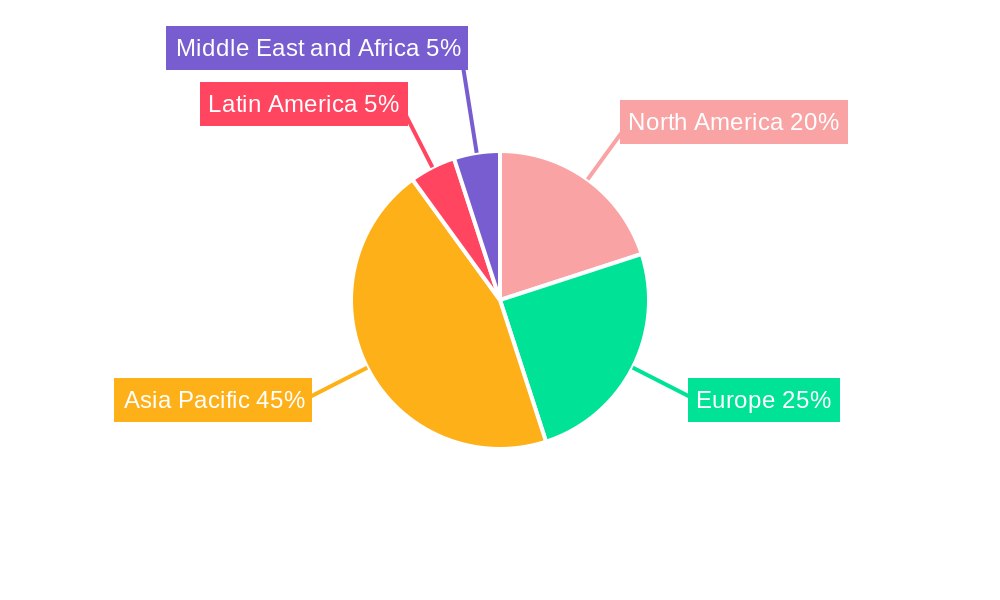
- Figure 1: Global APAC Safety Instrumented Systems Market Revenue Breakdown (Million, %) by Region 2024 & 2032
- Figure 2: North America APAC Safety Instrumented Systems Market Revenue (Million), by Country 2024 & 2032
- Figure 3: North America APAC Safety Instrumented Systems Market Revenue Share (%), by Country 2024 & 2032
- Figure 4: Europe APAC Safety Instrumented Systems Market Revenue (Million), by Country 2024 & 2032
- Figure 5: Europe APAC Safety Instrumented Systems Market Revenue Share (%), by Country 2024 & 2032
- Figure 6: Asia Pacific APAC Safety Instrumented Systems Market Revenue (Million), by Country 2024 & 2032
- Figure 7: Asia Pacific APAC Safety Instrumented Systems Market Revenue Share (%), by Country 2024 & 2032
- Figure 8: Latin America APAC Safety Instrumented Systems Market Revenue (Million), by Country 2024 & 2032
- Figure 9: Latin America APAC Safety Instrumented Systems Market Revenue Share (%), by Country 2024 & 2032
- Figure 10: Middle East and Africa APAC Safety Instrumented Systems Market Revenue (Million), by Country 2024 & 2032
- Figure 11: Middle East and Africa APAC Safety Instrumented Systems Market Revenue Share (%), by Country 2024 & 2032
- Figure 12: North America APAC Safety Instrumented Systems Market Revenue (Million), by Component 2024 & 2032
- Figure 13: North America APAC Safety Instrumented Systems Market Revenue Share (%), by Component 2024 & 2032
- Figure 14: North America APAC Safety Instrumented Systems Market Revenue (Million), by Application 2024 & 2032
- Figure 15: North America APAC Safety Instrumented Systems Market Revenue Share (%), by Application 2024 & 2032
- Figure 16: North America APAC Safety Instrumented Systems Market Revenue (Million), by End-User 2024 & 2032
- Figure 17: North America APAC Safety Instrumented Systems Market Revenue Share (%), by End-User 2024 & 2032
- Figure 18: North America APAC Safety Instrumented Systems Market Revenue (Million), by Country 2024 & 2032
- Figure 19: North America APAC Safety Instrumented Systems Market Revenue Share (%), by Country 2024 & 2032
- Figure 20: South America APAC Safety Instrumented Systems Market Revenue (Million), by Component 2024 & 2032
- Figure 21: South America APAC Safety Instrumented Systems Market Revenue Share (%), by Component 2024 & 2032
- Figure 22: South America APAC Safety Instrumented Systems Market Revenue (Million), by Application 2024 & 2032
- Figure 23: South America APAC Safety Instrumented Systems Market Revenue Share (%), by Application 2024 & 2032
- Figure 24: South America APAC Safety Instrumented Systems Market Revenue (Million), by End-User 2024 & 2032
- Figure 25: South America APAC Safety Instrumented Systems Market Revenue Share (%), by End-User 2024 & 2032
- Figure 26: South America APAC Safety Instrumented Systems Market Revenue (Million), by Country 2024 & 2032
- Figure 27: South America APAC Safety Instrumented Systems Market Revenue Share (%), by Country 2024 & 2032
- Figure 28: Europe APAC Safety Instrumented Systems Market Revenue (Million), by Component 2024 & 2032
- Figure 29: Europe APAC Safety Instrumented Systems Market Revenue Share (%), by Component 2024 & 2032
- Figure 30: Europe APAC Safety Instrumented Systems Market Revenue (Million), by Application 2024 & 2032
- Figure 31: Europe APAC Safety Instrumented Systems Market Revenue Share (%), by Application 2024 & 2032
- Figure 32: Europe APAC Safety Instrumented Systems Market Revenue (Million), by End-User 2024 & 2032
- Figure 33: Europe APAC Safety Instrumented Systems Market Revenue Share (%), by End-User 2024 & 2032
- Figure 34: Europe APAC Safety Instrumented Systems Market Revenue (Million), by Country 2024 & 2032
- Figure 35: Europe APAC Safety Instrumented Systems Market Revenue Share (%), by Country 2024 & 2032
- Figure 36: Middle East & Africa APAC Safety Instrumented Systems Market Revenue (Million), by Component 2024 & 2032
- Figure 37: Middle East & Africa APAC Safety Instrumented Systems Market Revenue Share (%), by Component 2024 & 2032
- Figure 38: Middle East & Africa APAC Safety Instrumented Systems Market Revenue (Million), by Application 2024 & 2032
- Figure 39: Middle East & Africa APAC Safety Instrumented Systems Market Revenue Share (%), by Application 2024 & 2032
- Figure 40: Middle East & Africa APAC Safety Instrumented Systems Market Revenue (Million), by End-User 2024 & 2032
- Figure 41: Middle East & Africa APAC Safety Instrumented Systems Market Revenue Share (%), by End-User 2024 & 2032
- Figure 42: Middle East & Africa APAC Safety Instrumented Systems Market Revenue (Million), by Country 2024 & 2032
- Figure 43: Middle East & Africa APAC Safety Instrumented Systems Market Revenue Share (%), by Country 2024 & 2032
- Figure 44: Asia Pacific APAC Safety Instrumented Systems Market Revenue (Million), by Component 2024 & 2032
- Figure 45: Asia Pacific APAC Safety Instrumented Systems Market Revenue Share (%), by Component 2024 & 2032
- Figure 46: Asia Pacific APAC Safety Instrumented Systems Market Revenue (Million), by Application 2024 & 2032
- Figure 47: Asia Pacific APAC Safety Instrumented Systems Market Revenue Share (%), by Application 2024 & 2032
- Figure 48: Asia Pacific APAC Safety Instrumented Systems Market Revenue (Million), by End-User 2024 & 2032
- Figure 49: Asia Pacific APAC Safety Instrumented Systems Market Revenue Share (%), by End-User 2024 & 2032
- Figure 50: Asia Pacific APAC Safety Instrumented Systems Market Revenue (Million), by Country 2024 & 2032
- Figure 51: Asia Pacific APAC Safety Instrumented Systems Market Revenue Share (%), by Country 2024 & 2032
List of Tables
- Table 1: Global APAC Safety Instrumented Systems Market Revenue Million Forecast, by Region 2019 & 2032
- Table 2: Global APAC Safety Instrumented Systems Market Revenue Million Forecast, by Component 2019 & 2032
- Table 3: Global APAC Safety Instrumented Systems Market Revenue Million Forecast, by Application 2019 & 2032
- Table 4: Global APAC Safety Instrumented Systems Market Revenue Million Forecast, by End-User 2019 & 2032
- Table 5: Global APAC Safety Instrumented Systems Market Revenue Million Forecast, by Region 2019 & 2032
- Table 6: Global APAC Safety Instrumented Systems Market Revenue Million Forecast, by Country 2019 & 2032
- Table 7: United States APAC Safety Instrumented Systems Market Revenue (Million) Forecast, by Application 2019 & 2032
- Table 8: Canada APAC Safety Instrumented Systems Market Revenue (Million) Forecast, by Application 2019 & 2032
- Table 9: Global APAC Safety Instrumented Systems Market Revenue Million Forecast, by Country 2019 & 2032
- Table 10: United Kingdom APAC Safety Instrumented Systems Market Revenue (Million) Forecast, by Application 2019 & 2032
- Table 11: Germany APAC Safety Instrumented Systems Market Revenue (Million) Forecast, by Application 2019 & 2032
- Table 12: France APAC Safety Instrumented Systems Market Revenue (Million) Forecast, by Application 2019 & 2032
- Table 13: Rest of Europe APAC Safety Instrumented Systems Market Revenue (Million) Forecast, by Application 2019 & 2032
- Table 14: Global APAC Safety Instrumented Systems Market Revenue Million Forecast, by Country 2019 & 2032
- Table 15: China APAC Safety Instrumented Systems Market Revenue (Million) Forecast, by Application 2019 & 2032
- Table 16: Japan APAC Safety Instrumented Systems Market Revenue (Million) Forecast, by Application 2019 & 2032
- Table 17: India APAC Safety Instrumented Systems Market Revenue (Million) Forecast, by Application 2019 & 2032
- Table 18: Rest of Asia Pacific APAC Safety Instrumented Systems Market Revenue (Million) Forecast, by Application 2019 & 2032
- Table 19: Global APAC Safety Instrumented Systems Market Revenue Million Forecast, by Country 2019 & 2032
- Table 20: APAC Safety Instrumented Systems Market Revenue (Million) Forecast, by Application 2019 & 2032
- Table 21: Global APAC Safety Instrumented Systems Market Revenue Million Forecast, by Country 2019 & 2032
- Table 22: APAC Safety Instrumented Systems Market Revenue (Million) Forecast, by Application 2019 & 2032
- Table 23: Global APAC Safety Instrumented Systems Market Revenue Million Forecast, by Component 2019 & 2032
- Table 24: Global APAC Safety Instrumented Systems Market Revenue Million Forecast, by Application 2019 & 2032
- Table 25: Global APAC Safety Instrumented Systems Market Revenue Million Forecast, by End-User 2019 & 2032
- Table 26: Global APAC Safety Instrumented Systems Market Revenue Million Forecast, by Country 2019 & 2032
- Table 27: United States APAC Safety Instrumented Systems Market Revenue (Million) Forecast, by Application 2019 & 2032
- Table 28: Canada APAC Safety Instrumented Systems Market Revenue (Million) Forecast, by Application 2019 & 2032
- Table 29: Mexico APAC Safety Instrumented Systems Market Revenue (Million) Forecast, by Application 2019 & 2032
- Table 30: Global APAC Safety Instrumented Systems Market Revenue Million Forecast, by Component 2019 & 2032
- Table 31: Global APAC Safety Instrumented Systems Market Revenue Million Forecast, by Application 2019 & 2032
- Table 32: Global APAC Safety Instrumented Systems Market Revenue Million Forecast, by End-User 2019 & 2032
- Table 33: Global APAC Safety Instrumented Systems Market Revenue Million Forecast, by Country 2019 & 2032
- Table 34: Brazil APAC Safety Instrumented Systems Market Revenue (Million) Forecast, by Application 2019 & 2032
- Table 35: Argentina APAC Safety Instrumented Systems Market Revenue (Million) Forecast, by Application 2019 & 2032
- Table 36: Rest of South America APAC Safety Instrumented Systems Market Revenue (Million) Forecast, by Application 2019 & 2032
- Table 37: Global APAC Safety Instrumented Systems Market Revenue Million Forecast, by Component 2019 & 2032
- Table 38: Global APAC Safety Instrumented Systems Market Revenue Million Forecast, by Application 2019 & 2032
- Table 39: Global APAC Safety Instrumented Systems Market Revenue Million Forecast, by End-User 2019 & 2032
- Table 40: Global APAC Safety Instrumented Systems Market Revenue Million Forecast, by Country 2019 & 2032
- Table 41: United Kingdom APAC Safety Instrumented Systems Market Revenue (Million) Forecast, by Application 2019 & 2032
- Table 42: Germany APAC Safety Instrumented Systems Market Revenue (Million) Forecast, by Application 2019 & 2032
- Table 43: France APAC Safety Instrumented Systems Market Revenue (Million) Forecast, by Application 2019 & 2032
- Table 44: Italy APAC Safety Instrumented Systems Market Revenue (Million) Forecast, by Application 2019 & 2032
- Table 45: Spain APAC Safety Instrumented Systems Market Revenue (Million) Forecast, by Application 2019 & 2032
- Table 46: Russia APAC Safety Instrumented Systems Market Revenue (Million) Forecast, by Application 2019 & 2032
- Table 47: Benelux APAC Safety Instrumented Systems Market Revenue (Million) Forecast, by Application 2019 & 2032
- Table 48: Nordics APAC Safety Instrumented Systems Market Revenue (Million) Forecast, by Application 2019 & 2032
- Table 49: Rest of Europe APAC Safety Instrumented Systems Market Revenue (Million) Forecast, by Application 2019 & 2032
- Table 50: Global APAC Safety Instrumented Systems Market Revenue Million Forecast, by Component 2019 & 2032
- Table 51: Global APAC Safety Instrumented Systems Market Revenue Million Forecast, by Application 2019 & 2032
- Table 52: Global APAC Safety Instrumented Systems Market Revenue Million Forecast, by End-User 2019 & 2032
- Table 53: Global APAC Safety Instrumented Systems Market Revenue Million Forecast, by Country 2019 & 2032
- Table 54: Turkey APAC Safety Instrumented Systems Market Revenue (Million) Forecast, by Application 2019 & 2032
- Table 55: Israel APAC Safety Instrumented Systems Market Revenue (Million) Forecast, by Application 2019 & 2032
- Table 56: GCC APAC Safety Instrumented Systems Market Revenue (Million) Forecast, by Application 2019 & 2032
- Table 57: North Africa APAC Safety Instrumented Systems Market Revenue (Million) Forecast, by Application 2019 & 2032
- Table 58: South Africa APAC Safety Instrumented Systems Market Revenue (Million) Forecast, by Application 2019 & 2032
- Table 59: Rest of Middle East & Africa APAC Safety Instrumented Systems Market Revenue (Million) Forecast, by Application 2019 & 2032
- Table 60: Global APAC Safety Instrumented Systems Market Revenue Million Forecast, by Component 2019 & 2032
- Table 61: Global APAC Safety Instrumented Systems Market Revenue Million Forecast, by Application 2019 & 2032
- Table 62: Global APAC Safety Instrumented Systems Market Revenue Million Forecast, by End-User 2019 & 2032
- Table 63: Global APAC Safety Instrumented Systems Market Revenue Million Forecast, by Country 2019 & 2032
- Table 64: China APAC Safety Instrumented Systems Market Revenue (Million) Forecast, by Application 2019 & 2032
- Table 65: India APAC Safety Instrumented Systems Market Revenue (Million) Forecast, by Application 2019 & 2032
- Table 66: Japan APAC Safety Instrumented Systems Market Revenue (Million) Forecast, by Application 2019 & 2032
- Table 67: South Korea APAC Safety Instrumented Systems Market Revenue (Million) Forecast, by Application 2019 & 2032
- Table 68: ASEAN APAC Safety Instrumented Systems Market Revenue (Million) Forecast, by Application 2019 & 2032
- Table 69: Oceania APAC Safety Instrumented Systems Market Revenue (Million) Forecast, by Application 2019 & 2032
- Table 70: Rest of Asia Pacific APAC Safety Instrumented Systems Market Revenue (Million) Forecast, by Application 2019 & 2032
Frequently Asked Questions
1. What is the projected Compound Annual Growth Rate (CAGR) of the APAC Safety Instrumented Systems Market?
The projected CAGR is approximately 12.50%.
2. Which companies are prominent players in the APAC Safety Instrumented Systems Market?
Key companies in the market include Honeywell International Inc, ABB Ltd, SIS-TECH Solutions LP, Siemens AG, Schneider Electric SE, HIMA Paul Hildebrandt GmbH, Rockwell Automation Inc, Schlumberger Limite, Yokogawa Electric Corporation, Emerson Electric Company.
3. What are the main segments of the APAC Safety Instrumented Systems Market?
The market segments include Component, Application, End-User.
4. Can you provide details about the market size?
The market size is estimated to be USD XX Million as of 2022.
5. What are some drivers contributing to market growth?
Growing Regulatory Environment in the Industry; Presence of Robust SIS Service Ecosystem.
6. What are the notable trends driving market growth?
Food and Beverage Hold the Major Market Share.
7. Are there any restraints impacting market growth?
Operational Complexity Coupled with High Maintenance Costs.
8. Can you provide examples of recent developments in the market?
June 2021 - Emerson Electric announced that it had incorporated MTP into its DeltaV and PACSystems automation systems. Emerson eliminated the requirement for end-users or system integrators to invest in additional engineering or special integration tools. Such innovation activities are driving the growth of the market.
9. What pricing options are available for accessing the report?
Pricing options include single-user, multi-user, and enterprise licenses priced at USD 4750, USD 4950, and USD 6800 respectively.
10. Is the market size provided in terms of value or volume?
The market size is provided in terms of value, measured in Million.
11. Are there any specific market keywords associated with the report?
Yes, the market keyword associated with the report is "APAC Safety Instrumented Systems Market," which aids in identifying and referencing the specific market segment covered.
12. How do I determine which pricing option suits my needs best?
The pricing options vary based on user requirements and access needs. Individual users may opt for single-user licenses, while businesses requiring broader access may choose multi-user or enterprise licenses for cost-effective access to the report.
13. Are there any additional resources or data provided in the APAC Safety Instrumented Systems Market report?
While the report offers comprehensive insights, it's advisable to review the specific contents or supplementary materials provided to ascertain if additional resources or data are available.
14. How can I stay updated on further developments or reports in the APAC Safety Instrumented Systems Market?
To stay informed about further developments, trends, and reports in the APAC Safety Instrumented Systems Market, consider subscribing to industry newsletters, following relevant companies and organizations, or regularly checking reputable industry news sources and publications.
Methodology
Step 1 - Identification of Relevant Samples Size from Population Database


Step 2 - Approaches for Defining Global Market Size (Value, Volume* & Price*)

Note*: In applicable scenarios
Step 3 - Data Sources
Primary Research
- Web Analytics
- Survey Reports
- Research Institute
- Latest Research Reports
- Opinion Leaders
Secondary Research
- Annual Reports
- White Paper
- Latest Press Release
- Industry Association
- Paid Database
- Investor Presentations

Step 4 - Data Triangulation
Involves using different sources of information in order to increase the validity of a study
These sources are likely to be stakeholders in a program - participants, other researchers, program staff, other community members, and so on.
Then we put all data in single framework & apply various statistical tools to find out the dynamic on the market.
During the analysis stage, feedback from the stakeholder groups would be compared to determine areas of agreement as well as areas of divergence
