

Key Insights
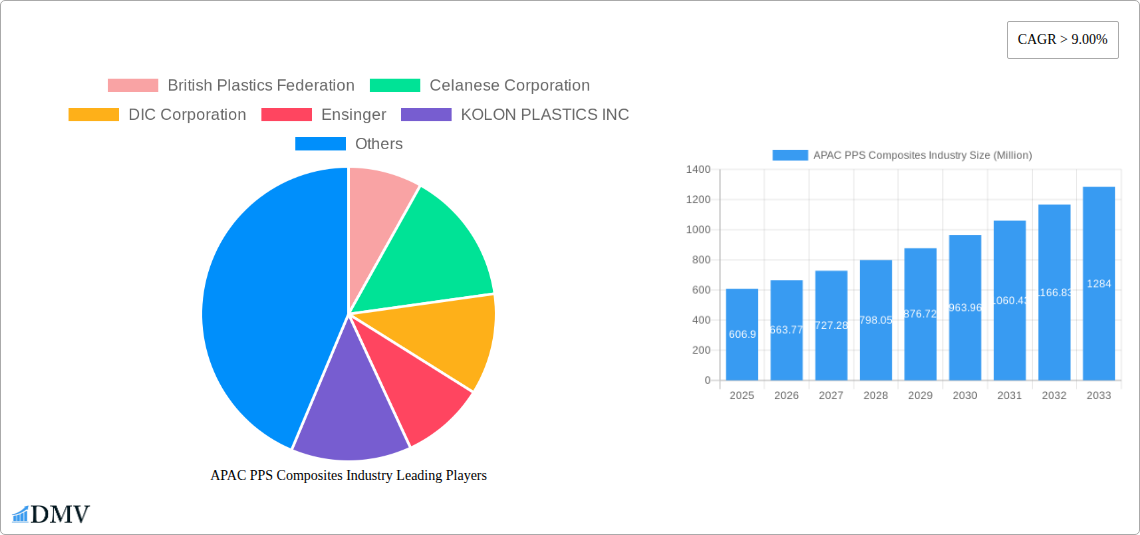
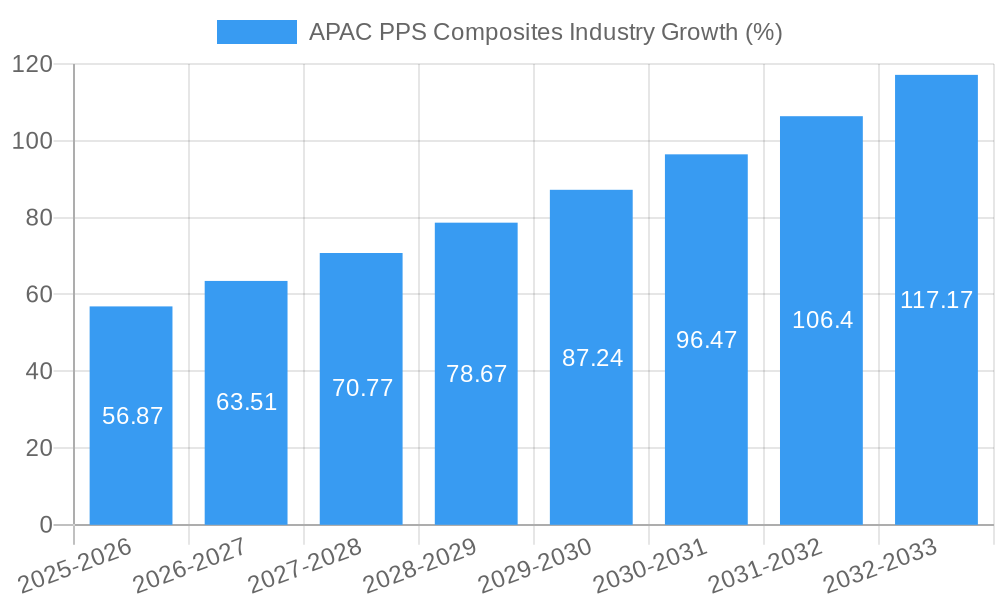
The APAC PPS Composites market, valued at $606.90 million in 2025, is projected to experience robust growth, exceeding a 9% CAGR from 2025 to 2033. This expansion is driven by several key factors. The increasing demand for lightweight, high-performance materials in the automotive and electronics sectors within the region fuels significant market traction. The rising adoption of electric vehicles (EVs) further boosts demand, as PPS composites offer superior thermal stability and resistance to harsh environments, crucial for EV battery components and electric motor housings. Furthermore, advancements in manufacturing processes and the development of novel PPS composite formulations with enhanced properties are contributing to market growth. Stringent emission regulations and the increasing focus on fuel efficiency across various industries are also strong drivers. While potential supply chain disruptions and fluctuations in raw material prices could pose challenges, the overall market outlook remains positive due to the sustained growth in key end-use sectors.
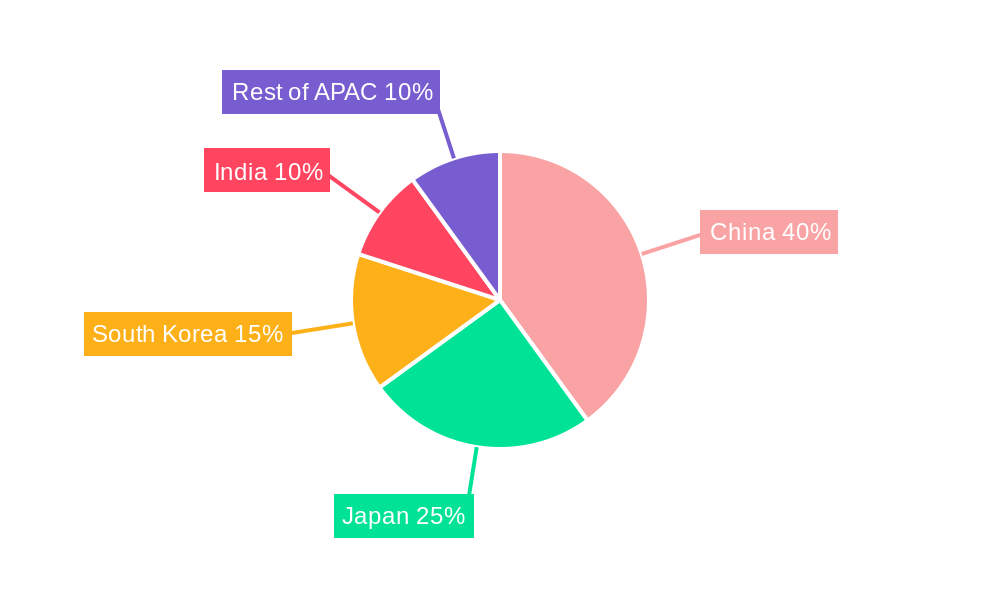
The competitive landscape is characterized by a mix of global and regional players, including British Plastics Federation, Celanese Corporation, DIC Corporation, and others. These companies are strategically investing in research and development to introduce innovative PPS composite solutions tailored to specific application needs. The market is also witnessing increased collaborations between material suppliers and manufacturers to optimize product design and streamline production processes. Strong government initiatives promoting sustainable materials and manufacturing practices in APAC further contribute to the market's positive trajectory. The segmentation of the market likely includes applications across automotive, electronics, aerospace, and industrial sectors, with each segment experiencing varying growth rates based on individual industry dynamics and adoption rates of PPS composites. The regional distribution within APAC will likely see significant contributions from China, Japan, South Korea, and India, reflecting their diverse industrial bases and expanding manufacturing capabilities.
APAC PPS Composites Industry Market Report: 2019-2033
This comprehensive report provides a detailed analysis of the Asia-Pacific (APAC) polyphenylene sulfide (PPS) composites industry, offering invaluable insights for stakeholders seeking to navigate this dynamic market. Covering the period from 2019 to 2033, with a base year of 2025 and a forecast period extending to 2033, this report unveils market trends, growth drivers, challenges, and future opportunities. The study meticulously examines market composition, technological advancements, and competitive landscapes, providing crucial data points for informed decision-making. The market size is expected to reach xx Million by 2033.
APAC PPS Composites Industry Market Composition & Trends
This section delves into the intricate structure of the APAC PPS composites market, assessing market concentration, innovation drivers, regulatory landscapes, substitute products, end-user profiles, and merger and acquisition (M&A) activities. The report analyzes market share distribution among key players, revealing the competitive intensity and the potential for disruption. M&A deal values are examined, highlighting strategic investments and industry consolidation. The impact of evolving regulations on market dynamics is also assessed.
- Market Concentration: The APAC PPS composites market exhibits a moderately concentrated structure, with a few major players holding significant market share. The report quantifies this concentration using metrics like the Herfindahl-Hirschman Index (HHI) and provides a detailed analysis of market share distribution. xx% of the market is held by the top 5 players.
- Innovation Catalysts: The market is driven by ongoing innovation in materials science, resulting in lighter, stronger, and more durable PPS composites. Specific examples of innovations driving market expansion are highlighted, including advancements in material properties like thermal stability, chemical resistance and the development of specialized compounds for various applications.
- Regulatory Landscape: Government regulations concerning material safety, environmental impact, and product standards significantly influence the APAC PPS composites market. The report analyzes relevant regulations and their impact on market growth and sustainability practices.
- Substitute Products: Competition from alternative materials, such as other high-performance polymers, is analyzed. The report assesses the competitive advantages of PPS composites against these substitutes.
- End-User Profiles: The report segments end-users into key sectors such as automotive, electronics, aerospace, and industrial machinery, providing a detailed analysis of each sector’s demand drivers and consumption patterns.
- M&A Activities: The report tracks major M&A activities in the APAC PPS composites industry during the study period (2019-2024), analyzing deal values and their implications for market consolidation and competitive dynamics. Total M&A deal value during 2019-2024 is estimated at xx Million.
APAC PPS Composites Industry Industry Evolution
This section provides a comprehensive overview of the APAC PPS composites industry’s evolution, tracing its growth trajectory, analyzing technological advancements, and examining shifting consumer demands. The report incorporates specific data points, such as compound annual growth rates (CAGR) and adoption metrics, to illuminate the industry's dynamic landscape. Factors influencing growth trajectories, including technological advancements, economic shifts, and evolving consumer preferences are deeply analyzed. The report analyzes the impact of these factors on market size and segmentation. The market is projected to grow at a CAGR of xx% during the forecast period (2025-2033).
Leading Regions, Countries, or Segments in APAC PPS Composites Industry
This section pinpoints the dominant regions, countries, and segments within the APAC PPS composites market. The analysis delves into the factors driving their dominance, incorporating in-depth explanations of investment trends and supportive regulatory environments.
- Key Drivers for Dominance:
- China: High demand from automotive and electronics industries, substantial government investments in infrastructure and manufacturing.
- Japan: Technological leadership, strong presence of major PPS manufacturers, well-established supply chains.
- South Korea: Focus on technological innovation and export-oriented economy.
- In-depth Analysis: The report provides granular analysis for each region and segment, exploring factors influencing its dominance, including production capacity, investment in R&D, and regulatory frameworks. The report also details the competitive landscape within each region.
APAC PPS Composites Industry Product Innovations
This section showcases recent product innovations within the APAC PPS composites industry, highlighting their unique selling propositions and technological advancements. The report analyzes the applications of these new products, along with their performance metrics, illustrating their impact on market dynamics. Key innovations include the development of high-performance compounds with enhanced thermal stability, chemical resistance, and mechanical strength. New formulations are enabling applications in extreme environments, leading to increased market adoption.
Propelling Factors for APAC PPS Composites Industry Growth
Several factors propel the growth of the APAC PPS composites industry. These include technological advancements leading to superior material properties, robust economic growth in many APAC nations boosting industrial activity, and supportive government regulations promoting the adoption of advanced materials. The increasing demand from sectors like automotive, electronics, and aerospace also plays a significant role.
Obstacles in the APAC PPS Composites Industry Market
Despite significant growth potential, the APAC PPS composites market faces several obstacles. These include stringent environmental regulations impacting production costs, potential supply chain disruptions due to geopolitical factors, and intense competition among established players. Fluctuations in raw material prices also add to cost volatility.
Future Opportunities in APAC PPS Composites Industry
The APAC PPS composites industry holds immense future potential. Emerging markets in Southeast Asia are presenting significant opportunities for expansion, while technological innovations such as high-performance composites and customized solutions cater to specific application needs. The increasing adoption of electric vehicles and the expanding 5G infrastructure are also significant drivers of growth.
Major Players in the APAC PPS Composites Industry Ecosystem
- British Plastics Federation
- Celanese Corporation
- DIC Corporation
- Ensinger
- KOLON PLASTICS INC
- KUREHA CORPORATION
- Polyplastics Co Ltd
- RTP Company
- SABIC
- SGL Carbon
- Solvay
- STARCHEM LLC
- Teijin Limited
- Tosoh Corporation
- Xiamen LFT Composite Plastic Co Ltd
*List Not Exhaustive
Key Developments in APAC PPS Composites Industry Industry
- November 2022: Polyplastics Co., Ltd. expanded its compound capacity at its (Nantong) Ltd. PPS resin production plant, increasing annual production capacity from 9,000 to 21,400 tons. The expansion significantly increases global supply of PPS resin and strengthens Polyplastics' position in the market. The plant will be operational from January 2025.
- April 2022: SABIC launched LNP THERMOCOMP OFC08V, a glass fiber-reinforced PPS compound designed for 5G base station dipole antennas and other electrical and electronic applications. This launch expands the applications of PPS composites in the high-growth 5G sector.
Strategic APAC PPS Composites Industry Market Forecast
The APAC PPS composites market is poised for substantial growth driven by strong demand from diverse end-use sectors, ongoing technological advancements, and supportive government policies. The market's growth trajectory will be shaped by several factors, including expansion in emerging markets, adoption of advanced composites in new applications, and increasing investment in R&D. The long-term outlook remains exceptionally positive, indicating considerable market potential for innovative players.
APAC PPS Composites Industry Segmentation
-
1. Type
- 1.1. Carbon Fiber-Reinforced Composites
- 1.2. Glass Fiber-Reinforced Composites
- 1.3. Other Ty
-
2. End-user Industry
- 2.1. Aerospace and Defense
- 2.2. Automotive
- 2.3. Oil and Gas
- 2.4. Electrical and Electronics
- 2.5. Industrial
- 2.6. Other En
-
3. Geography
- 3.1. China
- 3.2. India
- 3.3. Japan
- 3.4. South Korea
- 3.5. ASEAN Countries
- 3.6. Rest of Asia-Pacific
APAC PPS Composites Industry Segmentation By Geography
- 1. China
- 2. India
- 3. Japan
- 4. South Korea
- 5. ASEAN Countries
- 6. Rest of Asia Pacific
APAC PPS Composites Industry REPORT HIGHLIGHTS
| Aspects | Details |
|---|---|
| Study Period | 2019-2033 |
| Base Year | 2024 |
| Estimated Year | 2025 |
| Forecast Period | 2025-2033 |
| Historical Period | 2019-2024 |
| Growth Rate | CAGR of > 9.00% from 2019-2033 |
| Segmentation |
|
Table of Contents
- 1. Introduction
- 1.1. Research Scope
- 1.2. Market Segmentation
- 1.3. Research Methodology
- 1.4. Definitions and Assumptions
- 2. Executive Summary
- 2.1. Introduction
- 3. Market Dynamics
- 3.1. Introduction
- 3.2. Market Drivers
- 3.2.1. Rising Demand from Aerospace and Defense; Increasing Demand from Oil and Gas Sector; Other Drivers
- 3.3. Market Restrains
- 3.3.1. Rising Demand from Aerospace and Defense; Increasing Demand from Oil and Gas Sector; Other Drivers
- 3.4. Market Trends
- 3.4.1. Aerospace and Defense Sector to Drive the Polyphenylene Sulfide (PPS) Composites Market
- 4. Market Factor Analysis
- 4.1. Porters Five Forces
- 4.2. Supply/Value Chain
- 4.3. PESTEL analysis
- 4.4. Market Entropy
- 4.5. Patent/Trademark Analysis
- 5. Global APAC PPS Composites Industry Analysis, Insights and Forecast, 2019-2031
- 5.1. Market Analysis, Insights and Forecast - by Type
- 5.1.1. Carbon Fiber-Reinforced Composites
- 5.1.2. Glass Fiber-Reinforced Composites
- 5.1.3. Other Ty
- 5.2. Market Analysis, Insights and Forecast - by End-user Industry
- 5.2.1. Aerospace and Defense
- 5.2.2. Automotive
- 5.2.3. Oil and Gas
- 5.2.4. Electrical and Electronics
- 5.2.5. Industrial
- 5.2.6. Other En
- 5.3. Market Analysis, Insights and Forecast - by Geography
- 5.3.1. China
- 5.3.2. India
- 5.3.3. Japan
- 5.3.4. South Korea
- 5.3.5. ASEAN Countries
- 5.3.6. Rest of Asia-Pacific
- 5.4. Market Analysis, Insights and Forecast - by Region
- 5.4.1. China
- 5.4.2. India
- 5.4.3. Japan
- 5.4.4. South Korea
- 5.4.5. ASEAN Countries
- 5.4.6. Rest of Asia Pacific
- 5.1. Market Analysis, Insights and Forecast - by Type
- 6. China APAC PPS Composites Industry Analysis, Insights and Forecast, 2019-2031
- 6.1. Market Analysis, Insights and Forecast - by Type
- 6.1.1. Carbon Fiber-Reinforced Composites
- 6.1.2. Glass Fiber-Reinforced Composites
- 6.1.3. Other Ty
- 6.2. Market Analysis, Insights and Forecast - by End-user Industry
- 6.2.1. Aerospace and Defense
- 6.2.2. Automotive
- 6.2.3. Oil and Gas
- 6.2.4. Electrical and Electronics
- 6.2.5. Industrial
- 6.2.6. Other En
- 6.3. Market Analysis, Insights and Forecast - by Geography
- 6.3.1. China
- 6.3.2. India
- 6.3.3. Japan
- 6.3.4. South Korea
- 6.3.5. ASEAN Countries
- 6.3.6. Rest of Asia-Pacific
- 6.1. Market Analysis, Insights and Forecast - by Type
- 7. India APAC PPS Composites Industry Analysis, Insights and Forecast, 2019-2031
- 7.1. Market Analysis, Insights and Forecast - by Type
- 7.1.1. Carbon Fiber-Reinforced Composites
- 7.1.2. Glass Fiber-Reinforced Composites
- 7.1.3. Other Ty
- 7.2. Market Analysis, Insights and Forecast - by End-user Industry
- 7.2.1. Aerospace and Defense
- 7.2.2. Automotive
- 7.2.3. Oil and Gas
- 7.2.4. Electrical and Electronics
- 7.2.5. Industrial
- 7.2.6. Other En
- 7.3. Market Analysis, Insights and Forecast - by Geography
- 7.3.1. China
- 7.3.2. India
- 7.3.3. Japan
- 7.3.4. South Korea
- 7.3.5. ASEAN Countries
- 7.3.6. Rest of Asia-Pacific
- 7.1. Market Analysis, Insights and Forecast - by Type
- 8. Japan APAC PPS Composites Industry Analysis, Insights and Forecast, 2019-2031
- 8.1. Market Analysis, Insights and Forecast - by Type
- 8.1.1. Carbon Fiber-Reinforced Composites
- 8.1.2. Glass Fiber-Reinforced Composites
- 8.1.3. Other Ty
- 8.2. Market Analysis, Insights and Forecast - by End-user Industry
- 8.2.1. Aerospace and Defense
- 8.2.2. Automotive
- 8.2.3. Oil and Gas
- 8.2.4. Electrical and Electronics
- 8.2.5. Industrial
- 8.2.6. Other En
- 8.3. Market Analysis, Insights and Forecast - by Geography
- 8.3.1. China
- 8.3.2. India
- 8.3.3. Japan
- 8.3.4. South Korea
- 8.3.5. ASEAN Countries
- 8.3.6. Rest of Asia-Pacific
- 8.1. Market Analysis, Insights and Forecast - by Type
- 9. South Korea APAC PPS Composites Industry Analysis, Insights and Forecast, 2019-2031
- 9.1. Market Analysis, Insights and Forecast - by Type
- 9.1.1. Carbon Fiber-Reinforced Composites
- 9.1.2. Glass Fiber-Reinforced Composites
- 9.1.3. Other Ty
- 9.2. Market Analysis, Insights and Forecast - by End-user Industry
- 9.2.1. Aerospace and Defense
- 9.2.2. Automotive
- 9.2.3. Oil and Gas
- 9.2.4. Electrical and Electronics
- 9.2.5. Industrial
- 9.2.6. Other En
- 9.3. Market Analysis, Insights and Forecast - by Geography
- 9.3.1. China
- 9.3.2. India
- 9.3.3. Japan
- 9.3.4. South Korea
- 9.3.5. ASEAN Countries
- 9.3.6. Rest of Asia-Pacific
- 9.1. Market Analysis, Insights and Forecast - by Type
- 10. ASEAN Countries APAC PPS Composites Industry Analysis, Insights and Forecast, 2019-2031
- 10.1. Market Analysis, Insights and Forecast - by Type
- 10.1.1. Carbon Fiber-Reinforced Composites
- 10.1.2. Glass Fiber-Reinforced Composites
- 10.1.3. Other Ty
- 10.2. Market Analysis, Insights and Forecast - by End-user Industry
- 10.2.1. Aerospace and Defense
- 10.2.2. Automotive
- 10.2.3. Oil and Gas
- 10.2.4. Electrical and Electronics
- 10.2.5. Industrial
- 10.2.6. Other En
- 10.3. Market Analysis, Insights and Forecast - by Geography
- 10.3.1. China
- 10.3.2. India
- 10.3.3. Japan
- 10.3.4. South Korea
- 10.3.5. ASEAN Countries
- 10.3.6. Rest of Asia-Pacific
- 10.1. Market Analysis, Insights and Forecast - by Type
- 11. Rest of Asia Pacific APAC PPS Composites Industry Analysis, Insights and Forecast, 2019-2031
- 11.1. Market Analysis, Insights and Forecast - by Type
- 11.1.1. Carbon Fiber-Reinforced Composites
- 11.1.2. Glass Fiber-Reinforced Composites
- 11.1.3. Other Ty
- 11.2. Market Analysis, Insights and Forecast - by End-user Industry
- 11.2.1. Aerospace and Defense
- 11.2.2. Automotive
- 11.2.3. Oil and Gas
- 11.2.4. Electrical and Electronics
- 11.2.5. Industrial
- 11.2.6. Other En
- 11.3. Market Analysis, Insights and Forecast - by Geography
- 11.3.1. China
- 11.3.2. India
- 11.3.3. Japan
- 11.3.4. South Korea
- 11.3.5. ASEAN Countries
- 11.3.6. Rest of Asia-Pacific
- 11.1. Market Analysis, Insights and Forecast - by Type
- 12. Competitive Analysis
- 12.1. Global Market Share Analysis 2024
- 12.2. Company Profiles
- 12.2.1 British Plastics Federation
- 12.2.1.1. Overview
- 12.2.1.2. Products
- 12.2.1.3. SWOT Analysis
- 12.2.1.4. Recent Developments
- 12.2.1.5. Financials (Based on Availability)
- 12.2.2 Celanese Corporation
- 12.2.2.1. Overview
- 12.2.2.2. Products
- 12.2.2.3. SWOT Analysis
- 12.2.2.4. Recent Developments
- 12.2.2.5. Financials (Based on Availability)
- 12.2.3 DIC Corporation
- 12.2.3.1. Overview
- 12.2.3.2. Products
- 12.2.3.3. SWOT Analysis
- 12.2.3.4. Recent Developments
- 12.2.3.5. Financials (Based on Availability)
- 12.2.4 Ensinger
- 12.2.4.1. Overview
- 12.2.4.2. Products
- 12.2.4.3. SWOT Analysis
- 12.2.4.4. Recent Developments
- 12.2.4.5. Financials (Based on Availability)
- 12.2.5 KOLON PLASTICS INC
- 12.2.5.1. Overview
- 12.2.5.2. Products
- 12.2.5.3. SWOT Analysis
- 12.2.5.4. Recent Developments
- 12.2.5.5. Financials (Based on Availability)
- 12.2.6 KUREHA CORPORATION
- 12.2.6.1. Overview
- 12.2.6.2. Products
- 12.2.6.3. SWOT Analysis
- 12.2.6.4. Recent Developments
- 12.2.6.5. Financials (Based on Availability)
- 12.2.7 Polyplastics Co Ltd
- 12.2.7.1. Overview
- 12.2.7.2. Products
- 12.2.7.3. SWOT Analysis
- 12.2.7.4. Recent Developments
- 12.2.7.5. Financials (Based on Availability)
- 12.2.8 RTP Company
- 12.2.8.1. Overview
- 12.2.8.2. Products
- 12.2.8.3. SWOT Analysis
- 12.2.8.4. Recent Developments
- 12.2.8.5. Financials (Based on Availability)
- 12.2.9 SABIC
- 12.2.9.1. Overview
- 12.2.9.2. Products
- 12.2.9.3. SWOT Analysis
- 12.2.9.4. Recent Developments
- 12.2.9.5. Financials (Based on Availability)
- 12.2.10 SGL Carbon
- 12.2.10.1. Overview
- 12.2.10.2. Products
- 12.2.10.3. SWOT Analysis
- 12.2.10.4. Recent Developments
- 12.2.10.5. Financials (Based on Availability)
- 12.2.11 Solvay
- 12.2.11.1. Overview
- 12.2.11.2. Products
- 12.2.11.3. SWOT Analysis
- 12.2.11.4. Recent Developments
- 12.2.11.5. Financials (Based on Availability)
- 12.2.12 STARCHEM LLC
- 12.2.12.1. Overview
- 12.2.12.2. Products
- 12.2.12.3. SWOT Analysis
- 12.2.12.4. Recent Developments
- 12.2.12.5. Financials (Based on Availability)
- 12.2.13 Teijin Limited
- 12.2.13.1. Overview
- 12.2.13.2. Products
- 12.2.13.3. SWOT Analysis
- 12.2.13.4. Recent Developments
- 12.2.13.5. Financials (Based on Availability)
- 12.2.14 Tosoh Corporation
- 12.2.14.1. Overview
- 12.2.14.2. Products
- 12.2.14.3. SWOT Analysis
- 12.2.14.4. Recent Developments
- 12.2.14.5. Financials (Based on Availability)
- 12.2.15 Xiamen LFT Composite Plastic Co Ltd*List Not Exhaustive
- 12.2.15.1. Overview
- 12.2.15.2. Products
- 12.2.15.3. SWOT Analysis
- 12.2.15.4. Recent Developments
- 12.2.15.5. Financials (Based on Availability)
- 12.2.1 British Plastics Federation
List of Figures
- Figure 1: Global APAC PPS Composites Industry Revenue Breakdown (Million, %) by Region 2024 & 2032
- Figure 2: Global APAC PPS Composites Industry Volume Breakdown (Million, %) by Region 2024 & 2032
- Figure 3: China APAC PPS Composites Industry Revenue (Million), by Type 2024 & 2032
- Figure 4: China APAC PPS Composites Industry Volume (Million), by Type 2024 & 2032
- Figure 5: China APAC PPS Composites Industry Revenue Share (%), by Type 2024 & 2032
- Figure 6: China APAC PPS Composites Industry Volume Share (%), by Type 2024 & 2032
- Figure 7: China APAC PPS Composites Industry Revenue (Million), by End-user Industry 2024 & 2032
- Figure 8: China APAC PPS Composites Industry Volume (Million), by End-user Industry 2024 & 2032
- Figure 9: China APAC PPS Composites Industry Revenue Share (%), by End-user Industry 2024 & 2032
- Figure 10: China APAC PPS Composites Industry Volume Share (%), by End-user Industry 2024 & 2032
- Figure 11: China APAC PPS Composites Industry Revenue (Million), by Geography 2024 & 2032
- Figure 12: China APAC PPS Composites Industry Volume (Million), by Geography 2024 & 2032
- Figure 13: China APAC PPS Composites Industry Revenue Share (%), by Geography 2024 & 2032
- Figure 14: China APAC PPS Composites Industry Volume Share (%), by Geography 2024 & 2032
- Figure 15: China APAC PPS Composites Industry Revenue (Million), by Country 2024 & 2032
- Figure 16: China APAC PPS Composites Industry Volume (Million), by Country 2024 & 2032
- Figure 17: China APAC PPS Composites Industry Revenue Share (%), by Country 2024 & 2032
- Figure 18: China APAC PPS Composites Industry Volume Share (%), by Country 2024 & 2032
- Figure 19: India APAC PPS Composites Industry Revenue (Million), by Type 2024 & 2032
- Figure 20: India APAC PPS Composites Industry Volume (Million), by Type 2024 & 2032
- Figure 21: India APAC PPS Composites Industry Revenue Share (%), by Type 2024 & 2032
- Figure 22: India APAC PPS Composites Industry Volume Share (%), by Type 2024 & 2032
- Figure 23: India APAC PPS Composites Industry Revenue (Million), by End-user Industry 2024 & 2032
- Figure 24: India APAC PPS Composites Industry Volume (Million), by End-user Industry 2024 & 2032
- Figure 25: India APAC PPS Composites Industry Revenue Share (%), by End-user Industry 2024 & 2032
- Figure 26: India APAC PPS Composites Industry Volume Share (%), by End-user Industry 2024 & 2032
- Figure 27: India APAC PPS Composites Industry Revenue (Million), by Geography 2024 & 2032
- Figure 28: India APAC PPS Composites Industry Volume (Million), by Geography 2024 & 2032
- Figure 29: India APAC PPS Composites Industry Revenue Share (%), by Geography 2024 & 2032
- Figure 30: India APAC PPS Composites Industry Volume Share (%), by Geography 2024 & 2032
- Figure 31: India APAC PPS Composites Industry Revenue (Million), by Country 2024 & 2032
- Figure 32: India APAC PPS Composites Industry Volume (Million), by Country 2024 & 2032
- Figure 33: India APAC PPS Composites Industry Revenue Share (%), by Country 2024 & 2032
- Figure 34: India APAC PPS Composites Industry Volume Share (%), by Country 2024 & 2032
- Figure 35: Japan APAC PPS Composites Industry Revenue (Million), by Type 2024 & 2032
- Figure 36: Japan APAC PPS Composites Industry Volume (Million), by Type 2024 & 2032
- Figure 37: Japan APAC PPS Composites Industry Revenue Share (%), by Type 2024 & 2032
- Figure 38: Japan APAC PPS Composites Industry Volume Share (%), by Type 2024 & 2032
- Figure 39: Japan APAC PPS Composites Industry Revenue (Million), by End-user Industry 2024 & 2032
- Figure 40: Japan APAC PPS Composites Industry Volume (Million), by End-user Industry 2024 & 2032
- Figure 41: Japan APAC PPS Composites Industry Revenue Share (%), by End-user Industry 2024 & 2032
- Figure 42: Japan APAC PPS Composites Industry Volume Share (%), by End-user Industry 2024 & 2032
- Figure 43: Japan APAC PPS Composites Industry Revenue (Million), by Geography 2024 & 2032
- Figure 44: Japan APAC PPS Composites Industry Volume (Million), by Geography 2024 & 2032
- Figure 45: Japan APAC PPS Composites Industry Revenue Share (%), by Geography 2024 & 2032
- Figure 46: Japan APAC PPS Composites Industry Volume Share (%), by Geography 2024 & 2032
- Figure 47: Japan APAC PPS Composites Industry Revenue (Million), by Country 2024 & 2032
- Figure 48: Japan APAC PPS Composites Industry Volume (Million), by Country 2024 & 2032
- Figure 49: Japan APAC PPS Composites Industry Revenue Share (%), by Country 2024 & 2032
- Figure 50: Japan APAC PPS Composites Industry Volume Share (%), by Country 2024 & 2032
- Figure 51: South Korea APAC PPS Composites Industry Revenue (Million), by Type 2024 & 2032
- Figure 52: South Korea APAC PPS Composites Industry Volume (Million), by Type 2024 & 2032
- Figure 53: South Korea APAC PPS Composites Industry Revenue Share (%), by Type 2024 & 2032
- Figure 54: South Korea APAC PPS Composites Industry Volume Share (%), by Type 2024 & 2032
- Figure 55: South Korea APAC PPS Composites Industry Revenue (Million), by End-user Industry 2024 & 2032
- Figure 56: South Korea APAC PPS Composites Industry Volume (Million), by End-user Industry 2024 & 2032
- Figure 57: South Korea APAC PPS Composites Industry Revenue Share (%), by End-user Industry 2024 & 2032
- Figure 58: South Korea APAC PPS Composites Industry Volume Share (%), by End-user Industry 2024 & 2032
- Figure 59: South Korea APAC PPS Composites Industry Revenue (Million), by Geography 2024 & 2032
- Figure 60: South Korea APAC PPS Composites Industry Volume (Million), by Geography 2024 & 2032
- Figure 61: South Korea APAC PPS Composites Industry Revenue Share (%), by Geography 2024 & 2032
- Figure 62: South Korea APAC PPS Composites Industry Volume Share (%), by Geography 2024 & 2032
- Figure 63: South Korea APAC PPS Composites Industry Revenue (Million), by Country 2024 & 2032
- Figure 64: South Korea APAC PPS Composites Industry Volume (Million), by Country 2024 & 2032
- Figure 65: South Korea APAC PPS Composites Industry Revenue Share (%), by Country 2024 & 2032
- Figure 66: South Korea APAC PPS Composites Industry Volume Share (%), by Country 2024 & 2032
- Figure 67: ASEAN Countries APAC PPS Composites Industry Revenue (Million), by Type 2024 & 2032
- Figure 68: ASEAN Countries APAC PPS Composites Industry Volume (Million), by Type 2024 & 2032
- Figure 69: ASEAN Countries APAC PPS Composites Industry Revenue Share (%), by Type 2024 & 2032
- Figure 70: ASEAN Countries APAC PPS Composites Industry Volume Share (%), by Type 2024 & 2032
- Figure 71: ASEAN Countries APAC PPS Composites Industry Revenue (Million), by End-user Industry 2024 & 2032
- Figure 72: ASEAN Countries APAC PPS Composites Industry Volume (Million), by End-user Industry 2024 & 2032
- Figure 73: ASEAN Countries APAC PPS Composites Industry Revenue Share (%), by End-user Industry 2024 & 2032
- Figure 74: ASEAN Countries APAC PPS Composites Industry Volume Share (%), by End-user Industry 2024 & 2032
- Figure 75: ASEAN Countries APAC PPS Composites Industry Revenue (Million), by Geography 2024 & 2032
- Figure 76: ASEAN Countries APAC PPS Composites Industry Volume (Million), by Geography 2024 & 2032
- Figure 77: ASEAN Countries APAC PPS Composites Industry Revenue Share (%), by Geography 2024 & 2032
- Figure 78: ASEAN Countries APAC PPS Composites Industry Volume Share (%), by Geography 2024 & 2032
- Figure 79: ASEAN Countries APAC PPS Composites Industry Revenue (Million), by Country 2024 & 2032
- Figure 80: ASEAN Countries APAC PPS Composites Industry Volume (Million), by Country 2024 & 2032
- Figure 81: ASEAN Countries APAC PPS Composites Industry Revenue Share (%), by Country 2024 & 2032
- Figure 82: ASEAN Countries APAC PPS Composites Industry Volume Share (%), by Country 2024 & 2032
- Figure 83: Rest of Asia Pacific APAC PPS Composites Industry Revenue (Million), by Type 2024 & 2032
- Figure 84: Rest of Asia Pacific APAC PPS Composites Industry Volume (Million), by Type 2024 & 2032
- Figure 85: Rest of Asia Pacific APAC PPS Composites Industry Revenue Share (%), by Type 2024 & 2032
- Figure 86: Rest of Asia Pacific APAC PPS Composites Industry Volume Share (%), by Type 2024 & 2032
- Figure 87: Rest of Asia Pacific APAC PPS Composites Industry Revenue (Million), by End-user Industry 2024 & 2032
- Figure 88: Rest of Asia Pacific APAC PPS Composites Industry Volume (Million), by End-user Industry 2024 & 2032
- Figure 89: Rest of Asia Pacific APAC PPS Composites Industry Revenue Share (%), by End-user Industry 2024 & 2032
- Figure 90: Rest of Asia Pacific APAC PPS Composites Industry Volume Share (%), by End-user Industry 2024 & 2032
- Figure 91: Rest of Asia Pacific APAC PPS Composites Industry Revenue (Million), by Geography 2024 & 2032
- Figure 92: Rest of Asia Pacific APAC PPS Composites Industry Volume (Million), by Geography 2024 & 2032
- Figure 93: Rest of Asia Pacific APAC PPS Composites Industry Revenue Share (%), by Geography 2024 & 2032
- Figure 94: Rest of Asia Pacific APAC PPS Composites Industry Volume Share (%), by Geography 2024 & 2032
- Figure 95: Rest of Asia Pacific APAC PPS Composites Industry Revenue (Million), by Country 2024 & 2032
- Figure 96: Rest of Asia Pacific APAC PPS Composites Industry Volume (Million), by Country 2024 & 2032
- Figure 97: Rest of Asia Pacific APAC PPS Composites Industry Revenue Share (%), by Country 2024 & 2032
- Figure 98: Rest of Asia Pacific APAC PPS Composites Industry Volume Share (%), by Country 2024 & 2032
List of Tables
- Table 1: Global APAC PPS Composites Industry Revenue Million Forecast, by Region 2019 & 2032
- Table 2: Global APAC PPS Composites Industry Volume Million Forecast, by Region 2019 & 2032
- Table 3: Global APAC PPS Composites Industry Revenue Million Forecast, by Type 2019 & 2032
- Table 4: Global APAC PPS Composites Industry Volume Million Forecast, by Type 2019 & 2032
- Table 5: Global APAC PPS Composites Industry Revenue Million Forecast, by End-user Industry 2019 & 2032
- Table 6: Global APAC PPS Composites Industry Volume Million Forecast, by End-user Industry 2019 & 2032
- Table 7: Global APAC PPS Composites Industry Revenue Million Forecast, by Geography 2019 & 2032
- Table 8: Global APAC PPS Composites Industry Volume Million Forecast, by Geography 2019 & 2032
- Table 9: Global APAC PPS Composites Industry Revenue Million Forecast, by Region 2019 & 2032
- Table 10: Global APAC PPS Composites Industry Volume Million Forecast, by Region 2019 & 2032
- Table 11: Global APAC PPS Composites Industry Revenue Million Forecast, by Type 2019 & 2032
- Table 12: Global APAC PPS Composites Industry Volume Million Forecast, by Type 2019 & 2032
- Table 13: Global APAC PPS Composites Industry Revenue Million Forecast, by End-user Industry 2019 & 2032
- Table 14: Global APAC PPS Composites Industry Volume Million Forecast, by End-user Industry 2019 & 2032
- Table 15: Global APAC PPS Composites Industry Revenue Million Forecast, by Geography 2019 & 2032
- Table 16: Global APAC PPS Composites Industry Volume Million Forecast, by Geography 2019 & 2032
- Table 17: Global APAC PPS Composites Industry Revenue Million Forecast, by Country 2019 & 2032
- Table 18: Global APAC PPS Composites Industry Volume Million Forecast, by Country 2019 & 2032
- Table 19: Global APAC PPS Composites Industry Revenue Million Forecast, by Type 2019 & 2032
- Table 20: Global APAC PPS Composites Industry Volume Million Forecast, by Type 2019 & 2032
- Table 21: Global APAC PPS Composites Industry Revenue Million Forecast, by End-user Industry 2019 & 2032
- Table 22: Global APAC PPS Composites Industry Volume Million Forecast, by End-user Industry 2019 & 2032
- Table 23: Global APAC PPS Composites Industry Revenue Million Forecast, by Geography 2019 & 2032
- Table 24: Global APAC PPS Composites Industry Volume Million Forecast, by Geography 2019 & 2032
- Table 25: Global APAC PPS Composites Industry Revenue Million Forecast, by Country 2019 & 2032
- Table 26: Global APAC PPS Composites Industry Volume Million Forecast, by Country 2019 & 2032
- Table 27: Global APAC PPS Composites Industry Revenue Million Forecast, by Type 2019 & 2032
- Table 28: Global APAC PPS Composites Industry Volume Million Forecast, by Type 2019 & 2032
- Table 29: Global APAC PPS Composites Industry Revenue Million Forecast, by End-user Industry 2019 & 2032
- Table 30: Global APAC PPS Composites Industry Volume Million Forecast, by End-user Industry 2019 & 2032
- Table 31: Global APAC PPS Composites Industry Revenue Million Forecast, by Geography 2019 & 2032
- Table 32: Global APAC PPS Composites Industry Volume Million Forecast, by Geography 2019 & 2032
- Table 33: Global APAC PPS Composites Industry Revenue Million Forecast, by Country 2019 & 2032
- Table 34: Global APAC PPS Composites Industry Volume Million Forecast, by Country 2019 & 2032
- Table 35: Global APAC PPS Composites Industry Revenue Million Forecast, by Type 2019 & 2032
- Table 36: Global APAC PPS Composites Industry Volume Million Forecast, by Type 2019 & 2032
- Table 37: Global APAC PPS Composites Industry Revenue Million Forecast, by End-user Industry 2019 & 2032
- Table 38: Global APAC PPS Composites Industry Volume Million Forecast, by End-user Industry 2019 & 2032
- Table 39: Global APAC PPS Composites Industry Revenue Million Forecast, by Geography 2019 & 2032
- Table 40: Global APAC PPS Composites Industry Volume Million Forecast, by Geography 2019 & 2032
- Table 41: Global APAC PPS Composites Industry Revenue Million Forecast, by Country 2019 & 2032
- Table 42: Global APAC PPS Composites Industry Volume Million Forecast, by Country 2019 & 2032
- Table 43: Global APAC PPS Composites Industry Revenue Million Forecast, by Type 2019 & 2032
- Table 44: Global APAC PPS Composites Industry Volume Million Forecast, by Type 2019 & 2032
- Table 45: Global APAC PPS Composites Industry Revenue Million Forecast, by End-user Industry 2019 & 2032
- Table 46: Global APAC PPS Composites Industry Volume Million Forecast, by End-user Industry 2019 & 2032
- Table 47: Global APAC PPS Composites Industry Revenue Million Forecast, by Geography 2019 & 2032
- Table 48: Global APAC PPS Composites Industry Volume Million Forecast, by Geography 2019 & 2032
- Table 49: Global APAC PPS Composites Industry Revenue Million Forecast, by Country 2019 & 2032
- Table 50: Global APAC PPS Composites Industry Volume Million Forecast, by Country 2019 & 2032
- Table 51: Global APAC PPS Composites Industry Revenue Million Forecast, by Type 2019 & 2032
- Table 52: Global APAC PPS Composites Industry Volume Million Forecast, by Type 2019 & 2032
- Table 53: Global APAC PPS Composites Industry Revenue Million Forecast, by End-user Industry 2019 & 2032
- Table 54: Global APAC PPS Composites Industry Volume Million Forecast, by End-user Industry 2019 & 2032
- Table 55: Global APAC PPS Composites Industry Revenue Million Forecast, by Geography 2019 & 2032
- Table 56: Global APAC PPS Composites Industry Volume Million Forecast, by Geography 2019 & 2032
- Table 57: Global APAC PPS Composites Industry Revenue Million Forecast, by Country 2019 & 2032
- Table 58: Global APAC PPS Composites Industry Volume Million Forecast, by Country 2019 & 2032
Frequently Asked Questions
1. What is the projected Compound Annual Growth Rate (CAGR) of the APAC PPS Composites Industry?
The projected CAGR is approximately > 9.00%.
2. Which companies are prominent players in the APAC PPS Composites Industry?
Key companies in the market include British Plastics Federation, Celanese Corporation, DIC Corporation, Ensinger, KOLON PLASTICS INC, KUREHA CORPORATION, Polyplastics Co Ltd, RTP Company, SABIC, SGL Carbon, Solvay, STARCHEM LLC, Teijin Limited, Tosoh Corporation, Xiamen LFT Composite Plastic Co Ltd*List Not Exhaustive.
3. What are the main segments of the APAC PPS Composites Industry?
The market segments include Type, End-user Industry, Geography.
4. Can you provide details about the market size?
The market size is estimated to be USD 606.90 Million as of 2022.
5. What are some drivers contributing to market growth?
Rising Demand from Aerospace and Defense; Increasing Demand from Oil and Gas Sector; Other Drivers.
6. What are the notable trends driving market growth?
Aerospace and Defense Sector to Drive the Polyphenylene Sulfide (PPS) Composites Market.
7. Are there any restraints impacting market growth?
Rising Demand from Aerospace and Defense; Increasing Demand from Oil and Gas Sector; Other Drivers.
8. Can you provide examples of recent developments in the market?
November 2022: Polyplastics Co., Ltd. expanded its compound capacity of (Nantong) Ltd., the PPS resin production plant. The newly expanded capacity will meet the demand for engineering plastics worldwide and increase the annual production capacity from 9,000 to 21,400 tons. The new manufacturing plant will be in operation from January 2025.
9. What pricing options are available for accessing the report?
Pricing options include single-user, multi-user, and enterprise licenses priced at USD 4750, USD 5250, and USD 8750 respectively.
10. Is the market size provided in terms of value or volume?
The market size is provided in terms of value, measured in Million and volume, measured in Million.
11. Are there any specific market keywords associated with the report?
Yes, the market keyword associated with the report is "APAC PPS Composites Industry," which aids in identifying and referencing the specific market segment covered.
12. How do I determine which pricing option suits my needs best?
The pricing options vary based on user requirements and access needs. Individual users may opt for single-user licenses, while businesses requiring broader access may choose multi-user or enterprise licenses for cost-effective access to the report.
13. Are there any additional resources or data provided in the APAC PPS Composites Industry report?
While the report offers comprehensive insights, it's advisable to review the specific contents or supplementary materials provided to ascertain if additional resources or data are available.
14. How can I stay updated on further developments or reports in the APAC PPS Composites Industry?
To stay informed about further developments, trends, and reports in the APAC PPS Composites Industry, consider subscribing to industry newsletters, following relevant companies and organizations, or regularly checking reputable industry news sources and publications.
Methodology
Step 1 - Identification of Relevant Samples Size from Population Database


Step 2 - Approaches for Defining Global Market Size (Value, Volume* & Price*)

Note*: In applicable scenarios
Step 3 - Data Sources
Primary Research
- Web Analytics
- Survey Reports
- Research Institute
- Latest Research Reports
- Opinion Leaders
Secondary Research
- Annual Reports
- White Paper
- Latest Press Release
- Industry Association
- Paid Database
- Investor Presentations

Step 4 - Data Triangulation
Involves using different sources of information in order to increase the validity of a study
These sources are likely to be stakeholders in a program - participants, other researchers, program staff, other community members, and so on.
Then we put all data in single framework & apply various statistical tools to find out the dynamic on the market.
During the analysis stage, feedback from the stakeholder groups would be compared to determine areas of agreement as well as areas of divergence
