

Key Insights
The Asia-Pacific (APAC) payments industry is experiencing robust growth, driven by rising e-commerce adoption, increasing smartphone penetration, and a burgeoning digital economy across the region. The market, valued at $13.93 billion in 2025, is projected to expand at a Compound Annual Growth Rate (CAGR) of 13.32% from 2025 to 2033. This surge is fueled by the increasing preference for digital payment methods, including mobile wallets like Alipay, WeChat Pay, and others, alongside the expansion of online marketplaces and digital services. Countries like China and India are leading this growth, owing to their large populations and rapidly developing digital infrastructures. However, challenges remain, including infrastructure limitations in less developed areas and varying levels of financial literacy across the region. The growth is segmented across various payment modes (online and offline), end-user industries (retail, entertainment, healthcare, hospitality), and countries within APAC. The competitive landscape is dynamic, with both established global players (Visa, Mastercard, PayPal) and local fintech companies (GrabPay, PayCo, KakaoPay) vying for market share. This competition is fostering innovation and driving down transaction costs, benefiting consumers and businesses alike. The continued expansion of digital financial services, coupled with government initiatives to promote financial inclusion, promises further growth in the coming years. Factors such as increasing cybersecurity concerns and regulatory changes will influence the future trajectory of this market.
The diversification of payment methods within the APAC region is a noteworthy aspect of the market's development. While traditional point-of-sale (POS) systems remain important, the rapid adoption of online payment gateways and mobile wallets is transforming the landscape. The growth of super-apps, offering a multitude of services within a single platform, is further integrating payments into daily life. The varying regulatory environments across APAC countries influence the pace of adoption and innovation. While some countries are at the forefront of digital payment adoption, others are still in the early stages of development. Understanding these nuances is crucial for businesses aiming to enter or expand within this diverse and rapidly evolving market. The long-term prospects for the APAC payments industry remain positive, with continuous innovation and increasing digitalization shaping its trajectory. Further growth will be driven by the expansion of e-commerce into underserved markets and the increasing adoption of contactless payment technologies.
APAC Payments Industry: A Comprehensive Market Report (2019-2033)
This insightful report provides a detailed analysis of the Asia-Pacific (APAC) payments industry, covering market trends, leading players, technological advancements, and future growth prospects. The study period spans from 2019 to 2033, with 2025 serving as the base and estimated year. The forecast period extends from 2025 to 2033, while the historical period encompasses 2019-2024. This report is crucial for stakeholders seeking to understand the dynamic landscape of APAC's burgeoning payments sector and navigate its complexities. The report analyzes a market valued at xx Million in 2025, projected to reach xx Million by 2033.

APAC Payments Industry Market Composition & Trends
This section delves into the competitive dynamics of the APAC payments market, evaluating market concentration, innovation drivers, regulatory frameworks, substitute payment methods, end-user profiles, and merger & acquisition (M&A) activities. We analyze the market share distribution amongst key players like Visa Inc, Mastercard Inc, and PayPal Holdings Inc, alongside regional players such as Ipay88 (m) Sdn Bhd and Grab Pay (grab Holdings Limited). The report also quantifies the value of significant M&A deals within the industry during the historical period.
- Market Concentration: Analysis of market share held by top players (e.g., Visa, Mastercard, Alipay, WeChat Pay). Data will show a high concentration in certain segments and more fragmented competition in others.
- Innovation Catalysts: Examination of factors driving innovation, such as the rise of fintech, mobile payments, and open banking.
- Regulatory Landscape: Assessment of the impact of regulations on market growth and competition across different APAC countries.
- Substitute Products: Exploration of alternative payment methods and their influence on the market.
- End-User Profiles: Detailed segmentation of end-users by industry (Retail, Entertainment, Healthcare, Hospitality, etc.) and demographics.
- M&A Activities: Analysis of significant mergers, acquisitions, and joint ventures, including their deal values and strategic implications. xx Million in M&A deal value is estimated in 2024.

APAC Payments Industry Industry Evolution
This section charts the evolution of the APAC payments industry, examining market growth trajectories, technological breakthroughs, and shifting consumer preferences from 2019 to 2033. We analyze the factors driving the transition from traditional methods to digital payments and the increasing adoption of mobile wallets and other innovative solutions. Specific data points like compound annual growth rates (CAGR) and adoption rates for various payment methods will be provided. The increasing adoption of e-commerce and the expanding digital economy significantly influence the industry's growth. For example, the growth rate of online payments in India is projected to be xx% annually, while the adoption rate of mobile wallets in Southeast Asia is expected to reach xx% by 2033.
Leading Regions, Countries, or Segments in APAC Payments Industry
This section pinpoints the dominant regions, countries, and segments within the APAC payments market. The analysis covers By Mode of Payment (Offline/Online), By End-user Industry (Retail, Entertainment, Healthcare, Hospitality, etc.), and By Country (China, India, South Korea, Taiwan, Singapore, Philippines, Malaysia, Indonesia, Vietnam, Australia, Japan).
Key Drivers (Bullet Points):
- Investment Trends: High levels of venture capital investment in fintech startups in countries like China and India.
- Regulatory Support: Government initiatives promoting digital financial inclusion and the development of digital payment infrastructure.
- Consumer Behavior: Rising smartphone penetration and increasing internet usage drive adoption of digital payments.
Dominance Factors (Paragraphs): Detailed analysis of factors contributing to the dominance of specific regions, countries, and segments. For example, China's dominance in mobile payments due to the widespread adoption of Alipay and WeChat Pay. India's growth driven by the success of the Unified Payments Interface (UPI).
APAC Payments Industry Product Innovations
The APAC payments industry is characterized by continuous product innovation, encompassing new payment methods, enhanced security features, and improved user experiences. Recent examples include the proliferation of super apps integrating various payment functionalities and the advancement of biometric authentication technologies for secure transactions. These innovations aim to improve the convenience, security, and efficiency of payments, further driving market growth. Key players are constantly introducing unique selling propositions (USPs) to gain a competitive advantage and cater to evolving consumer demands.
Propelling Factors for APAC Payments Industry Growth
Several factors fuel the growth of the APAC payments industry. Technological advancements, such as the rise of mobile payment platforms and the increasing adoption of digital wallets, are major drivers. Furthermore, supportive government policies promoting financial inclusion and the expansion of e-commerce and the digital economy contribute significantly to this growth. Economic factors, including increasing disposable incomes and a growing middle class, also play a crucial role.
Obstacles in the APAC Payments Industry Market
Despite the significant growth potential, the APAC payments industry faces several obstacles. Regulatory hurdles vary considerably across the region, with certain countries having more stringent regulations than others. Supply chain disruptions can impact the availability of hardware and software needed for payment processing. Intense competition among established players and new entrants creates pressure on profit margins. These factors can potentially hinder the overall growth trajectory of the industry.
Future Opportunities in APAP Payments Industry
The APAP payments industry presents substantial future opportunities, with new technologies and markets driving growth. The expansion of mobile money services in underbanked regions represents a significant avenue for growth. The increasing adoption of blockchain technology and cryptocurrencies is expected to open up novel possibilities in the coming years. Growing acceptance of embedded finance offers new avenues for integration with various services, expanding the addressable market.
Major Players in the APAP Payments Industry Ecosystem
- Ipay88 (m) Sdn Bhd
- Visa Inc
- Naver Corporation (Naver Pay)
- JCB Co Ltd
- Samsung (Samsung Pay)
- Huawei Pay (Huawei Technologies Co Limited)
- Matercard Inc
- Smile Pay
- Toss Financial Services Private Limited
- American Express Company
- Grab Pay (grab Holdings Limited)
- Samsung Pay (Samsung Electronics Co ltd)
- PayCo (NHN Corp )
- Paypal Holdings Inc
- Google Pay (Alphabet Inc )
- kakaopay Corp
Key Developments in APAC Payments Industry Industry
October 2023: The linkage between India's Unified Payments Interface (UPI) and Singapore's PayNow expands the reach of digital payment options, facilitating cross-border transactions. Six Indian banks (Indian Bank, Axis Bank, Bank of Baroda, DBS Bank India, ICICI Bank, Indian Overseas Bank, and State Bank of India) participate in this initiative.
July 2023: Razorpay launches its first international payment gateway, Curlec, in Malaysia, aiming to serve over 5,000 companies and achieve RM10 Billion (approximately xx Million USD) in annualized Gross Transaction Value (GTV) by 2025.
Strategic APAC Payments Industry Market Forecast
The APAC payments industry is poised for robust growth, driven by continued technological advancements, increasing smartphone penetration, expanding e-commerce adoption, and supportive government policies. The rise of super apps, embedded finance, and the potential of blockchain technology present significant opportunities for innovation and market expansion. The market is projected to experience significant growth, driven by these catalysts and expanding into new customer segments and markets. The forecast period sees promising expansion, particularly in Southeast Asia and India.
APAC Payments Industry Segmentation
-
1. Mode of Payment
-
1.1. Offline (Point of Sale)
- 1.1.1. Card Pay
- 1.1.2. Digital Wallets (includes mobile wallets)
- 1.1.3. Cash
- 1.1.4. Other Modes of Payment
-
1.2. Online Sale (E-commerce)
- 1.2.1. Other Mo
-
1.1. Offline (Point of Sale)
-
2. End-user Industry
- 2.1. Retail
- 2.2. Entertainment
- 2.3. Healthcare
- 2.4. Hospitality
- 2.5. Other End-user Industries
APAC Payments Industry Segmentation By Geography
-
1. North America
- 1.1. United States
- 1.2. Canada
- 1.3. Mexico
-
2. South America
- 2.1. Brazil
- 2.2. Argentina
- 2.3. Rest of South America
-
3. Europe
- 3.1. United Kingdom
- 3.2. Germany
- 3.3. France
- 3.4. Italy
- 3.5. Spain
- 3.6. Russia
- 3.7. Benelux
- 3.8. Nordics
- 3.9. Rest of Europe
-
4. Middle East & Africa
- 4.1. Turkey
- 4.2. Israel
- 4.3. GCC
- 4.4. North Africa
- 4.5. South Africa
- 4.6. Rest of Middle East & Africa
-
5. Asia Pacific
- 5.1. China
- 5.2. India
- 5.3. Japan
- 5.4. South Korea
- 5.5. ASEAN
- 5.6. Oceania
- 5.7. Rest of Asia Pacific
APAC Payments Industry REPORT HIGHLIGHTS
| Aspects | Details |
|---|---|
| Study Period | 2019-2033 |
| Base Year | 2024 |
| Estimated Year | 2025 |
| Forecast Period | 2025-2033 |
| Historical Period | 2019-2024 |
| Growth Rate | CAGR of 13.32% from 2019-2033 |
| Segmentation |
|
Table of Contents
- 1. Introduction
- 1.1. Research Scope
- 1.2. Market Segmentation
- 1.3. Research Methodology
- 1.4. Definitions and Assumptions
- 2. Executive Summary
- 2.1. Introduction
- 3. Market Dynamics
- 3.1. Introduction
- 3.2. Market Drivers
- 3.2.1. High Proliferation of E-commerce and Rising Adoption of M-commerce; Enablement Programs by Key Retailers and Government Encouraging Digitization of the Market; Growing Adoption of Buy Now Pay Later in Asia-Pacific Countries
- 3.3. Market Restrains
- 3.3.1. High Implementation and Maintenance Cost
- 3.4. Market Trends
- 3.4.1. Online sales segment to show higher growth
- 4. Market Factor Analysis
- 4.1. Porters Five Forces
- 4.2. Supply/Value Chain
- 4.3. PESTEL analysis
- 4.4. Market Entropy
- 4.5. Patent/Trademark Analysis
- 5. Global APAC Payments Industry Analysis, Insights and Forecast, 2019-2031
- 5.1. Market Analysis, Insights and Forecast - by Mode of Payment
- 5.1.1. Offline (Point of Sale)
- 5.1.1.1. Card Pay
- 5.1.1.2. Digital Wallets (includes mobile wallets)
- 5.1.1.3. Cash
- 5.1.1.4. Other Modes of Payment
- 5.1.2. Online Sale (E-commerce)
- 5.1.2.1. Other Mo
- 5.1.1. Offline (Point of Sale)
- 5.2. Market Analysis, Insights and Forecast - by End-user Industry
- 5.2.1. Retail
- 5.2.2. Entertainment
- 5.2.3. Healthcare
- 5.2.4. Hospitality
- 5.2.5. Other End-user Industries
- 5.3. Market Analysis, Insights and Forecast - by Region
- 5.3.1. North America
- 5.3.2. South America
- 5.3.3. Europe
- 5.3.4. Middle East & Africa
- 5.3.5. Asia Pacific
- 5.1. Market Analysis, Insights and Forecast - by Mode of Payment
- 6. North America APAC Payments Industry Analysis, Insights and Forecast, 2019-2031
- 6.1. Market Analysis, Insights and Forecast - by Mode of Payment
- 6.1.1. Offline (Point of Sale)
- 6.1.1.1. Card Pay
- 6.1.1.2. Digital Wallets (includes mobile wallets)
- 6.1.1.3. Cash
- 6.1.1.4. Other Modes of Payment
- 6.1.2. Online Sale (E-commerce)
- 6.1.2.1. Other Mo
- 6.1.1. Offline (Point of Sale)
- 6.2. Market Analysis, Insights and Forecast - by End-user Industry
- 6.2.1. Retail
- 6.2.2. Entertainment
- 6.2.3. Healthcare
- 6.2.4. Hospitality
- 6.2.5. Other End-user Industries
- 6.1. Market Analysis, Insights and Forecast - by Mode of Payment
- 7. South America APAC Payments Industry Analysis, Insights and Forecast, 2019-2031
- 7.1. Market Analysis, Insights and Forecast - by Mode of Payment
- 7.1.1. Offline (Point of Sale)
- 7.1.1.1. Card Pay
- 7.1.1.2. Digital Wallets (includes mobile wallets)
- 7.1.1.3. Cash
- 7.1.1.4. Other Modes of Payment
- 7.1.2. Online Sale (E-commerce)
- 7.1.2.1. Other Mo
- 7.1.1. Offline (Point of Sale)
- 7.2. Market Analysis, Insights and Forecast - by End-user Industry
- 7.2.1. Retail
- 7.2.2. Entertainment
- 7.2.3. Healthcare
- 7.2.4. Hospitality
- 7.2.5. Other End-user Industries
- 7.1. Market Analysis, Insights and Forecast - by Mode of Payment
- 8. Europe APAC Payments Industry Analysis, Insights and Forecast, 2019-2031
- 8.1. Market Analysis, Insights and Forecast - by Mode of Payment
- 8.1.1. Offline (Point of Sale)
- 8.1.1.1. Card Pay
- 8.1.1.2. Digital Wallets (includes mobile wallets)
- 8.1.1.3. Cash
- 8.1.1.4. Other Modes of Payment
- 8.1.2. Online Sale (E-commerce)
- 8.1.2.1. Other Mo
- 8.1.1. Offline (Point of Sale)
- 8.2. Market Analysis, Insights and Forecast - by End-user Industry
- 8.2.1. Retail
- 8.2.2. Entertainment
- 8.2.3. Healthcare
- 8.2.4. Hospitality
- 8.2.5. Other End-user Industries
- 8.1. Market Analysis, Insights and Forecast - by Mode of Payment
- 9. Middle East & Africa APAC Payments Industry Analysis, Insights and Forecast, 2019-2031
- 9.1. Market Analysis, Insights and Forecast - by Mode of Payment
- 9.1.1. Offline (Point of Sale)
- 9.1.1.1. Card Pay
- 9.1.1.2. Digital Wallets (includes mobile wallets)
- 9.1.1.3. Cash
- 9.1.1.4. Other Modes of Payment
- 9.1.2. Online Sale (E-commerce)
- 9.1.2.1. Other Mo
- 9.1.1. Offline (Point of Sale)
- 9.2. Market Analysis, Insights and Forecast - by End-user Industry
- 9.2.1. Retail
- 9.2.2. Entertainment
- 9.2.3. Healthcare
- 9.2.4. Hospitality
- 9.2.5. Other End-user Industries
- 9.1. Market Analysis, Insights and Forecast - by Mode of Payment
- 10. Asia Pacific APAC Payments Industry Analysis, Insights and Forecast, 2019-2031
- 10.1. Market Analysis, Insights and Forecast - by Mode of Payment
- 10.1.1. Offline (Point of Sale)
- 10.1.1.1. Card Pay
- 10.1.1.2. Digital Wallets (includes mobile wallets)
- 10.1.1.3. Cash
- 10.1.1.4. Other Modes of Payment
- 10.1.2. Online Sale (E-commerce)
- 10.1.2.1. Other Mo
- 10.1.1. Offline (Point of Sale)
- 10.2. Market Analysis, Insights and Forecast - by End-user Industry
- 10.2.1. Retail
- 10.2.2. Entertainment
- 10.2.3. Healthcare
- 10.2.4. Hospitality
- 10.2.5. Other End-user Industries
- 10.1. Market Analysis, Insights and Forecast - by Mode of Payment
- 11. North America APAC Payments Industry Analysis, Insights and Forecast, 2019-2031
- 11.1. Market Analysis, Insights and Forecast - By Country/Sub-region
- 11.1.1.
- 12. Europe APAC Payments Industry Analysis, Insights and Forecast, 2019-2031
- 12.1. Market Analysis, Insights and Forecast - By Country/Sub-region
- 12.1.1.
- 13. Asia Pacific APAC Payments Industry Analysis, Insights and Forecast, 2019-2031
- 13.1. Market Analysis, Insights and Forecast - By Country/Sub-region
- 13.1.1.
- 14. Latin America APAC Payments Industry Analysis, Insights and Forecast, 2019-2031
- 14.1. Market Analysis, Insights and Forecast - By Country/Sub-region
- 14.1.1.
- 15. Middle East APAC Payments Industry Analysis, Insights and Forecast, 2019-2031
- 15.1. Market Analysis, Insights and Forecast - By Country/Sub-region
- 15.1.1.
- 16. Competitive Analysis
- 16.1. Global Market Share Analysis 2024
- 16.2. Company Profiles
- 16.2.1 Ipay88 (m) Sdn Bhd
- 16.2.1.1. Overview
- 16.2.1.2. Products
- 16.2.1.3. SWOT Analysis
- 16.2.1.4. Recent Developments
- 16.2.1.5. Financials (Based on Availability)
- 16.2.2 Visa Inc
- 16.2.2.1. Overview
- 16.2.2.2. Products
- 16.2.2.3. SWOT Analysis
- 16.2.2.4. Recent Developments
- 16.2.2.5. Financials (Based on Availability)
- 16.2.3 Naver Corporation (Naver Pay)
- 16.2.3.1. Overview
- 16.2.3.2. Products
- 16.2.3.3. SWOT Analysis
- 16.2.3.4. Recent Developments
- 16.2.3.5. Financials (Based on Availability)
- 16.2.4 JCB Co Ltd
- 16.2.4.1. Overview
- 16.2.4.2. Products
- 16.2.4.3. SWOT Analysis
- 16.2.4.4. Recent Developments
- 16.2.4.5. Financials (Based on Availability)
- 16.2.5 Samsung (Samsung Pay)
- 16.2.5.1. Overview
- 16.2.5.2. Products
- 16.2.5.3. SWOT Analysis
- 16.2.5.4. Recent Developments
- 16.2.5.5. Financials (Based on Availability)
- 16.2.6 Huawei Pay (Huawei Technologies Co Limited*List Not Exhaustive
- 16.2.6.1. Overview
- 16.2.6.2. Products
- 16.2.6.3. SWOT Analysis
- 16.2.6.4. Recent Developments
- 16.2.6.5. Financials (Based on Availability)
- 16.2.7 Matercard Inc
- 16.2.7.1. Overview
- 16.2.7.2. Products
- 16.2.7.3. SWOT Analysis
- 16.2.7.4. Recent Developments
- 16.2.7.5. Financials (Based on Availability)
- 16.2.8 Smile Pay
- 16.2.8.1. Overview
- 16.2.8.2. Products
- 16.2.8.3. SWOT Analysis
- 16.2.8.4. Recent Developments
- 16.2.8.5. Financials (Based on Availability)
- 16.2.9 Toss Financial Services Private Limited
- 16.2.9.1. Overview
- 16.2.9.2. Products
- 16.2.9.3. SWOT Analysis
- 16.2.9.4. Recent Developments
- 16.2.9.5. Financials (Based on Availability)
- 16.2.10 American Express Company
- 16.2.10.1. Overview
- 16.2.10.2. Products
- 16.2.10.3. SWOT Analysis
- 16.2.10.4. Recent Developments
- 16.2.10.5. Financials (Based on Availability)
- 16.2.11 Grab Pay (grab Holdings Limited)
- 16.2.11.1. Overview
- 16.2.11.2. Products
- 16.2.11.3. SWOT Analysis
- 16.2.11.4. Recent Developments
- 16.2.11.5. Financials (Based on Availability)
- 16.2.12 Samsung Pay (Samsung Electronics Co ltd)
- 16.2.12.1. Overview
- 16.2.12.2. Products
- 16.2.12.3. SWOT Analysis
- 16.2.12.4. Recent Developments
- 16.2.12.5. Financials (Based on Availability)
- 16.2.13 PayCo (NHN Corp )
- 16.2.13.1. Overview
- 16.2.13.2. Products
- 16.2.13.3. SWOT Analysis
- 16.2.13.4. Recent Developments
- 16.2.13.5. Financials (Based on Availability)
- 16.2.14 Paypal Holdings Inc
- 16.2.14.1. Overview
- 16.2.14.2. Products
- 16.2.14.3. SWOT Analysis
- 16.2.14.4. Recent Developments
- 16.2.14.5. Financials (Based on Availability)
- 16.2.15 Google Pay (Alphabet Inc )
- 16.2.15.1. Overview
- 16.2.15.2. Products
- 16.2.15.3. SWOT Analysis
- 16.2.15.4. Recent Developments
- 16.2.15.5. Financials (Based on Availability)
- 16.2.16 kakaopay Corp
- 16.2.16.1. Overview
- 16.2.16.2. Products
- 16.2.16.3. SWOT Analysis
- 16.2.16.4. Recent Developments
- 16.2.16.5. Financials (Based on Availability)
- 16.2.1 Ipay88 (m) Sdn Bhd
List of Figures
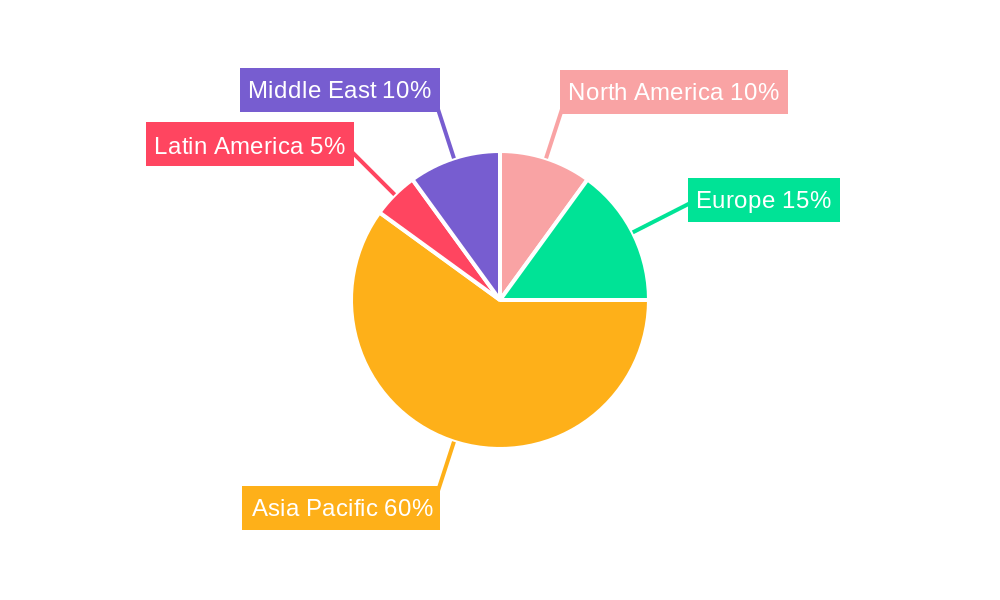
- Figure 1: Global APAC Payments Industry Revenue Breakdown (Million, %) by Region 2024 & 2032
- Figure 2: North America APAC Payments Industry Revenue (Million), by Country 2024 & 2032
- Figure 3: North America APAC Payments Industry Revenue Share (%), by Country 2024 & 2032
- Figure 4: Europe APAC Payments Industry Revenue (Million), by Country 2024 & 2032
- Figure 5: Europe APAC Payments Industry Revenue Share (%), by Country 2024 & 2032
- Figure 6: Asia Pacific APAC Payments Industry Revenue (Million), by Country 2024 & 2032
- Figure 7: Asia Pacific APAC Payments Industry Revenue Share (%), by Country 2024 & 2032
- Figure 8: Latin America APAC Payments Industry Revenue (Million), by Country 2024 & 2032
- Figure 9: Latin America APAC Payments Industry Revenue Share (%), by Country 2024 & 2032
- Figure 10: Middle East APAC Payments Industry Revenue (Million), by Country 2024 & 2032
- Figure 11: Middle East APAC Payments Industry Revenue Share (%), by Country 2024 & 2032
- Figure 12: North America APAC Payments Industry Revenue (Million), by Mode of Payment 2024 & 2032
- Figure 13: North America APAC Payments Industry Revenue Share (%), by Mode of Payment 2024 & 2032
- Figure 14: North America APAC Payments Industry Revenue (Million), by End-user Industry 2024 & 2032
- Figure 15: North America APAC Payments Industry Revenue Share (%), by End-user Industry 2024 & 2032
- Figure 16: North America APAC Payments Industry Revenue (Million), by Country 2024 & 2032
- Figure 17: North America APAC Payments Industry Revenue Share (%), by Country 2024 & 2032
- Figure 18: South America APAC Payments Industry Revenue (Million), by Mode of Payment 2024 & 2032
- Figure 19: South America APAC Payments Industry Revenue Share (%), by Mode of Payment 2024 & 2032
- Figure 20: South America APAC Payments Industry Revenue (Million), by End-user Industry 2024 & 2032
- Figure 21: South America APAC Payments Industry Revenue Share (%), by End-user Industry 2024 & 2032
- Figure 22: South America APAC Payments Industry Revenue (Million), by Country 2024 & 2032
- Figure 23: South America APAC Payments Industry Revenue Share (%), by Country 2024 & 2032
- Figure 24: Europe APAC Payments Industry Revenue (Million), by Mode of Payment 2024 & 2032
- Figure 25: Europe APAC Payments Industry Revenue Share (%), by Mode of Payment 2024 & 2032
- Figure 26: Europe APAC Payments Industry Revenue (Million), by End-user Industry 2024 & 2032
- Figure 27: Europe APAC Payments Industry Revenue Share (%), by End-user Industry 2024 & 2032
- Figure 28: Europe APAC Payments Industry Revenue (Million), by Country 2024 & 2032
- Figure 29: Europe APAC Payments Industry Revenue Share (%), by Country 2024 & 2032
- Figure 30: Middle East & Africa APAC Payments Industry Revenue (Million), by Mode of Payment 2024 & 2032
- Figure 31: Middle East & Africa APAC Payments Industry Revenue Share (%), by Mode of Payment 2024 & 2032
- Figure 32: Middle East & Africa APAC Payments Industry Revenue (Million), by End-user Industry 2024 & 2032
- Figure 33: Middle East & Africa APAC Payments Industry Revenue Share (%), by End-user Industry 2024 & 2032
- Figure 34: Middle East & Africa APAC Payments Industry Revenue (Million), by Country 2024 & 2032
- Figure 35: Middle East & Africa APAC Payments Industry Revenue Share (%), by Country 2024 & 2032
- Figure 36: Asia Pacific APAC Payments Industry Revenue (Million), by Mode of Payment 2024 & 2032
- Figure 37: Asia Pacific APAC Payments Industry Revenue Share (%), by Mode of Payment 2024 & 2032
- Figure 38: Asia Pacific APAC Payments Industry Revenue (Million), by End-user Industry 2024 & 2032
- Figure 39: Asia Pacific APAC Payments Industry Revenue Share (%), by End-user Industry 2024 & 2032
- Figure 40: Asia Pacific APAC Payments Industry Revenue (Million), by Country 2024 & 2032
- Figure 41: Asia Pacific APAC Payments Industry Revenue Share (%), by Country 2024 & 2032
List of Tables
- Table 1: Global APAC Payments Industry Revenue Million Forecast, by Region 2019 & 2032
- Table 2: Global APAC Payments Industry Revenue Million Forecast, by Mode of Payment 2019 & 2032
- Table 3: Global APAC Payments Industry Revenue Million Forecast, by End-user Industry 2019 & 2032
- Table 4: Global APAC Payments Industry Revenue Million Forecast, by Region 2019 & 2032
- Table 5: Global APAC Payments Industry Revenue Million Forecast, by Country 2019 & 2032
- Table 6: APAC Payments Industry Revenue (Million) Forecast, by Application 2019 & 2032
- Table 7: Global APAC Payments Industry Revenue Million Forecast, by Country 2019 & 2032
- Table 8: APAC Payments Industry Revenue (Million) Forecast, by Application 2019 & 2032
- Table 9: Global APAC Payments Industry Revenue Million Forecast, by Country 2019 & 2032
- Table 10: APAC Payments Industry Revenue (Million) Forecast, by Application 2019 & 2032
- Table 11: Global APAC Payments Industry Revenue Million Forecast, by Country 2019 & 2032
- Table 12: APAC Payments Industry Revenue (Million) Forecast, by Application 2019 & 2032
- Table 13: Global APAC Payments Industry Revenue Million Forecast, by Country 2019 & 2032
- Table 14: APAC Payments Industry Revenue (Million) Forecast, by Application 2019 & 2032
- Table 15: Global APAC Payments Industry Revenue Million Forecast, by Mode of Payment 2019 & 2032
- Table 16: Global APAC Payments Industry Revenue Million Forecast, by End-user Industry 2019 & 2032
- Table 17: Global APAC Payments Industry Revenue Million Forecast, by Country 2019 & 2032
- Table 18: United States APAC Payments Industry Revenue (Million) Forecast, by Application 2019 & 2032
- Table 19: Canada APAC Payments Industry Revenue (Million) Forecast, by Application 2019 & 2032
- Table 20: Mexico APAC Payments Industry Revenue (Million) Forecast, by Application 2019 & 2032
- Table 21: Global APAC Payments Industry Revenue Million Forecast, by Mode of Payment 2019 & 2032
- Table 22: Global APAC Payments Industry Revenue Million Forecast, by End-user Industry 2019 & 2032
- Table 23: Global APAC Payments Industry Revenue Million Forecast, by Country 2019 & 2032
- Table 24: Brazil APAC Payments Industry Revenue (Million) Forecast, by Application 2019 & 2032
- Table 25: Argentina APAC Payments Industry Revenue (Million) Forecast, by Application 2019 & 2032
- Table 26: Rest of South America APAC Payments Industry Revenue (Million) Forecast, by Application 2019 & 2032
- Table 27: Global APAC Payments Industry Revenue Million Forecast, by Mode of Payment 2019 & 2032
- Table 28: Global APAC Payments Industry Revenue Million Forecast, by End-user Industry 2019 & 2032
- Table 29: Global APAC Payments Industry Revenue Million Forecast, by Country 2019 & 2032
- Table 30: United Kingdom APAC Payments Industry Revenue (Million) Forecast, by Application 2019 & 2032
- Table 31: Germany APAC Payments Industry Revenue (Million) Forecast, by Application 2019 & 2032
- Table 32: France APAC Payments Industry Revenue (Million) Forecast, by Application 2019 & 2032
- Table 33: Italy APAC Payments Industry Revenue (Million) Forecast, by Application 2019 & 2032
- Table 34: Spain APAC Payments Industry Revenue (Million) Forecast, by Application 2019 & 2032
- Table 35: Russia APAC Payments Industry Revenue (Million) Forecast, by Application 2019 & 2032
- Table 36: Benelux APAC Payments Industry Revenue (Million) Forecast, by Application 2019 & 2032
- Table 37: Nordics APAC Payments Industry Revenue (Million) Forecast, by Application 2019 & 2032
- Table 38: Rest of Europe APAC Payments Industry Revenue (Million) Forecast, by Application 2019 & 2032
- Table 39: Global APAC Payments Industry Revenue Million Forecast, by Mode of Payment 2019 & 2032
- Table 40: Global APAC Payments Industry Revenue Million Forecast, by End-user Industry 2019 & 2032
- Table 41: Global APAC Payments Industry Revenue Million Forecast, by Country 2019 & 2032
- Table 42: Turkey APAC Payments Industry Revenue (Million) Forecast, by Application 2019 & 2032
- Table 43: Israel APAC Payments Industry Revenue (Million) Forecast, by Application 2019 & 2032
- Table 44: GCC APAC Payments Industry Revenue (Million) Forecast, by Application 2019 & 2032
- Table 45: North Africa APAC Payments Industry Revenue (Million) Forecast, by Application 2019 & 2032
- Table 46: South Africa APAC Payments Industry Revenue (Million) Forecast, by Application 2019 & 2032
- Table 47: Rest of Middle East & Africa APAC Payments Industry Revenue (Million) Forecast, by Application 2019 & 2032
- Table 48: Global APAC Payments Industry Revenue Million Forecast, by Mode of Payment 2019 & 2032
- Table 49: Global APAC Payments Industry Revenue Million Forecast, by End-user Industry 2019 & 2032
- Table 50: Global APAC Payments Industry Revenue Million Forecast, by Country 2019 & 2032
- Table 51: China APAC Payments Industry Revenue (Million) Forecast, by Application 2019 & 2032
- Table 52: India APAC Payments Industry Revenue (Million) Forecast, by Application 2019 & 2032
- Table 53: Japan APAC Payments Industry Revenue (Million) Forecast, by Application 2019 & 2032
- Table 54: South Korea APAC Payments Industry Revenue (Million) Forecast, by Application 2019 & 2032
- Table 55: ASEAN APAC Payments Industry Revenue (Million) Forecast, by Application 2019 & 2032
- Table 56: Oceania APAC Payments Industry Revenue (Million) Forecast, by Application 2019 & 2032
- Table 57: Rest of Asia Pacific APAC Payments Industry Revenue (Million) Forecast, by Application 2019 & 2032
Frequently Asked Questions
1. What is the projected Compound Annual Growth Rate (CAGR) of the APAC Payments Industry?
The projected CAGR is approximately 13.32%.
2. Which companies are prominent players in the APAC Payments Industry?
Key companies in the market include Ipay88 (m) Sdn Bhd, Visa Inc, Naver Corporation (Naver Pay), JCB Co Ltd, Samsung (Samsung Pay), Huawei Pay (Huawei Technologies Co Limited*List Not Exhaustive, Matercard Inc, Smile Pay, Toss Financial Services Private Limited, American Express Company, Grab Pay (grab Holdings Limited), Samsung Pay (Samsung Electronics Co ltd), PayCo (NHN Corp ), Paypal Holdings Inc, Google Pay (Alphabet Inc ), kakaopay Corp.
3. What are the main segments of the APAC Payments Industry?
The market segments include Mode of Payment, End-user Industry.
4. Can you provide details about the market size?
The market size is estimated to be USD 13.93 Million as of 2022.
5. What are some drivers contributing to market growth?
High Proliferation of E-commerce and Rising Adoption of M-commerce; Enablement Programs by Key Retailers and Government Encouraging Digitization of the Market; Growing Adoption of Buy Now Pay Later in Asia-Pacific Countries.
6. What are the notable trends driving market growth?
Online sales segment to show higher growth.
7. Are there any restraints impacting market growth?
High Implementation and Maintenance Cost.
8. Can you provide examples of recent developments in the market?
October 2023, According to a statement made by the National Payments Corporation of India (NPCI), six Indian banks contributing to the arrangement are Indian Bank, Axis Bank, Bank, DBS Bank India, ICICI Indian Overseas Bank, as well as State Bank of India. India and Singapore are all set to increase the range of their digital payment link after they proclaimed the milestone linkage between India’s Unified Payments Interface (UPI) in addition to Singapore’s PayNow.
9. What pricing options are available for accessing the report?
Pricing options include single-user, multi-user, and enterprise licenses priced at USD 4750, USD 4950, and USD 6800 respectively.
10. Is the market size provided in terms of value or volume?
The market size is provided in terms of value, measured in Million.
11. Are there any specific market keywords associated with the report?
Yes, the market keyword associated with the report is "APAC Payments Industry," which aids in identifying and referencing the specific market segment covered.
12. How do I determine which pricing option suits my needs best?
The pricing options vary based on user requirements and access needs. Individual users may opt for single-user licenses, while businesses requiring broader access may choose multi-user or enterprise licenses for cost-effective access to the report.
13. Are there any additional resources or data provided in the APAC Payments Industry report?
While the report offers comprehensive insights, it's advisable to review the specific contents or supplementary materials provided to ascertain if additional resources or data are available.
14. How can I stay updated on further developments or reports in the APAC Payments Industry?
To stay informed about further developments, trends, and reports in the APAC Payments Industry, consider subscribing to industry newsletters, following relevant companies and organizations, or regularly checking reputable industry news sources and publications.
Methodology
Step 1 - Identification of Relevant Samples Size from Population Database


Step 2 - Approaches for Defining Global Market Size (Value, Volume* & Price*)

Note*: In applicable scenarios
Step 3 - Data Sources
Primary Research
- Web Analytics
- Survey Reports
- Research Institute
- Latest Research Reports
- Opinion Leaders
Secondary Research
- Annual Reports
- White Paper
- Latest Press Release
- Industry Association
- Paid Database
- Investor Presentations

Step 4 - Data Triangulation
Involves using different sources of information in order to increase the validity of a study
These sources are likely to be stakeholders in a program - participants, other researchers, program staff, other community members, and so on.
Then we put all data in single framework & apply various statistical tools to find out the dynamic on the market.
During the analysis stage, feedback from the stakeholder groups would be compared to determine areas of agreement as well as areas of divergence
