

Key Insights
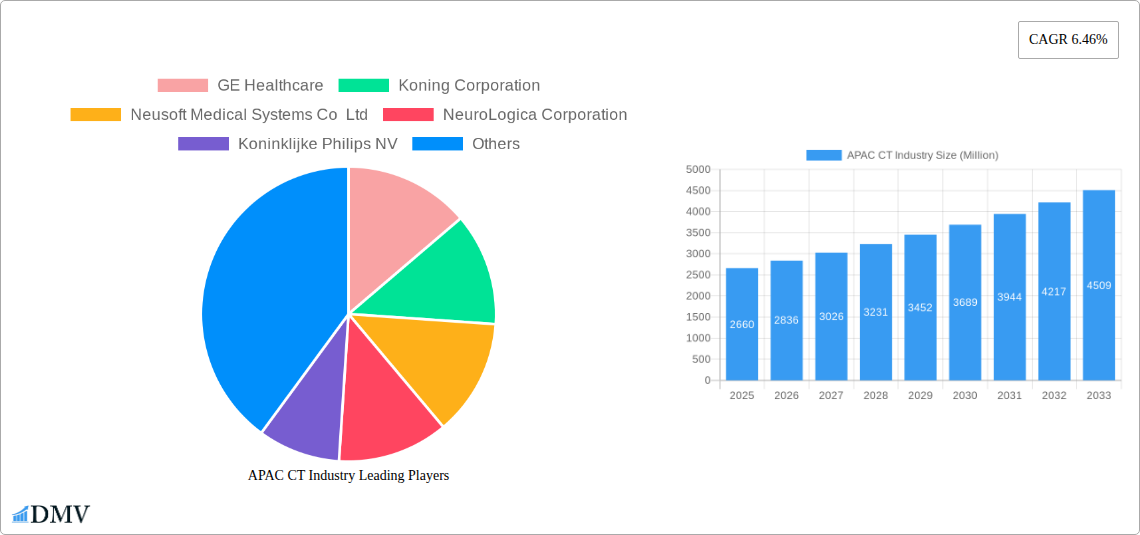
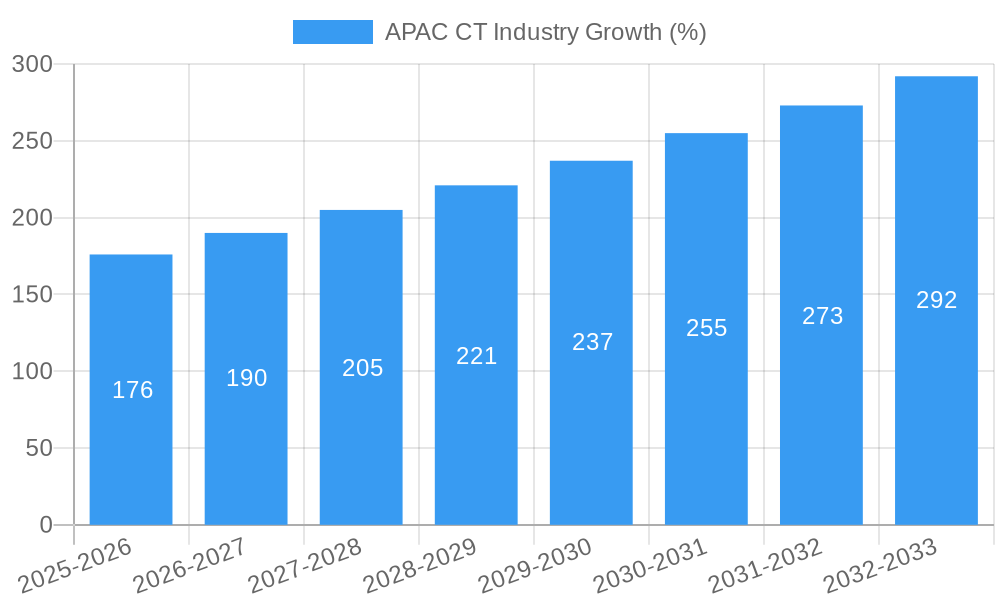
The Asia-Pacific (APAC) computed tomography (CT) market is experiencing robust growth, projected to reach \$2.66 billion in 2025 and maintain a Compound Annual Growth Rate (CAGR) of 6.46% from 2025 to 2033. This expansion is fueled by several key factors. Rising prevalence of chronic diseases like cancer and cardiovascular ailments necessitates increased diagnostic imaging, driving demand for CT scans. Technological advancements, such as multislice CT scanners offering faster scan times and improved image quality, are also contributing to market growth. Furthermore, increasing healthcare expenditure in key APAC nations like China, India, and Japan, coupled with improving healthcare infrastructure and rising disposable incomes, are bolstering the adoption of advanced medical imaging technologies, including CT. The market segmentation reveals a varied landscape, with oncology, neurology, and cardiovascular applications dominating the application segment, while hospitals and clinics represent the largest end-user segment. Significant growth is expected from the high-slice CT scanner segment, reflecting the trend towards higher resolution and faster imaging capabilities. However, high equipment costs and the need for skilled technicians could act as potential restraints.
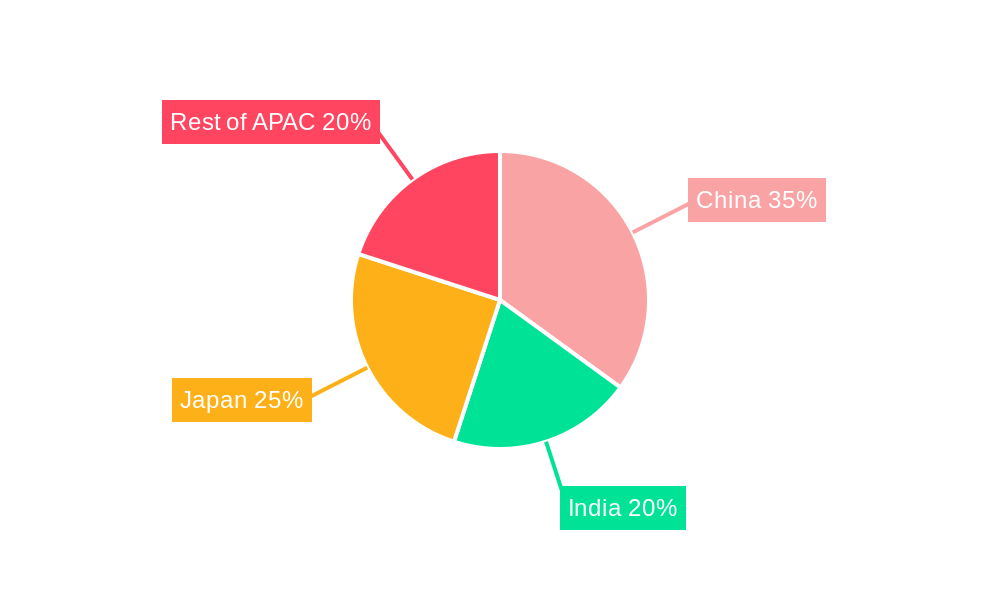
Within the APAC region, China, India, and Japan are major contributors to market growth. China's substantial healthcare investment and expanding medical infrastructure provide substantial opportunities. India's burgeoning middle class and increasing healthcare awareness are driving demand. Japan's advanced healthcare system and technological adoption further contribute to the regional market's expansion. The presence of major players like GE Healthcare, Philips, and Siemens Healthineers, alongside several prominent regional companies, fosters innovation and competition, shaping market dynamics. Future growth will likely be influenced by government initiatives to improve healthcare access, technological innovations in AI-powered image analysis, and expanding telemedicine applications. The market's trajectory suggests considerable potential for sustained growth within the forecast period.
APAC CT Industry Market Report: 2019-2033
This comprehensive report provides an in-depth analysis of the Asia-Pacific (APAC) Computed Tomography (CT) industry, offering invaluable insights for stakeholders seeking to navigate this dynamic market. Covering the period from 2019 to 2033, with a base year of 2025 and a forecast period of 2025-2033, this report meticulously examines market trends, competitive landscapes, and future growth potential. The APAC CT market is projected to reach xx Million by 2033, demonstrating significant growth opportunities.
APAC CT Industry Market Composition & Trends
This section evaluates the APAC CT market's competitive intensity, identifying key innovation drivers, regulatory frameworks, substitute technologies, and end-user characteristics. We analyze mergers and acquisitions (M&A) activity, providing insights into market share distribution and deal values. The market is characterized by a moderately concentrated landscape, with key players such as GE Healthcare, Koninklijke Philips NV, and Canon Medical Systems Corporation holding significant market share. However, the presence of several regional players and emerging technologies fosters a dynamic competitive environment.
- Market Concentration: High concentration in the high-end segment, moderate in mid-range, and fragmented in the low-end segment. Top 5 players hold approximately xx% of the market share in 2025.
- Innovation Catalysts: Advancements in detector technology, AI-powered image reconstruction, and minimally invasive procedures.
- Regulatory Landscape: Varying regulatory requirements across APAC nations, impacting product approvals and market access.
- Substitute Products: MRI and ultrasound imaging represent alternative diagnostic modalities.
- End-User Profiles: Hospitals and diagnostic imaging centers constitute the majority of end-users, followed by clinics and other specialized healthcare facilities.
- M&A Activity: A total of xx M&A deals were recorded between 2019 and 2024, with a cumulative value of approximately xx Million.
APAC CT Industry Industry Evolution
This section delves into the evolutionary trajectory of the APAC CT market, encompassing market growth trajectories, technological advancements, and evolving consumer demands. The historical period (2019-2024) witnessed robust growth, driven by increasing healthcare expenditure, rising prevalence of chronic diseases, and technological advancements. We project a CAGR of xx% from 2025 to 2033, fueled by factors such as the rising adoption of advanced imaging techniques and increasing demand for faster and more precise diagnostic tools. The shift towards minimally invasive procedures and the integration of AI are also significant growth drivers. Specific data points, including growth rates and adoption metrics for various CT types (low, medium, and high slice), will be detailed within the full report.
Leading Regions, Countries, or Segments in APAC CT Industry
This section pinpoints the leading regions, countries, and segments within the APAC CT market. Growth is expected to be particularly strong in countries like China, India, and Japan.
- Key Drivers (China): Significant government investments in healthcare infrastructure, rising disposable incomes, and a growing prevalence of chronic diseases.
- Key Drivers (India): Increasing healthcare awareness, government initiatives promoting healthcare access, and a burgeoning private healthcare sector.
- Key Drivers (Japan): High technological adoption rates, an aging population, and well-established healthcare infrastructure.
- Dominant Segments: The high-slice CT segment is expected to dominate, driven by improved image quality and faster scan times. Oncology and cardiovascular applications are the largest application segments. Hospitals remain the primary end-users.
APAC CT Industry Product Innovations
Recent innovations in CT technology include multi-slice CT scanners with advanced detector technology, enabling faster scan times and improved image resolution. AI-powered image reconstruction algorithms enhance image quality and reduce radiation dose. These advancements deliver improved diagnostic accuracy and patient experience, representing unique selling propositions for manufacturers.
Propelling Factors for APAP CT Industry Growth
Several factors propel the growth of the APAC CT market. Technological advancements, such as improved image quality and reduced radiation exposure, are crucial drivers. Rising healthcare expenditure and increasing prevalence of chronic diseases, particularly cancer and cardiovascular diseases, significantly contribute to market expansion. Furthermore, favorable government policies and initiatives supporting healthcare infrastructure development across several APAC nations further boost market growth.
Obstacles in the APAP CT Industry Market
Despite the growth potential, the APAC CT market faces challenges. Stringent regulatory approvals and varying healthcare policies across different countries create hurdles for market entry and expansion. The high cost of CT scanners and associated maintenance can limit affordability, particularly in resource-constrained settings. Furthermore, competition among established players and the emergence of new entrants create a dynamic and competitive market landscape. Supply chain disruptions, particularly evident in the post-pandemic period, also present a significant challenge.
Future Opportunities in APAC CT Industry
The APAC CT market presents several promising opportunities. Expanding into underserved regions with limited access to advanced diagnostic imaging will unlock significant market potential. The integration of AI and machine learning in CT imaging holds immense promise for enhancing diagnostic accuracy and efficiency. Furthermore, developing innovative financing models to address the high cost of CT technology could increase access to advanced imaging capabilities, particularly in low-resource settings. The growing adoption of mobile CT scanners represents another important area for future growth.
Major Players in the APAC CT Industry Ecosystem
- GE Healthcare
- Koninklijke Philips NV
- Canon Medical Systems Corporation
- Hitachi Healthcare Systems
- Siemens Healthineers
- Neusoft Medical Systems Co Ltd
- NeuroLogica Corporation
- Koning Corporation
- Shenzhen Anke High-Tech Co Ltd
- Fujifilm Holdings Corporation
Key Developments in APAC CT Industry Industry
- December 2022: Fujifilm India partnered with Soorya Diagnostics LLP Center, installing a new CT scanner to improve healthcare access in Tirur, Kerala. This highlights increased investment in regional healthcare infrastructure.
- May 2022: Bayer Korea launched MEDRAD Centargo, a CT injection device, approved by the Ministry of Food and Drug Safety. This signifies advancements in related technologies and increased availability of advanced medical devices.
Strategic APAC CT Industry Market Forecast
The APAC CT market is poised for continued growth, driven by technological innovations, rising healthcare expenditure, and expanding healthcare infrastructure. The increasing prevalence of chronic diseases and the growing demand for advanced diagnostic imaging services will fuel market expansion. Focusing on emerging markets, incorporating AI-powered solutions, and developing innovative financing models will be crucial for maximizing future market potential. The market is projected to experience significant growth, with a substantial increase in both unit sales and overall market value over the forecast period.
APAC CT Industry Segmentation
-
1. Type
- 1.1. Low Slice
- 1.2. Medium Slice
- 1.3. High Slice
-
2. Application
- 2.1. Oncology
- 2.2. Neurology
- 2.3. Cardiovascular
- 2.4. Musculoskeletal
- 2.5. Other Applications
-
3. End-User
- 3.1. Hospitals
- 3.2. Clinics
- 3.3. Diagnostic Services
- 3.4. Other End-Users
-
4. Geography
- 4.1. China
- 4.2. Japan
- 4.3. India
- 4.4. Australia
- 4.5. South Korea
- 4.6. Rest of Asia-Pacific
APAC CT Industry Segmentation By Geography
- 1. China
- 2. Japan
- 3. India
- 4. Australia
- 5. South Korea
- 6. Rest of Asia Pacific
APAC CT Industry REPORT HIGHLIGHTS
| Aspects | Details |
|---|---|
| Study Period | 2019-2033 |
| Base Year | 2024 |
| Estimated Year | 2025 |
| Forecast Period | 2025-2033 |
| Historical Period | 2019-2024 |
| Growth Rate | CAGR of 6.46% from 2019-2033 |
| Segmentation |
|
Table of Contents
- 1. Introduction
- 1.1. Research Scope
- 1.2. Market Segmentation
- 1.3. Research Methodology
- 1.4. Definitions and Assumptions
- 2. Executive Summary
- 2.1. Introduction
- 3. Market Dynamics
- 3.1. Introduction
- 3.2. Market Drivers
- 3.2.1. Rising Geriatric Population and Increase in Incidences of Chronic Diseases; Increase in Shift of Medical Care Toward Image-guided Interventions; Technological Advancements
- 3.3. Market Restrains
- 3.3.1. Lack of Adequate Reimbursement; Stringent Regulatory Framework
- 3.4. Market Trends
- 3.4.1. Oncology Segment is Expected to Account for Largest Market Share During the Forecast Period
- 4. Market Factor Analysis
- 4.1. Porters Five Forces
- 4.2. Supply/Value Chain
- 4.3. PESTEL analysis
- 4.4. Market Entropy
- 4.5. Patent/Trademark Analysis
- 5. Global APAC CT Industry Analysis, Insights and Forecast, 2019-2031
- 5.1. Market Analysis, Insights and Forecast - by Type
- 5.1.1. Low Slice
- 5.1.2. Medium Slice
- 5.1.3. High Slice
- 5.2. Market Analysis, Insights and Forecast - by Application
- 5.2.1. Oncology
- 5.2.2. Neurology
- 5.2.3. Cardiovascular
- 5.2.4. Musculoskeletal
- 5.2.5. Other Applications
- 5.3. Market Analysis, Insights and Forecast - by End-User
- 5.3.1. Hospitals
- 5.3.2. Clinics
- 5.3.3. Diagnostic Services
- 5.3.4. Other End-Users
- 5.4. Market Analysis, Insights and Forecast - by Geography
- 5.4.1. China
- 5.4.2. Japan
- 5.4.3. India
- 5.4.4. Australia
- 5.4.5. South Korea
- 5.4.6. Rest of Asia-Pacific
- 5.5. Market Analysis, Insights and Forecast - by Region
- 5.5.1. China
- 5.5.2. Japan
- 5.5.3. India
- 5.5.4. Australia
- 5.5.5. South Korea
- 5.5.6. Rest of Asia Pacific
- 5.1. Market Analysis, Insights and Forecast - by Type
- 6. China APAC CT Industry Analysis, Insights and Forecast, 2019-2031
- 6.1. Market Analysis, Insights and Forecast - by Type
- 6.1.1. Low Slice
- 6.1.2. Medium Slice
- 6.1.3. High Slice
- 6.2. Market Analysis, Insights and Forecast - by Application
- 6.2.1. Oncology
- 6.2.2. Neurology
- 6.2.3. Cardiovascular
- 6.2.4. Musculoskeletal
- 6.2.5. Other Applications
- 6.3. Market Analysis, Insights and Forecast - by End-User
- 6.3.1. Hospitals
- 6.3.2. Clinics
- 6.3.3. Diagnostic Services
- 6.3.4. Other End-Users
- 6.4. Market Analysis, Insights and Forecast - by Geography
- 6.4.1. China
- 6.4.2. Japan
- 6.4.3. India
- 6.4.4. Australia
- 6.4.5. South Korea
- 6.4.6. Rest of Asia-Pacific
- 6.1. Market Analysis, Insights and Forecast - by Type
- 7. Japan APAC CT Industry Analysis, Insights and Forecast, 2019-2031
- 7.1. Market Analysis, Insights and Forecast - by Type
- 7.1.1. Low Slice
- 7.1.2. Medium Slice
- 7.1.3. High Slice
- 7.2. Market Analysis, Insights and Forecast - by Application
- 7.2.1. Oncology
- 7.2.2. Neurology
- 7.2.3. Cardiovascular
- 7.2.4. Musculoskeletal
- 7.2.5. Other Applications
- 7.3. Market Analysis, Insights and Forecast - by End-User
- 7.3.1. Hospitals
- 7.3.2. Clinics
- 7.3.3. Diagnostic Services
- 7.3.4. Other End-Users
- 7.4. Market Analysis, Insights and Forecast - by Geography
- 7.4.1. China
- 7.4.2. Japan
- 7.4.3. India
- 7.4.4. Australia
- 7.4.5. South Korea
- 7.4.6. Rest of Asia-Pacific
- 7.1. Market Analysis, Insights and Forecast - by Type
- 8. India APAC CT Industry Analysis, Insights and Forecast, 2019-2031
- 8.1. Market Analysis, Insights and Forecast - by Type
- 8.1.1. Low Slice
- 8.1.2. Medium Slice
- 8.1.3. High Slice
- 8.2. Market Analysis, Insights and Forecast - by Application
- 8.2.1. Oncology
- 8.2.2. Neurology
- 8.2.3. Cardiovascular
- 8.2.4. Musculoskeletal
- 8.2.5. Other Applications
- 8.3. Market Analysis, Insights and Forecast - by End-User
- 8.3.1. Hospitals
- 8.3.2. Clinics
- 8.3.3. Diagnostic Services
- 8.3.4. Other End-Users
- 8.4. Market Analysis, Insights and Forecast - by Geography
- 8.4.1. China
- 8.4.2. Japan
- 8.4.3. India
- 8.4.4. Australia
- 8.4.5. South Korea
- 8.4.6. Rest of Asia-Pacific
- 8.1. Market Analysis, Insights and Forecast - by Type
- 9. Australia APAC CT Industry Analysis, Insights and Forecast, 2019-2031
- 9.1. Market Analysis, Insights and Forecast - by Type
- 9.1.1. Low Slice
- 9.1.2. Medium Slice
- 9.1.3. High Slice
- 9.2. Market Analysis, Insights and Forecast - by Application
- 9.2.1. Oncology
- 9.2.2. Neurology
- 9.2.3. Cardiovascular
- 9.2.4. Musculoskeletal
- 9.2.5. Other Applications
- 9.3. Market Analysis, Insights and Forecast - by End-User
- 9.3.1. Hospitals
- 9.3.2. Clinics
- 9.3.3. Diagnostic Services
- 9.3.4. Other End-Users
- 9.4. Market Analysis, Insights and Forecast - by Geography
- 9.4.1. China
- 9.4.2. Japan
- 9.4.3. India
- 9.4.4. Australia
- 9.4.5. South Korea
- 9.4.6. Rest of Asia-Pacific
- 9.1. Market Analysis, Insights and Forecast - by Type
- 10. South Korea APAC CT Industry Analysis, Insights and Forecast, 2019-2031
- 10.1. Market Analysis, Insights and Forecast - by Type
- 10.1.1. Low Slice
- 10.1.2. Medium Slice
- 10.1.3. High Slice
- 10.2. Market Analysis, Insights and Forecast - by Application
- 10.2.1. Oncology
- 10.2.2. Neurology
- 10.2.3. Cardiovascular
- 10.2.4. Musculoskeletal
- 10.2.5. Other Applications
- 10.3. Market Analysis, Insights and Forecast - by End-User
- 10.3.1. Hospitals
- 10.3.2. Clinics
- 10.3.3. Diagnostic Services
- 10.3.4. Other End-Users
- 10.4. Market Analysis, Insights and Forecast - by Geography
- 10.4.1. China
- 10.4.2. Japan
- 10.4.3. India
- 10.4.4. Australia
- 10.4.5. South Korea
- 10.4.6. Rest of Asia-Pacific
- 10.1. Market Analysis, Insights and Forecast - by Type
- 11. Rest of Asia Pacific APAC CT Industry Analysis, Insights and Forecast, 2019-2031
- 11.1. Market Analysis, Insights and Forecast - by Type
- 11.1.1. Low Slice
- 11.1.2. Medium Slice
- 11.1.3. High Slice
- 11.2. Market Analysis, Insights and Forecast - by Application
- 11.2.1. Oncology
- 11.2.2. Neurology
- 11.2.3. Cardiovascular
- 11.2.4. Musculoskeletal
- 11.2.5. Other Applications
- 11.3. Market Analysis, Insights and Forecast - by End-User
- 11.3.1. Hospitals
- 11.3.2. Clinics
- 11.3.3. Diagnostic Services
- 11.3.4. Other End-Users
- 11.4. Market Analysis, Insights and Forecast - by Geography
- 11.4.1. China
- 11.4.2. Japan
- 11.4.3. India
- 11.4.4. Australia
- 11.4.5. South Korea
- 11.4.6. Rest of Asia-Pacific
- 11.1. Market Analysis, Insights and Forecast - by Type
- 12. China APAC CT Industry Analysis, Insights and Forecast, 2019-2031
- 13. Japan APAC CT Industry Analysis, Insights and Forecast, 2019-2031
- 14. India APAC CT Industry Analysis, Insights and Forecast, 2019-2031
- 15. South Korea APAC CT Industry Analysis, Insights and Forecast, 2019-2031
- 16. Southeast Asia APAC CT Industry Analysis, Insights and Forecast, 2019-2031
- 17. Australia APAC CT Industry Analysis, Insights and Forecast, 2019-2031
- 18. Rest of Asia Pacific APAC CT Industry Analysis, Insights and Forecast, 2019-2031
- 19. Competitive Analysis
- 19.1. Global Market Share Analysis 2024
- 19.2. Company Profiles
- 19.2.1 GE Healthcare
- 19.2.1.1. Overview
- 19.2.1.2. Products
- 19.2.1.3. SWOT Analysis
- 19.2.1.4. Recent Developments
- 19.2.1.5. Financials (Based on Availability)
- 19.2.2 Koning Corporation
- 19.2.2.1. Overview
- 19.2.2.2. Products
- 19.2.2.3. SWOT Analysis
- 19.2.2.4. Recent Developments
- 19.2.2.5. Financials (Based on Availability)
- 19.2.3 Neusoft Medical Systems Co Ltd
- 19.2.3.1. Overview
- 19.2.3.2. Products
- 19.2.3.3. SWOT Analysis
- 19.2.3.4. Recent Developments
- 19.2.3.5. Financials (Based on Availability)
- 19.2.4 NeuroLogica Corporation
- 19.2.4.1. Overview
- 19.2.4.2. Products
- 19.2.4.3. SWOT Analysis
- 19.2.4.4. Recent Developments
- 19.2.4.5. Financials (Based on Availability)
- 19.2.5 Koninklijke Philips NV
- 19.2.5.1. Overview
- 19.2.5.2. Products
- 19.2.5.3. SWOT Analysis
- 19.2.5.4. Recent Developments
- 19.2.5.5. Financials (Based on Availability)
- 19.2.6 Canon Medical Systems Corporation
- 19.2.6.1. Overview
- 19.2.6.2. Products
- 19.2.6.3. SWOT Analysis
- 19.2.6.4. Recent Developments
- 19.2.6.5. Financials (Based on Availability)
- 19.2.7 Hitachi Healthcare Systems
- 19.2.7.1. Overview
- 19.2.7.2. Products
- 19.2.7.3. SWOT Analysis
- 19.2.7.4. Recent Developments
- 19.2.7.5. Financials (Based on Availability)
- 19.2.8 Siemens Healthineers*List Not Exhaustive
- 19.2.8.1. Overview
- 19.2.8.2. Products
- 19.2.8.3. SWOT Analysis
- 19.2.8.4. Recent Developments
- 19.2.8.5. Financials (Based on Availability)
- 19.2.9 Shenzhen Anke High-Tech Co Ltd
- 19.2.9.1. Overview
- 19.2.9.2. Products
- 19.2.9.3. SWOT Analysis
- 19.2.9.4. Recent Developments
- 19.2.9.5. Financials (Based on Availability)
- 19.2.10 Fujifilm Holdings Corporation
- 19.2.10.1. Overview
- 19.2.10.2. Products
- 19.2.10.3. SWOT Analysis
- 19.2.10.4. Recent Developments
- 19.2.10.5. Financials (Based on Availability)
- 19.2.1 GE Healthcare
List of Figures
- Figure 1: Global APAC CT Industry Revenue Breakdown (Million, %) by Region 2024 & 2032
- Figure 2: Asia Pacific APAC CT Industry Revenue (Million), by Country 2024 & 2032
- Figure 3: Asia Pacific APAC CT Industry Revenue Share (%), by Country 2024 & 2032
- Figure 4: China APAC CT Industry Revenue (Million), by Type 2024 & 2032
- Figure 5: China APAC CT Industry Revenue Share (%), by Type 2024 & 2032
- Figure 6: China APAC CT Industry Revenue (Million), by Application 2024 & 2032
- Figure 7: China APAC CT Industry Revenue Share (%), by Application 2024 & 2032
- Figure 8: China APAC CT Industry Revenue (Million), by End-User 2024 & 2032
- Figure 9: China APAC CT Industry Revenue Share (%), by End-User 2024 & 2032
- Figure 10: China APAC CT Industry Revenue (Million), by Geography 2024 & 2032
- Figure 11: China APAC CT Industry Revenue Share (%), by Geography 2024 & 2032
- Figure 12: China APAC CT Industry Revenue (Million), by Country 2024 & 2032
- Figure 13: China APAC CT Industry Revenue Share (%), by Country 2024 & 2032
- Figure 14: Japan APAC CT Industry Revenue (Million), by Type 2024 & 2032
- Figure 15: Japan APAC CT Industry Revenue Share (%), by Type 2024 & 2032
- Figure 16: Japan APAC CT Industry Revenue (Million), by Application 2024 & 2032
- Figure 17: Japan APAC CT Industry Revenue Share (%), by Application 2024 & 2032
- Figure 18: Japan APAC CT Industry Revenue (Million), by End-User 2024 & 2032
- Figure 19: Japan APAC CT Industry Revenue Share (%), by End-User 2024 & 2032
- Figure 20: Japan APAC CT Industry Revenue (Million), by Geography 2024 & 2032
- Figure 21: Japan APAC CT Industry Revenue Share (%), by Geography 2024 & 2032
- Figure 22: Japan APAC CT Industry Revenue (Million), by Country 2024 & 2032
- Figure 23: Japan APAC CT Industry Revenue Share (%), by Country 2024 & 2032
- Figure 24: India APAC CT Industry Revenue (Million), by Type 2024 & 2032
- Figure 25: India APAC CT Industry Revenue Share (%), by Type 2024 & 2032
- Figure 26: India APAC CT Industry Revenue (Million), by Application 2024 & 2032
- Figure 27: India APAC CT Industry Revenue Share (%), by Application 2024 & 2032
- Figure 28: India APAC CT Industry Revenue (Million), by End-User 2024 & 2032
- Figure 29: India APAC CT Industry Revenue Share (%), by End-User 2024 & 2032
- Figure 30: India APAC CT Industry Revenue (Million), by Geography 2024 & 2032
- Figure 31: India APAC CT Industry Revenue Share (%), by Geography 2024 & 2032
- Figure 32: India APAC CT Industry Revenue (Million), by Country 2024 & 2032
- Figure 33: India APAC CT Industry Revenue Share (%), by Country 2024 & 2032
- Figure 34: Australia APAC CT Industry Revenue (Million), by Type 2024 & 2032
- Figure 35: Australia APAC CT Industry Revenue Share (%), by Type 2024 & 2032
- Figure 36: Australia APAC CT Industry Revenue (Million), by Application 2024 & 2032
- Figure 37: Australia APAC CT Industry Revenue Share (%), by Application 2024 & 2032
- Figure 38: Australia APAC CT Industry Revenue (Million), by End-User 2024 & 2032
- Figure 39: Australia APAC CT Industry Revenue Share (%), by End-User 2024 & 2032
- Figure 40: Australia APAC CT Industry Revenue (Million), by Geography 2024 & 2032
- Figure 41: Australia APAC CT Industry Revenue Share (%), by Geography 2024 & 2032
- Figure 42: Australia APAC CT Industry Revenue (Million), by Country 2024 & 2032
- Figure 43: Australia APAC CT Industry Revenue Share (%), by Country 2024 & 2032
- Figure 44: South Korea APAC CT Industry Revenue (Million), by Type 2024 & 2032
- Figure 45: South Korea APAC CT Industry Revenue Share (%), by Type 2024 & 2032
- Figure 46: South Korea APAC CT Industry Revenue (Million), by Application 2024 & 2032
- Figure 47: South Korea APAC CT Industry Revenue Share (%), by Application 2024 & 2032
- Figure 48: South Korea APAC CT Industry Revenue (Million), by End-User 2024 & 2032
- Figure 49: South Korea APAC CT Industry Revenue Share (%), by End-User 2024 & 2032
- Figure 50: South Korea APAC CT Industry Revenue (Million), by Geography 2024 & 2032
- Figure 51: South Korea APAC CT Industry Revenue Share (%), by Geography 2024 & 2032
- Figure 52: South Korea APAC CT Industry Revenue (Million), by Country 2024 & 2032
- Figure 53: South Korea APAC CT Industry Revenue Share (%), by Country 2024 & 2032
- Figure 54: Rest of Asia Pacific APAC CT Industry Revenue (Million), by Type 2024 & 2032
- Figure 55: Rest of Asia Pacific APAC CT Industry Revenue Share (%), by Type 2024 & 2032
- Figure 56: Rest of Asia Pacific APAC CT Industry Revenue (Million), by Application 2024 & 2032
- Figure 57: Rest of Asia Pacific APAC CT Industry Revenue Share (%), by Application 2024 & 2032
- Figure 58: Rest of Asia Pacific APAC CT Industry Revenue (Million), by End-User 2024 & 2032
- Figure 59: Rest of Asia Pacific APAC CT Industry Revenue Share (%), by End-User 2024 & 2032
- Figure 60: Rest of Asia Pacific APAC CT Industry Revenue (Million), by Geography 2024 & 2032
- Figure 61: Rest of Asia Pacific APAC CT Industry Revenue Share (%), by Geography 2024 & 2032
- Figure 62: Rest of Asia Pacific APAC CT Industry Revenue (Million), by Country 2024 & 2032
- Figure 63: Rest of Asia Pacific APAC CT Industry Revenue Share (%), by Country 2024 & 2032
List of Tables
- Table 1: Global APAC CT Industry Revenue Million Forecast, by Region 2019 & 2032
- Table 2: Global APAC CT Industry Revenue Million Forecast, by Type 2019 & 2032
- Table 3: Global APAC CT Industry Revenue Million Forecast, by Application 2019 & 2032
- Table 4: Global APAC CT Industry Revenue Million Forecast, by End-User 2019 & 2032
- Table 5: Global APAC CT Industry Revenue Million Forecast, by Geography 2019 & 2032
- Table 6: Global APAC CT Industry Revenue Million Forecast, by Region 2019 & 2032
- Table 7: Global APAC CT Industry Revenue Million Forecast, by Country 2019 & 2032
- Table 8: China APAC CT Industry Revenue (Million) Forecast, by Application 2019 & 2032
- Table 9: Japan APAC CT Industry Revenue (Million) Forecast, by Application 2019 & 2032
- Table 10: India APAC CT Industry Revenue (Million) Forecast, by Application 2019 & 2032
- Table 11: South Korea APAC CT Industry Revenue (Million) Forecast, by Application 2019 & 2032
- Table 12: Southeast Asia APAC CT Industry Revenue (Million) Forecast, by Application 2019 & 2032
- Table 13: Australia APAC CT Industry Revenue (Million) Forecast, by Application 2019 & 2032
- Table 14: Rest of Asia Pacific APAC CT Industry Revenue (Million) Forecast, by Application 2019 & 2032
- Table 15: Global APAC CT Industry Revenue Million Forecast, by Type 2019 & 2032
- Table 16: Global APAC CT Industry Revenue Million Forecast, by Application 2019 & 2032
- Table 17: Global APAC CT Industry Revenue Million Forecast, by End-User 2019 & 2032
- Table 18: Global APAC CT Industry Revenue Million Forecast, by Geography 2019 & 2032
- Table 19: Global APAC CT Industry Revenue Million Forecast, by Country 2019 & 2032
- Table 20: Global APAC CT Industry Revenue Million Forecast, by Type 2019 & 2032
- Table 21: Global APAC CT Industry Revenue Million Forecast, by Application 2019 & 2032
- Table 22: Global APAC CT Industry Revenue Million Forecast, by End-User 2019 & 2032
- Table 23: Global APAC CT Industry Revenue Million Forecast, by Geography 2019 & 2032
- Table 24: Global APAC CT Industry Revenue Million Forecast, by Country 2019 & 2032
- Table 25: Global APAC CT Industry Revenue Million Forecast, by Type 2019 & 2032
- Table 26: Global APAC CT Industry Revenue Million Forecast, by Application 2019 & 2032
- Table 27: Global APAC CT Industry Revenue Million Forecast, by End-User 2019 & 2032
- Table 28: Global APAC CT Industry Revenue Million Forecast, by Geography 2019 & 2032
- Table 29: Global APAC CT Industry Revenue Million Forecast, by Country 2019 & 2032
- Table 30: Global APAC CT Industry Revenue Million Forecast, by Type 2019 & 2032
- Table 31: Global APAC CT Industry Revenue Million Forecast, by Application 2019 & 2032
- Table 32: Global APAC CT Industry Revenue Million Forecast, by End-User 2019 & 2032
- Table 33: Global APAC CT Industry Revenue Million Forecast, by Geography 2019 & 2032
- Table 34: Global APAC CT Industry Revenue Million Forecast, by Country 2019 & 2032
- Table 35: Global APAC CT Industry Revenue Million Forecast, by Type 2019 & 2032
- Table 36: Global APAC CT Industry Revenue Million Forecast, by Application 2019 & 2032
- Table 37: Global APAC CT Industry Revenue Million Forecast, by End-User 2019 & 2032
- Table 38: Global APAC CT Industry Revenue Million Forecast, by Geography 2019 & 2032
- Table 39: Global APAC CT Industry Revenue Million Forecast, by Country 2019 & 2032
- Table 40: Global APAC CT Industry Revenue Million Forecast, by Type 2019 & 2032
- Table 41: Global APAC CT Industry Revenue Million Forecast, by Application 2019 & 2032
- Table 42: Global APAC CT Industry Revenue Million Forecast, by End-User 2019 & 2032
- Table 43: Global APAC CT Industry Revenue Million Forecast, by Geography 2019 & 2032
- Table 44: Global APAC CT Industry Revenue Million Forecast, by Country 2019 & 2032
Frequently Asked Questions
1. What is the projected Compound Annual Growth Rate (CAGR) of the APAC CT Industry?
The projected CAGR is approximately 6.46%.
2. Which companies are prominent players in the APAC CT Industry?
Key companies in the market include GE Healthcare, Koning Corporation, Neusoft Medical Systems Co Ltd, NeuroLogica Corporation, Koninklijke Philips NV, Canon Medical Systems Corporation, Hitachi Healthcare Systems, Siemens Healthineers*List Not Exhaustive, Shenzhen Anke High-Tech Co Ltd, Fujifilm Holdings Corporation.
3. What are the main segments of the APAC CT Industry?
The market segments include Type, Application, End-User, Geography.
4. Can you provide details about the market size?
The market size is estimated to be USD 2.66 Million as of 2022.
5. What are some drivers contributing to market growth?
Rising Geriatric Population and Increase in Incidences of Chronic Diseases; Increase in Shift of Medical Care Toward Image-guided Interventions; Technological Advancements.
6. What are the notable trends driving market growth?
Oncology Segment is Expected to Account for Largest Market Share During the Forecast Period.
7. Are there any restraints impacting market growth?
Lack of Adequate Reimbursement; Stringent Regulatory Framework.
8. Can you provide examples of recent developments in the market?
Dec 2022: Fujifilm India partnered with Soorya Diagnostics LLP Center in Tirur, Kerala. As part of this collaboration, Fujifilm installed its most recent CT Scan machine at Soorya Diagnostics Center in order to promote screening culture and provide people in the region with access to quality healthcare services.
9. What pricing options are available for accessing the report?
Pricing options include single-user, multi-user, and enterprise licenses priced at USD 4750, USD 5250, and USD 8750 respectively.
10. Is the market size provided in terms of value or volume?
The market size is provided in terms of value, measured in Million.
11. Are there any specific market keywords associated with the report?
Yes, the market keyword associated with the report is "APAC CT Industry," which aids in identifying and referencing the specific market segment covered.
12. How do I determine which pricing option suits my needs best?
The pricing options vary based on user requirements and access needs. Individual users may opt for single-user licenses, while businesses requiring broader access may choose multi-user or enterprise licenses for cost-effective access to the report.
13. Are there any additional resources or data provided in the APAC CT Industry report?
While the report offers comprehensive insights, it's advisable to review the specific contents or supplementary materials provided to ascertain if additional resources or data are available.
14. How can I stay updated on further developments or reports in the APAC CT Industry?
To stay informed about further developments, trends, and reports in the APAC CT Industry, consider subscribing to industry newsletters, following relevant companies and organizations, or regularly checking reputable industry news sources and publications.
Methodology
Step 1 - Identification of Relevant Samples Size from Population Database


Step 2 - Approaches for Defining Global Market Size (Value, Volume* & Price*)

Note*: In applicable scenarios
Step 3 - Data Sources
Primary Research
- Web Analytics
- Survey Reports
- Research Institute
- Latest Research Reports
- Opinion Leaders
Secondary Research
- Annual Reports
- White Paper
- Latest Press Release
- Industry Association
- Paid Database
- Investor Presentations

Step 4 - Data Triangulation
Involves using different sources of information in order to increase the validity of a study
These sources are likely to be stakeholders in a program - participants, other researchers, program staff, other community members, and so on.
Then we put all data in single framework & apply various statistical tools to find out the dynamic on the market.
During the analysis stage, feedback from the stakeholder groups would be compared to determine areas of agreement as well as areas of divergence
