

Key Insights
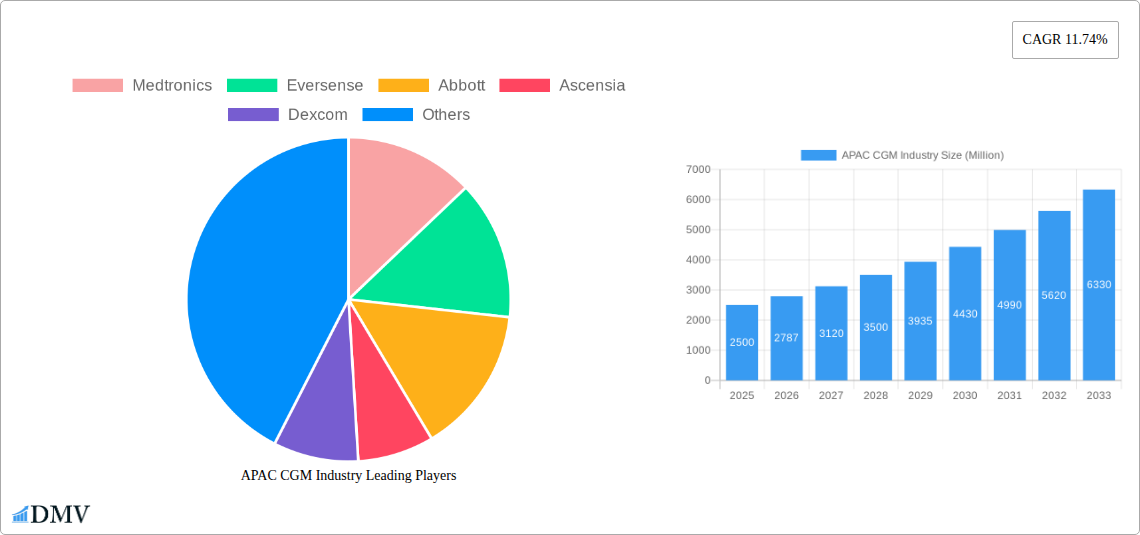
The Asia-Pacific (APAC) Continuous Glucose Monitoring (CGM) market is experiencing robust growth, driven by rising diabetes prevalence, increasing awareness of advanced diabetes management, and technological advancements leading to more accurate and user-friendly devices. The region's diverse population and varying healthcare infrastructure present both opportunities and challenges. China, India, and Japan are key market drivers, contributing significantly to the overall market size. The increasing adoption of CGM systems in these countries, fueled by government initiatives promoting better diabetes care and the expanding middle class with greater disposable income, is a significant factor. However, high device costs, limited healthcare access in certain regions, and a lack of awareness about CGM technology in some areas pose constraints to market penetration. The market is segmented into components (sensors and durables) reflecting the various technologies and consumables involved in CGM systems. Key players like Medtronic, Eversense, Abbott, Ascensia, and Dexcom are actively engaged in developing innovative products and expanding their market presence, further contributing to the market's dynamism. The forecast period of 2025-2033 projects sustained growth, primarily driven by continuous technological improvements, improved accuracy, and the development of integrated data management systems that enhance patient care and remote monitoring capabilities.
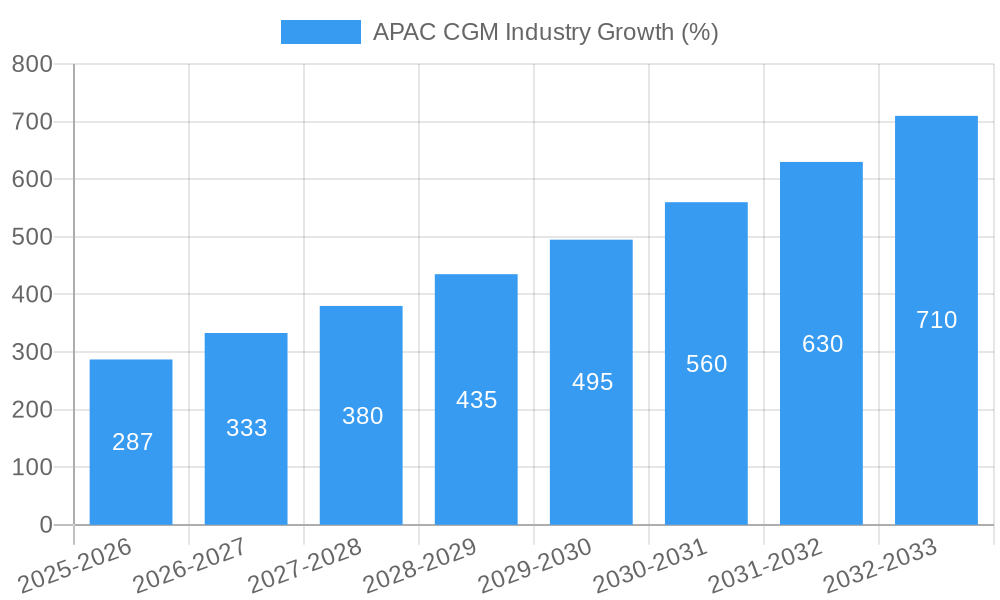
The CAGR of 11.74% indicates a significant upward trajectory for the APAC CGM market. This growth is anticipated to be fueled by expanding access to healthcare, particularly in emerging economies within the region. The increasing adoption of telehealth and remote patient monitoring solutions will further accelerate market expansion. While challenges like affordability and regulatory hurdles remain, the long-term prospects for the APAC CGM market are positive, with significant potential for growth across various segments and geographical areas. Continuous innovation in sensor technology, data analytics, and integration with other diabetes management devices will be crucial for sustaining this growth and improving patient outcomes. The market is expected to see increasing competition among existing players and potentially new entrants seeking to capitalize on this expanding opportunity.
APAC CGM Industry: Market Analysis, Trends & Forecast (2019-2033)
This comprehensive report provides an in-depth analysis of the Asia-Pacific (APAC) Continuous Glucose Monitoring (CGM) industry, encompassing market size, growth drivers, competitive landscape, and future projections. The study period covers 2019-2033, with 2025 as the base and estimated year. The report leverages robust data and insights to offer a strategic outlook for stakeholders, investors, and industry professionals. The total market value is projected to reach xx Million by 2033.
APAC CGM Industry Market Composition & Trends
The APAC CGM market is characterized by a dynamic interplay of factors influencing its growth trajectory. Market concentration is moderately high, with key players like Medtronic, Eversense, Abbott, Ascensia, and Dexcom holding significant shares. Innovation is driven by advancements in sensor technology, miniaturization, and data analytics capabilities. The regulatory landscape varies across APAC nations, with some exhibiting faster adoption rates due to supportive policies and reimbursement schemes. Substitute products, such as self-monitoring blood glucose (SMBG) systems, pose a competitive threat, although CGM's superior convenience and data insights are gradually increasing its adoption. End-users primarily comprise individuals with diabetes, categorized by type 1 and type 2 diabetes, along with healthcare professionals and institutions.
M&A activity has been significant, with deals focused on expanding market reach and acquiring innovative technologies. For instance, the total value of M&A deals in the period 2019-2024 is estimated at xx Million. Market share distribution is approximately as follows: Abbott (xx%), Dexcom (xx%), Medtronic (xx%), Ascensia (xx%), Eversense (xx%), and Others (xx%).
APAC CGM Industry Industry Evolution
The APAC CGM market has experienced robust growth, fueled by rising diabetes prevalence, increasing healthcare expenditure, and growing awareness about the benefits of CGM. From 2019 to 2024, the market witnessed a Compound Annual Growth Rate (CAGR) of xx%. This growth trajectory is expected to continue throughout the forecast period (2025-2033), albeit at a slightly moderated pace due to market saturation in certain regions. Technological advancements, including the development of more accurate, less invasive, and user-friendly sensors, are pivotal in driving market expansion. Furthermore, a shift in consumer preference towards convenient and data-driven diabetes management solutions has propelled CGM adoption. The growing adoption of telehealth and remote patient monitoring further enhances the market potential. By 2033, the market is projected to reach xx Million, reflecting substantial growth compared to the 2024 figures.
Leading Regions, Countries, or Segments in APAC CGM Industry
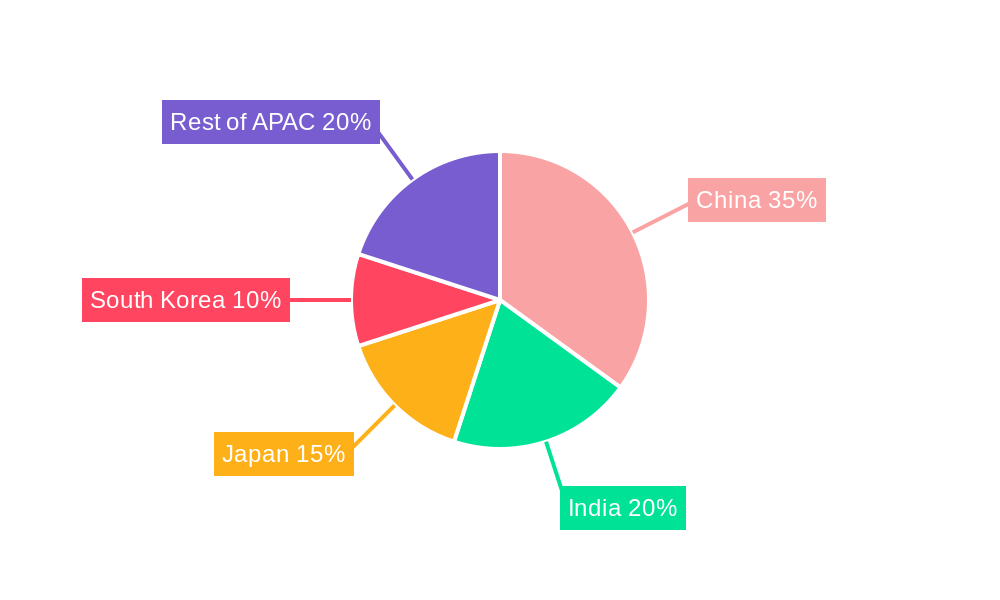
- Dominant Region: Japan is currently the leading market in the APAC region, driven by factors including robust healthcare infrastructure, favorable reimbursement policies, and high diabetes prevalence.
- Dominant Country: Within APAC, Japan leads in CGM adoption due to its well-developed healthcare system and increased government support for advanced diabetes management technologies. China, India, and Australia are also experiencing significant growth but trail Japan due to varying levels of healthcare access and regulatory environments.
- Dominant Segments: Both the Sensors and Durables segments are crucial for CGM systems, with the Sensors segment currently leading due to the continuous need for replacement. However, the Durables segment shows strong growth potential as the market matures and more people adopt CGM for long-term diabetes management.
Key Drivers:
- Investment Trends: Significant investments in R&D and infrastructure are boosting the market.
- Regulatory Support: Favorable reimbursement policies and regulatory approvals in key markets like Japan are accelerating adoption rates.
- Technological Advancements: The development of more accurate, affordable, and user-friendly sensors plays a critical role.
APAC CGM Industry Product Innovations
Recent innovations in APAC's CGM market include the development of smaller, more comfortable sensors with improved accuracy and longer wear times. Integrated data management platforms offer patients more seamless access to their glucose data, enabling better decision-making and improved healthcare outcomes. The focus is on enhancing user experience and integrating CGM systems with other diabetes management tools such as insulin pumps. Unique selling propositions often include features like real-time glucose readings, predictive alerts for hypo- and hyperglycemia, and data sharing capabilities with healthcare providers.
Propelling Factors for APAC CGM Industry Growth
Several factors are propelling growth in the APAC CGM industry: The rising prevalence of diabetes, especially type 1 and type 2, forms a massive target market. Advancements in sensor technology, such as smaller, more accurate, and longer-lasting sensors, improve user experience and efficacy. Increasing healthcare expenditure and government initiatives aimed at promoting early diabetes detection and management create a favorable environment for CGM adoption. Supportive reimbursement policies in several APAC countries directly incentivize the use of CGM systems, making them more accessible to patients.
Obstacles in the APAC CGM Industry Market
Despite the growth potential, several obstacles hinder market expansion. High costs associated with CGM systems pose a barrier for many patients, particularly in countries with limited healthcare insurance coverage. Regulatory hurdles and variations in reimbursement policies across different APAC nations create challenges for manufacturers. Supply chain disruptions, particularly evident post-pandemic, impacted the availability and cost of CGM devices. Intense competition among established and emerging players also contributes to price pressure and limits profit margins.
Future Opportunities in APAC CGM Industry
Significant opportunities exist in untapped markets within APAC, with a focus on expanding access to CGM in underserved regions. Integration of CGM systems with artificial intelligence and machine learning technologies holds immense potential for personalized diabetes management and improved clinical outcomes. The development of closed-loop systems that automatically adjust insulin delivery based on CGM data represents a significant frontier in diabetes management, offering immense opportunities.
Major Players in the APAC CGM Industry Ecosystem
Key Developments in APAC CGM Industry Industry
- July 2021: Dexcom and Terumo Corporation signed an agreement for exclusively distributing Dexcom G6 across Japan, significantly expanding Dexcom's market reach in a key APAC region.
- March 2022: Abbott received expanded reimbursement coverage in Japan for the FreeStyle Libre system, increasing accessibility and driving market penetration. This decision by Japan's Ministry of Health, Labor, and Welfare broadened CGM access to all insulin-using individuals with diabetes.
Strategic APAC CGM Industry Market Forecast
The APAC CGM market is poised for continued growth, driven by increasing diabetes prevalence, technological advancements, and supportive regulatory landscapes. While challenges such as cost and access remain, the market's future is bright, particularly with the integration of AI and closed-loop systems. The focus on improving patient outcomes and enhancing convenience will fuel demand and drive market expansion throughout the forecast period, reaching a projected value of xx Million by 2033.
APAC CGM Industry Segmentation
-
1. Component
- 1.1. Sensors
- 1.2. Durables
-
2. Geography
- 2.1. Australia
- 2.2. China
- 2.3. India
- 2.4. Indonesia
- 2.5. Japan
- 2.6. Malaysia
- 2.7. Philippines
- 2.8. South Korea
- 2.9. Thailand
- 2.10. Vietnam
- 2.11. Rest of Asia-Pacific
APAC CGM Industry Segmentation By Geography
- 1. Australia
- 2. China
- 3. India
- 4. Indonesia
- 5. Japan
- 6. Malaysia
- 7. Philippines
- 8. South Korea
- 9. Thailand
- 10. Vietnam
- 11. Rest of Asia Pacific
APAC CGM Industry REPORT HIGHLIGHTS
| Aspects | Details |
|---|---|
| Study Period | 2019-2033 |
| Base Year | 2024 |
| Estimated Year | 2025 |
| Forecast Period | 2025-2033 |
| Historical Period | 2019-2024 |
| Growth Rate | CAGR of 11.74% from 2019-2033 |
| Segmentation |
|
Table of Contents
- 1. Introduction
- 1.1. Research Scope
- 1.2. Market Segmentation
- 1.3. Research Methodology
- 1.4. Definitions and Assumptions
- 2. Executive Summary
- 2.1. Introduction
- 3. Market Dynamics
- 3.1. Introduction
- 3.2. Market Drivers
- 3.2.1. Growing Burden of Gastrointestinal Diseases; Rising Preference of Point of Care Test
- 3.3. Market Restrains
- 3.3.1. High Cost of Instruments
- 3.4. Market Trends
- 3.4.1. The sensors Segment is having the highest market share in Asia-Pacific Continuous Glucose Monitoring Market.
- 4. Market Factor Analysis
- 4.1. Porters Five Forces
- 4.2. Supply/Value Chain
- 4.3. PESTEL analysis
- 4.4. Market Entropy
- 4.5. Patent/Trademark Analysis
- 5. Global APAC CGM Industry Analysis, Insights and Forecast, 2019-2031
- 5.1. Market Analysis, Insights and Forecast - by Component
- 5.1.1. Sensors
- 5.1.2. Durables
- 5.2. Market Analysis, Insights and Forecast - by Geography
- 5.2.1. Australia
- 5.2.2. China
- 5.2.3. India
- 5.2.4. Indonesia
- 5.2.5. Japan
- 5.2.6. Malaysia
- 5.2.7. Philippines
- 5.2.8. South Korea
- 5.2.9. Thailand
- 5.2.10. Vietnam
- 5.2.11. Rest of Asia-Pacific
- 5.3. Market Analysis, Insights and Forecast - by Region
- 5.3.1. Australia
- 5.3.2. China
- 5.3.3. India
- 5.3.4. Indonesia
- 5.3.5. Japan
- 5.3.6. Malaysia
- 5.3.7. Philippines
- 5.3.8. South Korea
- 5.3.9. Thailand
- 5.3.10. Vietnam
- 5.3.11. Rest of Asia Pacific
- 5.1. Market Analysis, Insights and Forecast - by Component
- 6. Australia APAC CGM Industry Analysis, Insights and Forecast, 2019-2031
- 6.1. Market Analysis, Insights and Forecast - by Component
- 6.1.1. Sensors
- 6.1.2. Durables
- 6.2. Market Analysis, Insights and Forecast - by Geography
- 6.2.1. Australia
- 6.2.2. China
- 6.2.3. India
- 6.2.4. Indonesia
- 6.2.5. Japan
- 6.2.6. Malaysia
- 6.2.7. Philippines
- 6.2.8. South Korea
- 6.2.9. Thailand
- 6.2.10. Vietnam
- 6.2.11. Rest of Asia-Pacific
- 6.1. Market Analysis, Insights and Forecast - by Component
- 7. China APAC CGM Industry Analysis, Insights and Forecast, 2019-2031
- 7.1. Market Analysis, Insights and Forecast - by Component
- 7.1.1. Sensors
- 7.1.2. Durables
- 7.2. Market Analysis, Insights and Forecast - by Geography
- 7.2.1. Australia
- 7.2.2. China
- 7.2.3. India
- 7.2.4. Indonesia
- 7.2.5. Japan
- 7.2.6. Malaysia
- 7.2.7. Philippines
- 7.2.8. South Korea
- 7.2.9. Thailand
- 7.2.10. Vietnam
- 7.2.11. Rest of Asia-Pacific
- 7.1. Market Analysis, Insights and Forecast - by Component
- 8. India APAC CGM Industry Analysis, Insights and Forecast, 2019-2031
- 8.1. Market Analysis, Insights and Forecast - by Component
- 8.1.1. Sensors
- 8.1.2. Durables
- 8.2. Market Analysis, Insights and Forecast - by Geography
- 8.2.1. Australia
- 8.2.2. China
- 8.2.3. India
- 8.2.4. Indonesia
- 8.2.5. Japan
- 8.2.6. Malaysia
- 8.2.7. Philippines
- 8.2.8. South Korea
- 8.2.9. Thailand
- 8.2.10. Vietnam
- 8.2.11. Rest of Asia-Pacific
- 8.1. Market Analysis, Insights and Forecast - by Component
- 9. Indonesia APAC CGM Industry Analysis, Insights and Forecast, 2019-2031
- 9.1. Market Analysis, Insights and Forecast - by Component
- 9.1.1. Sensors
- 9.1.2. Durables
- 9.2. Market Analysis, Insights and Forecast - by Geography
- 9.2.1. Australia
- 9.2.2. China
- 9.2.3. India
- 9.2.4. Indonesia
- 9.2.5. Japan
- 9.2.6. Malaysia
- 9.2.7. Philippines
- 9.2.8. South Korea
- 9.2.9. Thailand
- 9.2.10. Vietnam
- 9.2.11. Rest of Asia-Pacific
- 9.1. Market Analysis, Insights and Forecast - by Component
- 10. Japan APAC CGM Industry Analysis, Insights and Forecast, 2019-2031
- 10.1. Market Analysis, Insights and Forecast - by Component
- 10.1.1. Sensors
- 10.1.2. Durables
- 10.2. Market Analysis, Insights and Forecast - by Geography
- 10.2.1. Australia
- 10.2.2. China
- 10.2.3. India
- 10.2.4. Indonesia
- 10.2.5. Japan
- 10.2.6. Malaysia
- 10.2.7. Philippines
- 10.2.8. South Korea
- 10.2.9. Thailand
- 10.2.10. Vietnam
- 10.2.11. Rest of Asia-Pacific
- 10.1. Market Analysis, Insights and Forecast - by Component
- 11. Malaysia APAC CGM Industry Analysis, Insights and Forecast, 2019-2031
- 11.1. Market Analysis, Insights and Forecast - by Component
- 11.1.1. Sensors
- 11.1.2. Durables
- 11.2. Market Analysis, Insights and Forecast - by Geography
- 11.2.1. Australia
- 11.2.2. China
- 11.2.3. India
- 11.2.4. Indonesia
- 11.2.5. Japan
- 11.2.6. Malaysia
- 11.2.7. Philippines
- 11.2.8. South Korea
- 11.2.9. Thailand
- 11.2.10. Vietnam
- 11.2.11. Rest of Asia-Pacific
- 11.1. Market Analysis, Insights and Forecast - by Component
- 12. Philippines APAC CGM Industry Analysis, Insights and Forecast, 2019-2031
- 12.1. Market Analysis, Insights and Forecast - by Component
- 12.1.1. Sensors
- 12.1.2. Durables
- 12.2. Market Analysis, Insights and Forecast - by Geography
- 12.2.1. Australia
- 12.2.2. China
- 12.2.3. India
- 12.2.4. Indonesia
- 12.2.5. Japan
- 12.2.6. Malaysia
- 12.2.7. Philippines
- 12.2.8. South Korea
- 12.2.9. Thailand
- 12.2.10. Vietnam
- 12.2.11. Rest of Asia-Pacific
- 12.1. Market Analysis, Insights and Forecast - by Component
- 13. South Korea APAC CGM Industry Analysis, Insights and Forecast, 2019-2031
- 13.1. Market Analysis, Insights and Forecast - by Component
- 13.1.1. Sensors
- 13.1.2. Durables
- 13.2. Market Analysis, Insights and Forecast - by Geography
- 13.2.1. Australia
- 13.2.2. China
- 13.2.3. India
- 13.2.4. Indonesia
- 13.2.5. Japan
- 13.2.6. Malaysia
- 13.2.7. Philippines
- 13.2.8. South Korea
- 13.2.9. Thailand
- 13.2.10. Vietnam
- 13.2.11. Rest of Asia-Pacific
- 13.1. Market Analysis, Insights and Forecast - by Component
- 14. Thailand APAC CGM Industry Analysis, Insights and Forecast, 2019-2031
- 14.1. Market Analysis, Insights and Forecast - by Component
- 14.1.1. Sensors
- 14.1.2. Durables
- 14.2. Market Analysis, Insights and Forecast - by Geography
- 14.2.1. Australia
- 14.2.2. China
- 14.2.3. India
- 14.2.4. Indonesia
- 14.2.5. Japan
- 14.2.6. Malaysia
- 14.2.7. Philippines
- 14.2.8. South Korea
- 14.2.9. Thailand
- 14.2.10. Vietnam
- 14.2.11. Rest of Asia-Pacific
- 14.1. Market Analysis, Insights and Forecast - by Component
- 15. Vietnam APAC CGM Industry Analysis, Insights and Forecast, 2019-2031
- 15.1. Market Analysis, Insights and Forecast - by Component
- 15.1.1. Sensors
- 15.1.2. Durables
- 15.2. Market Analysis, Insights and Forecast - by Geography
- 15.2.1. Australia
- 15.2.2. China
- 15.2.3. India
- 15.2.4. Indonesia
- 15.2.5. Japan
- 15.2.6. Malaysia
- 15.2.7. Philippines
- 15.2.8. South Korea
- 15.2.9. Thailand
- 15.2.10. Vietnam
- 15.2.11. Rest of Asia-Pacific
- 15.1. Market Analysis, Insights and Forecast - by Component
- 16. Rest of Asia Pacific APAC CGM Industry Analysis, Insights and Forecast, 2019-2031
- 16.1. Market Analysis, Insights and Forecast - by Component
- 16.1.1. Sensors
- 16.1.2. Durables
- 16.2. Market Analysis, Insights and Forecast - by Geography
- 16.2.1. Australia
- 16.2.2. China
- 16.2.3. India
- 16.2.4. Indonesia
- 16.2.5. Japan
- 16.2.6. Malaysia
- 16.2.7. Philippines
- 16.2.8. South Korea
- 16.2.9. Thailand
- 16.2.10. Vietnam
- 16.2.11. Rest of Asia-Pacific
- 16.1. Market Analysis, Insights and Forecast - by Component
- 17. China APAC CGM Industry Analysis, Insights and Forecast, 2019-2031
- 18. Japan APAC CGM Industry Analysis, Insights and Forecast, 2019-2031
- 19. India APAC CGM Industry Analysis, Insights and Forecast, 2019-2031
- 20. South Korea APAC CGM Industry Analysis, Insights and Forecast, 2019-2031
- 21. Taiwan APAC CGM Industry Analysis, Insights and Forecast, 2019-2031
- 22. Australia APAC CGM Industry Analysis, Insights and Forecast, 2019-2031
- 23. Rest of Asia-Pacific APAC CGM Industry Analysis, Insights and Forecast, 2019-2031
- 24. Competitive Analysis
- 24.1. Global Market Share Analysis 2024
- 24.2. Company Profiles
- 24.2.1 Medtronics
- 24.2.1.1. Overview
- 24.2.1.2. Products
- 24.2.1.3. SWOT Analysis
- 24.2.1.4. Recent Developments
- 24.2.1.5. Financials (Based on Availability)
- 24.2.2 Eversense
- 24.2.2.1. Overview
- 24.2.2.2. Products
- 24.2.2.3. SWOT Analysis
- 24.2.2.4. Recent Developments
- 24.2.2.5. Financials (Based on Availability)
- 24.2.3 Abbott
- 24.2.3.1. Overview
- 24.2.3.2. Products
- 24.2.3.3. SWOT Analysis
- 24.2.3.4. Recent Developments
- 24.2.3.5. Financials (Based on Availability)
- 24.2.4 Ascensia
- 24.2.4.1. Overview
- 24.2.4.2. Products
- 24.2.4.3. SWOT Analysis
- 24.2.4.4. Recent Developments
- 24.2.4.5. Financials (Based on Availability)
- 24.2.5 Dexcom
- 24.2.5.1. Overview
- 24.2.5.2. Products
- 24.2.5.3. SWOT Analysis
- 24.2.5.4. Recent Developments
- 24.2.5.5. Financials (Based on Availability)
- 24.2.1 Medtronics
List of Figures
- Figure 1: Global APAC CGM Industry Revenue Breakdown (Million, %) by Region 2024 & 2032
- Figure 2: Global APAC CGM Industry Volume Breakdown (K Unit, %) by Region 2024 & 2032
- Figure 3: Asia Pacific APAC CGM Industry Revenue (Million), by Country 2024 & 2032
- Figure 4: Asia Pacific APAC CGM Industry Volume (K Unit), by Country 2024 & 2032
- Figure 5: Asia Pacific APAC CGM Industry Revenue Share (%), by Country 2024 & 2032
- Figure 6: Asia Pacific APAC CGM Industry Volume Share (%), by Country 2024 & 2032
- Figure 7: Australia APAC CGM Industry Revenue (Million), by Component 2024 & 2032
- Figure 8: Australia APAC CGM Industry Volume (K Unit), by Component 2024 & 2032
- Figure 9: Australia APAC CGM Industry Revenue Share (%), by Component 2024 & 2032
- Figure 10: Australia APAC CGM Industry Volume Share (%), by Component 2024 & 2032
- Figure 11: Australia APAC CGM Industry Revenue (Million), by Geography 2024 & 2032
- Figure 12: Australia APAC CGM Industry Volume (K Unit), by Geography 2024 & 2032
- Figure 13: Australia APAC CGM Industry Revenue Share (%), by Geography 2024 & 2032
- Figure 14: Australia APAC CGM Industry Volume Share (%), by Geography 2024 & 2032
- Figure 15: Australia APAC CGM Industry Revenue (Million), by Country 2024 & 2032
- Figure 16: Australia APAC CGM Industry Volume (K Unit), by Country 2024 & 2032
- Figure 17: Australia APAC CGM Industry Revenue Share (%), by Country 2024 & 2032
- Figure 18: Australia APAC CGM Industry Volume Share (%), by Country 2024 & 2032
- Figure 19: China APAC CGM Industry Revenue (Million), by Component 2024 & 2032
- Figure 20: China APAC CGM Industry Volume (K Unit), by Component 2024 & 2032
- Figure 21: China APAC CGM Industry Revenue Share (%), by Component 2024 & 2032
- Figure 22: China APAC CGM Industry Volume Share (%), by Component 2024 & 2032
- Figure 23: China APAC CGM Industry Revenue (Million), by Geography 2024 & 2032
- Figure 24: China APAC CGM Industry Volume (K Unit), by Geography 2024 & 2032
- Figure 25: China APAC CGM Industry Revenue Share (%), by Geography 2024 & 2032
- Figure 26: China APAC CGM Industry Volume Share (%), by Geography 2024 & 2032
- Figure 27: China APAC CGM Industry Revenue (Million), by Country 2024 & 2032
- Figure 28: China APAC CGM Industry Volume (K Unit), by Country 2024 & 2032
- Figure 29: China APAC CGM Industry Revenue Share (%), by Country 2024 & 2032
- Figure 30: China APAC CGM Industry Volume Share (%), by Country 2024 & 2032
- Figure 31: India APAC CGM Industry Revenue (Million), by Component 2024 & 2032
- Figure 32: India APAC CGM Industry Volume (K Unit), by Component 2024 & 2032
- Figure 33: India APAC CGM Industry Revenue Share (%), by Component 2024 & 2032
- Figure 34: India APAC CGM Industry Volume Share (%), by Component 2024 & 2032
- Figure 35: India APAC CGM Industry Revenue (Million), by Geography 2024 & 2032
- Figure 36: India APAC CGM Industry Volume (K Unit), by Geography 2024 & 2032
- Figure 37: India APAC CGM Industry Revenue Share (%), by Geography 2024 & 2032
- Figure 38: India APAC CGM Industry Volume Share (%), by Geography 2024 & 2032
- Figure 39: India APAC CGM Industry Revenue (Million), by Country 2024 & 2032
- Figure 40: India APAC CGM Industry Volume (K Unit), by Country 2024 & 2032
- Figure 41: India APAC CGM Industry Revenue Share (%), by Country 2024 & 2032
- Figure 42: India APAC CGM Industry Volume Share (%), by Country 2024 & 2032
- Figure 43: Indonesia APAC CGM Industry Revenue (Million), by Component 2024 & 2032
- Figure 44: Indonesia APAC CGM Industry Volume (K Unit), by Component 2024 & 2032
- Figure 45: Indonesia APAC CGM Industry Revenue Share (%), by Component 2024 & 2032
- Figure 46: Indonesia APAC CGM Industry Volume Share (%), by Component 2024 & 2032
- Figure 47: Indonesia APAC CGM Industry Revenue (Million), by Geography 2024 & 2032
- Figure 48: Indonesia APAC CGM Industry Volume (K Unit), by Geography 2024 & 2032
- Figure 49: Indonesia APAC CGM Industry Revenue Share (%), by Geography 2024 & 2032
- Figure 50: Indonesia APAC CGM Industry Volume Share (%), by Geography 2024 & 2032
- Figure 51: Indonesia APAC CGM Industry Revenue (Million), by Country 2024 & 2032
- Figure 52: Indonesia APAC CGM Industry Volume (K Unit), by Country 2024 & 2032
- Figure 53: Indonesia APAC CGM Industry Revenue Share (%), by Country 2024 & 2032
- Figure 54: Indonesia APAC CGM Industry Volume Share (%), by Country 2024 & 2032
- Figure 55: Japan APAC CGM Industry Revenue (Million), by Component 2024 & 2032
- Figure 56: Japan APAC CGM Industry Volume (K Unit), by Component 2024 & 2032
- Figure 57: Japan APAC CGM Industry Revenue Share (%), by Component 2024 & 2032
- Figure 58: Japan APAC CGM Industry Volume Share (%), by Component 2024 & 2032
- Figure 59: Japan APAC CGM Industry Revenue (Million), by Geography 2024 & 2032
- Figure 60: Japan APAC CGM Industry Volume (K Unit), by Geography 2024 & 2032
- Figure 61: Japan APAC CGM Industry Revenue Share (%), by Geography 2024 & 2032
- Figure 62: Japan APAC CGM Industry Volume Share (%), by Geography 2024 & 2032
- Figure 63: Japan APAC CGM Industry Revenue (Million), by Country 2024 & 2032
- Figure 64: Japan APAC CGM Industry Volume (K Unit), by Country 2024 & 2032
- Figure 65: Japan APAC CGM Industry Revenue Share (%), by Country 2024 & 2032
- Figure 66: Japan APAC CGM Industry Volume Share (%), by Country 2024 & 2032
- Figure 67: Malaysia APAC CGM Industry Revenue (Million), by Component 2024 & 2032
- Figure 68: Malaysia APAC CGM Industry Volume (K Unit), by Component 2024 & 2032
- Figure 69: Malaysia APAC CGM Industry Revenue Share (%), by Component 2024 & 2032
- Figure 70: Malaysia APAC CGM Industry Volume Share (%), by Component 2024 & 2032
- Figure 71: Malaysia APAC CGM Industry Revenue (Million), by Geography 2024 & 2032
- Figure 72: Malaysia APAC CGM Industry Volume (K Unit), by Geography 2024 & 2032
- Figure 73: Malaysia APAC CGM Industry Revenue Share (%), by Geography 2024 & 2032
- Figure 74: Malaysia APAC CGM Industry Volume Share (%), by Geography 2024 & 2032
- Figure 75: Malaysia APAC CGM Industry Revenue (Million), by Country 2024 & 2032
- Figure 76: Malaysia APAC CGM Industry Volume (K Unit), by Country 2024 & 2032
- Figure 77: Malaysia APAC CGM Industry Revenue Share (%), by Country 2024 & 2032
- Figure 78: Malaysia APAC CGM Industry Volume Share (%), by Country 2024 & 2032
- Figure 79: Philippines APAC CGM Industry Revenue (Million), by Component 2024 & 2032
- Figure 80: Philippines APAC CGM Industry Volume (K Unit), by Component 2024 & 2032
- Figure 81: Philippines APAC CGM Industry Revenue Share (%), by Component 2024 & 2032
- Figure 82: Philippines APAC CGM Industry Volume Share (%), by Component 2024 & 2032
- Figure 83: Philippines APAC CGM Industry Revenue (Million), by Geography 2024 & 2032
- Figure 84: Philippines APAC CGM Industry Volume (K Unit), by Geography 2024 & 2032
- Figure 85: Philippines APAC CGM Industry Revenue Share (%), by Geography 2024 & 2032
- Figure 86: Philippines APAC CGM Industry Volume Share (%), by Geography 2024 & 2032
- Figure 87: Philippines APAC CGM Industry Revenue (Million), by Country 2024 & 2032
- Figure 88: Philippines APAC CGM Industry Volume (K Unit), by Country 2024 & 2032
- Figure 89: Philippines APAC CGM Industry Revenue Share (%), by Country 2024 & 2032
- Figure 90: Philippines APAC CGM Industry Volume Share (%), by Country 2024 & 2032
- Figure 91: South Korea APAC CGM Industry Revenue (Million), by Component 2024 & 2032
- Figure 92: South Korea APAC CGM Industry Volume (K Unit), by Component 2024 & 2032
- Figure 93: South Korea APAC CGM Industry Revenue Share (%), by Component 2024 & 2032
- Figure 94: South Korea APAC CGM Industry Volume Share (%), by Component 2024 & 2032
- Figure 95: South Korea APAC CGM Industry Revenue (Million), by Geography 2024 & 2032
- Figure 96: South Korea APAC CGM Industry Volume (K Unit), by Geography 2024 & 2032
- Figure 97: South Korea APAC CGM Industry Revenue Share (%), by Geography 2024 & 2032
- Figure 98: South Korea APAC CGM Industry Volume Share (%), by Geography 2024 & 2032
- Figure 99: South Korea APAC CGM Industry Revenue (Million), by Country 2024 & 2032
- Figure 100: South Korea APAC CGM Industry Volume (K Unit), by Country 2024 & 2032
- Figure 101: South Korea APAC CGM Industry Revenue Share (%), by Country 2024 & 2032
- Figure 102: South Korea APAC CGM Industry Volume Share (%), by Country 2024 & 2032
- Figure 103: Thailand APAC CGM Industry Revenue (Million), by Component 2024 & 2032
- Figure 104: Thailand APAC CGM Industry Volume (K Unit), by Component 2024 & 2032
- Figure 105: Thailand APAC CGM Industry Revenue Share (%), by Component 2024 & 2032
- Figure 106: Thailand APAC CGM Industry Volume Share (%), by Component 2024 & 2032
- Figure 107: Thailand APAC CGM Industry Revenue (Million), by Geography 2024 & 2032
- Figure 108: Thailand APAC CGM Industry Volume (K Unit), by Geography 2024 & 2032
- Figure 109: Thailand APAC CGM Industry Revenue Share (%), by Geography 2024 & 2032
- Figure 110: Thailand APAC CGM Industry Volume Share (%), by Geography 2024 & 2032
- Figure 111: Thailand APAC CGM Industry Revenue (Million), by Country 2024 & 2032
- Figure 112: Thailand APAC CGM Industry Volume (K Unit), by Country 2024 & 2032
- Figure 113: Thailand APAC CGM Industry Revenue Share (%), by Country 2024 & 2032
- Figure 114: Thailand APAC CGM Industry Volume Share (%), by Country 2024 & 2032
- Figure 115: Vietnam APAC CGM Industry Revenue (Million), by Component 2024 & 2032
- Figure 116: Vietnam APAC CGM Industry Volume (K Unit), by Component 2024 & 2032
- Figure 117: Vietnam APAC CGM Industry Revenue Share (%), by Component 2024 & 2032
- Figure 118: Vietnam APAC CGM Industry Volume Share (%), by Component 2024 & 2032
- Figure 119: Vietnam APAC CGM Industry Revenue (Million), by Geography 2024 & 2032
- Figure 120: Vietnam APAC CGM Industry Volume (K Unit), by Geography 2024 & 2032
- Figure 121: Vietnam APAC CGM Industry Revenue Share (%), by Geography 2024 & 2032
- Figure 122: Vietnam APAC CGM Industry Volume Share (%), by Geography 2024 & 2032
- Figure 123: Vietnam APAC CGM Industry Revenue (Million), by Country 2024 & 2032
- Figure 124: Vietnam APAC CGM Industry Volume (K Unit), by Country 2024 & 2032
- Figure 125: Vietnam APAC CGM Industry Revenue Share (%), by Country 2024 & 2032
- Figure 126: Vietnam APAC CGM Industry Volume Share (%), by Country 2024 & 2032
- Figure 127: Rest of Asia Pacific APAC CGM Industry Revenue (Million), by Component 2024 & 2032
- Figure 128: Rest of Asia Pacific APAC CGM Industry Volume (K Unit), by Component 2024 & 2032
- Figure 129: Rest of Asia Pacific APAC CGM Industry Revenue Share (%), by Component 2024 & 2032
- Figure 130: Rest of Asia Pacific APAC CGM Industry Volume Share (%), by Component 2024 & 2032
- Figure 131: Rest of Asia Pacific APAC CGM Industry Revenue (Million), by Geography 2024 & 2032
- Figure 132: Rest of Asia Pacific APAC CGM Industry Volume (K Unit), by Geography 2024 & 2032
- Figure 133: Rest of Asia Pacific APAC CGM Industry Revenue Share (%), by Geography 2024 & 2032
- Figure 134: Rest of Asia Pacific APAC CGM Industry Volume Share (%), by Geography 2024 & 2032
- Figure 135: Rest of Asia Pacific APAC CGM Industry Revenue (Million), by Country 2024 & 2032
- Figure 136: Rest of Asia Pacific APAC CGM Industry Volume (K Unit), by Country 2024 & 2032
- Figure 137: Rest of Asia Pacific APAC CGM Industry Revenue Share (%), by Country 2024 & 2032
- Figure 138: Rest of Asia Pacific APAC CGM Industry Volume Share (%), by Country 2024 & 2032
List of Tables
- Table 1: Global APAC CGM Industry Revenue Million Forecast, by Region 2019 & 2032
- Table 2: Global APAC CGM Industry Volume K Unit Forecast, by Region 2019 & 2032
- Table 3: Global APAC CGM Industry Revenue Million Forecast, by Component 2019 & 2032
- Table 4: Global APAC CGM Industry Volume K Unit Forecast, by Component 2019 & 2032
- Table 5: Global APAC CGM Industry Revenue Million Forecast, by Geography 2019 & 2032
- Table 6: Global APAC CGM Industry Volume K Unit Forecast, by Geography 2019 & 2032
- Table 7: Global APAC CGM Industry Revenue Million Forecast, by Region 2019 & 2032
- Table 8: Global APAC CGM Industry Volume K Unit Forecast, by Region 2019 & 2032
- Table 9: Global APAC CGM Industry Revenue Million Forecast, by Country 2019 & 2032
- Table 10: Global APAC CGM Industry Volume K Unit Forecast, by Country 2019 & 2032
- Table 11: China APAC CGM Industry Revenue (Million) Forecast, by Application 2019 & 2032
- Table 12: China APAC CGM Industry Volume (K Unit) Forecast, by Application 2019 & 2032
- Table 13: Japan APAC CGM Industry Revenue (Million) Forecast, by Application 2019 & 2032
- Table 14: Japan APAC CGM Industry Volume (K Unit) Forecast, by Application 2019 & 2032
- Table 15: India APAC CGM Industry Revenue (Million) Forecast, by Application 2019 & 2032
- Table 16: India APAC CGM Industry Volume (K Unit) Forecast, by Application 2019 & 2032
- Table 17: South Korea APAC CGM Industry Revenue (Million) Forecast, by Application 2019 & 2032
- Table 18: South Korea APAC CGM Industry Volume (K Unit) Forecast, by Application 2019 & 2032
- Table 19: Taiwan APAC CGM Industry Revenue (Million) Forecast, by Application 2019 & 2032
- Table 20: Taiwan APAC CGM Industry Volume (K Unit) Forecast, by Application 2019 & 2032
- Table 21: Australia APAC CGM Industry Revenue (Million) Forecast, by Application 2019 & 2032
- Table 22: Australia APAC CGM Industry Volume (K Unit) Forecast, by Application 2019 & 2032
- Table 23: Rest of Asia-Pacific APAC CGM Industry Revenue (Million) Forecast, by Application 2019 & 2032
- Table 24: Rest of Asia-Pacific APAC CGM Industry Volume (K Unit) Forecast, by Application 2019 & 2032
- Table 25: Global APAC CGM Industry Revenue Million Forecast, by Component 2019 & 2032
- Table 26: Global APAC CGM Industry Volume K Unit Forecast, by Component 2019 & 2032
- Table 27: Global APAC CGM Industry Revenue Million Forecast, by Geography 2019 & 2032
- Table 28: Global APAC CGM Industry Volume K Unit Forecast, by Geography 2019 & 2032
- Table 29: Global APAC CGM Industry Revenue Million Forecast, by Country 2019 & 2032
- Table 30: Global APAC CGM Industry Volume K Unit Forecast, by Country 2019 & 2032
- Table 31: Global APAC CGM Industry Revenue Million Forecast, by Component 2019 & 2032
- Table 32: Global APAC CGM Industry Volume K Unit Forecast, by Component 2019 & 2032
- Table 33: Global APAC CGM Industry Revenue Million Forecast, by Geography 2019 & 2032
- Table 34: Global APAC CGM Industry Volume K Unit Forecast, by Geography 2019 & 2032
- Table 35: Global APAC CGM Industry Revenue Million Forecast, by Country 2019 & 2032
- Table 36: Global APAC CGM Industry Volume K Unit Forecast, by Country 2019 & 2032
- Table 37: Global APAC CGM Industry Revenue Million Forecast, by Component 2019 & 2032
- Table 38: Global APAC CGM Industry Volume K Unit Forecast, by Component 2019 & 2032
- Table 39: Global APAC CGM Industry Revenue Million Forecast, by Geography 2019 & 2032
- Table 40: Global APAC CGM Industry Volume K Unit Forecast, by Geography 2019 & 2032
- Table 41: Global APAC CGM Industry Revenue Million Forecast, by Country 2019 & 2032
- Table 42: Global APAC CGM Industry Volume K Unit Forecast, by Country 2019 & 2032
- Table 43: Global APAC CGM Industry Revenue Million Forecast, by Component 2019 & 2032
- Table 44: Global APAC CGM Industry Volume K Unit Forecast, by Component 2019 & 2032
- Table 45: Global APAC CGM Industry Revenue Million Forecast, by Geography 2019 & 2032
- Table 46: Global APAC CGM Industry Volume K Unit Forecast, by Geography 2019 & 2032
- Table 47: Global APAC CGM Industry Revenue Million Forecast, by Country 2019 & 2032
- Table 48: Global APAC CGM Industry Volume K Unit Forecast, by Country 2019 & 2032
- Table 49: Global APAC CGM Industry Revenue Million Forecast, by Component 2019 & 2032
- Table 50: Global APAC CGM Industry Volume K Unit Forecast, by Component 2019 & 2032
- Table 51: Global APAC CGM Industry Revenue Million Forecast, by Geography 2019 & 2032
- Table 52: Global APAC CGM Industry Volume K Unit Forecast, by Geography 2019 & 2032
- Table 53: Global APAC CGM Industry Revenue Million Forecast, by Country 2019 & 2032
- Table 54: Global APAC CGM Industry Volume K Unit Forecast, by Country 2019 & 2032
- Table 55: Global APAC CGM Industry Revenue Million Forecast, by Component 2019 & 2032
- Table 56: Global APAC CGM Industry Volume K Unit Forecast, by Component 2019 & 2032
- Table 57: Global APAC CGM Industry Revenue Million Forecast, by Geography 2019 & 2032
- Table 58: Global APAC CGM Industry Volume K Unit Forecast, by Geography 2019 & 2032
- Table 59: Global APAC CGM Industry Revenue Million Forecast, by Country 2019 & 2032
- Table 60: Global APAC CGM Industry Volume K Unit Forecast, by Country 2019 & 2032
- Table 61: Global APAC CGM Industry Revenue Million Forecast, by Component 2019 & 2032
- Table 62: Global APAC CGM Industry Volume K Unit Forecast, by Component 2019 & 2032
- Table 63: Global APAC CGM Industry Revenue Million Forecast, by Geography 2019 & 2032
- Table 64: Global APAC CGM Industry Volume K Unit Forecast, by Geography 2019 & 2032
- Table 65: Global APAC CGM Industry Revenue Million Forecast, by Country 2019 & 2032
- Table 66: Global APAC CGM Industry Volume K Unit Forecast, by Country 2019 & 2032
- Table 67: Global APAC CGM Industry Revenue Million Forecast, by Component 2019 & 2032
- Table 68: Global APAC CGM Industry Volume K Unit Forecast, by Component 2019 & 2032
- Table 69: Global APAC CGM Industry Revenue Million Forecast, by Geography 2019 & 2032
- Table 70: Global APAC CGM Industry Volume K Unit Forecast, by Geography 2019 & 2032
- Table 71: Global APAC CGM Industry Revenue Million Forecast, by Country 2019 & 2032
- Table 72: Global APAC CGM Industry Volume K Unit Forecast, by Country 2019 & 2032
- Table 73: Global APAC CGM Industry Revenue Million Forecast, by Component 2019 & 2032
- Table 74: Global APAC CGM Industry Volume K Unit Forecast, by Component 2019 & 2032
- Table 75: Global APAC CGM Industry Revenue Million Forecast, by Geography 2019 & 2032
- Table 76: Global APAC CGM Industry Volume K Unit Forecast, by Geography 2019 & 2032
- Table 77: Global APAC CGM Industry Revenue Million Forecast, by Country 2019 & 2032
- Table 78: Global APAC CGM Industry Volume K Unit Forecast, by Country 2019 & 2032
- Table 79: Global APAC CGM Industry Revenue Million Forecast, by Component 2019 & 2032
- Table 80: Global APAC CGM Industry Volume K Unit Forecast, by Component 2019 & 2032
- Table 81: Global APAC CGM Industry Revenue Million Forecast, by Geography 2019 & 2032
- Table 82: Global APAC CGM Industry Volume K Unit Forecast, by Geography 2019 & 2032
- Table 83: Global APAC CGM Industry Revenue Million Forecast, by Country 2019 & 2032
- Table 84: Global APAC CGM Industry Volume K Unit Forecast, by Country 2019 & 2032
- Table 85: Global APAC CGM Industry Revenue Million Forecast, by Component 2019 & 2032
- Table 86: Global APAC CGM Industry Volume K Unit Forecast, by Component 2019 & 2032
- Table 87: Global APAC CGM Industry Revenue Million Forecast, by Geography 2019 & 2032
- Table 88: Global APAC CGM Industry Volume K Unit Forecast, by Geography 2019 & 2032
- Table 89: Global APAC CGM Industry Revenue Million Forecast, by Country 2019 & 2032
- Table 90: Global APAC CGM Industry Volume K Unit Forecast, by Country 2019 & 2032
Frequently Asked Questions
1. What is the projected Compound Annual Growth Rate (CAGR) of the APAC CGM Industry?
The projected CAGR is approximately 11.74%.
2. Which companies are prominent players in the APAC CGM Industry?
Key companies in the market include Medtronics, Eversense, Abbott, Ascensia, Dexcom.
3. What are the main segments of the APAC CGM Industry?
The market segments include Component, Geography.
4. Can you provide details about the market size?
The market size is estimated to be USD XX Million as of 2022.
5. What are some drivers contributing to market growth?
Growing Burden of Gastrointestinal Diseases; Rising Preference of Point of Care Test.
6. What are the notable trends driving market growth?
The sensors Segment is having the highest market share in Asia-Pacific Continuous Glucose Monitoring Market..
7. Are there any restraints impacting market growth?
High Cost of Instruments.
8. Can you provide examples of recent developments in the market?
March 2022: Abbott announced that it received expanded reimbursement coverage in Japan for the FreeStyle Libre system. Japan's Ministry of Health, Labor, and Welfare approved the expansion of the continuous glucose monitoring (CGM) system to include all people with diabetes who use insulin at least once per day.
9. What pricing options are available for accessing the report?
Pricing options include single-user, multi-user, and enterprise licenses priced at USD 4750, USD 5250, and USD 8750 respectively.
10. Is the market size provided in terms of value or volume?
The market size is provided in terms of value, measured in Million and volume, measured in K Unit.
11. Are there any specific market keywords associated with the report?
Yes, the market keyword associated with the report is "APAC CGM Industry," which aids in identifying and referencing the specific market segment covered.
12. How do I determine which pricing option suits my needs best?
The pricing options vary based on user requirements and access needs. Individual users may opt for single-user licenses, while businesses requiring broader access may choose multi-user or enterprise licenses for cost-effective access to the report.
13. Are there any additional resources or data provided in the APAC CGM Industry report?
While the report offers comprehensive insights, it's advisable to review the specific contents or supplementary materials provided to ascertain if additional resources or data are available.
14. How can I stay updated on further developments or reports in the APAC CGM Industry?
To stay informed about further developments, trends, and reports in the APAC CGM Industry, consider subscribing to industry newsletters, following relevant companies and organizations, or regularly checking reputable industry news sources and publications.
Methodology
Step 1 - Identification of Relevant Samples Size from Population Database


Step 2 - Approaches for Defining Global Market Size (Value, Volume* & Price*)

Note*: In applicable scenarios
Step 3 - Data Sources
Primary Research
- Web Analytics
- Survey Reports
- Research Institute
- Latest Research Reports
- Opinion Leaders
Secondary Research
- Annual Reports
- White Paper
- Latest Press Release
- Industry Association
- Paid Database
- Investor Presentations

Step 4 - Data Triangulation
Involves using different sources of information in order to increase the validity of a study
These sources are likely to be stakeholders in a program - participants, other researchers, program staff, other community members, and so on.
Then we put all data in single framework & apply various statistical tools to find out the dynamic on the market.
During the analysis stage, feedback from the stakeholder groups would be compared to determine areas of agreement as well as areas of divergence
