

Key Insights
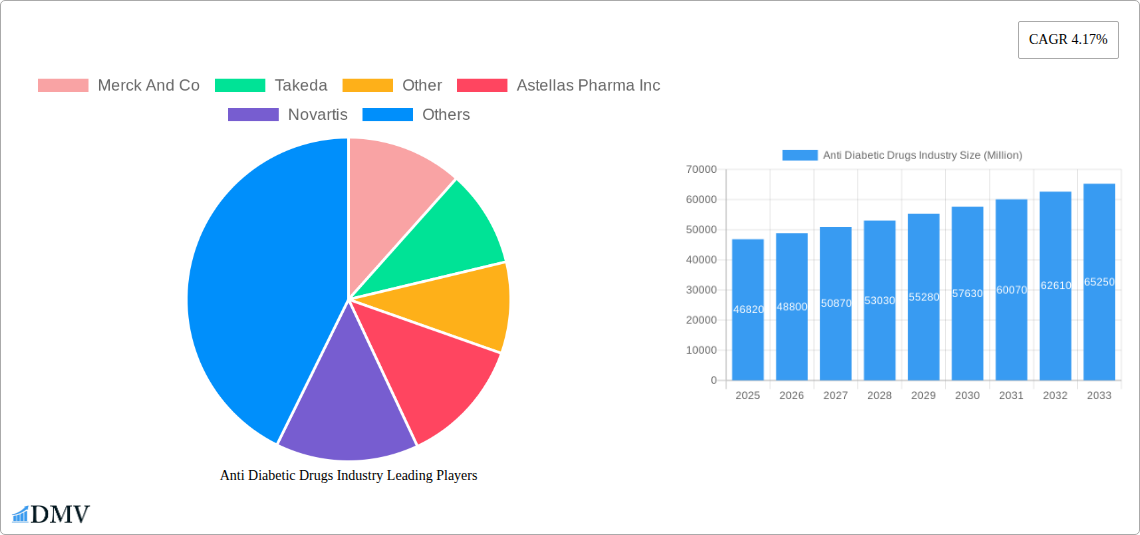
The global anti-diabetic drugs market, valued at $46.82 billion in 2025, is projected to experience robust growth, driven by the escalating prevalence of type 1 and type 2 diabetes worldwide. A compound annual growth rate (CAGR) of 4.17% from 2025 to 2033 indicates a substantial market expansion, reaching an estimated $65 billion by 2033. This growth is fueled by several key factors. The increasing geriatric population, a significant risk factor for diabetes, contributes significantly to market expansion. Furthermore, advancements in drug development, leading to the introduction of newer, more effective medications with improved safety profiles, such as SGLT-2 inhibitors and GLP-1 receptor agonists (while not explicitly mentioned, these are significant players in the market and their growth contributes to the overall CAGR), are driving market expansion. Increased awareness campaigns and improved diagnostic capabilities also contribute to earlier diagnosis and treatment, thereby boosting market demand. Geographical variations exist, with North America and Europe currently holding significant market share due to higher healthcare expenditure and advanced healthcare infrastructure. However, rapidly rising diabetes prevalence in Asia-Pacific, particularly in countries like India and China, presents a significant growth opportunity in the coming years.
Despite the positive outlook, certain market restraints exist. High treatment costs, particularly for novel therapies, can limit accessibility, especially in low- and middle-income countries. Furthermore, potential side effects associated with certain drug classes, as well as the need for lifestyle modifications alongside medication, can hinder market penetration. The market is segmented by drug class, with SGLT-2 inhibitors, DPP-4 inhibitors, and GLP-1 receptor agonists representing significant segments experiencing rapid growth due to their efficacy and improved safety profiles compared to older drug classes like sulfonylureas. Competition among major pharmaceutical companies such as Merck & Co., Takeda, Novartis, and Eli Lilly and Company will continue to shape market dynamics, influencing pricing strategies and innovation. Future growth will hinge on the development of more personalized medicine approaches tailored to individual patient needs and the potential emergence of novel therapeutic strategies.
This comprehensive report provides an in-depth analysis of the Anti-Diabetic Drugs industry, offering invaluable insights for stakeholders. With a study period spanning 2019-2033, a base and estimated year of 2025, and a forecast period of 2025-2033, this report meticulously examines historical data (2019-2024) to project future market trends. The global market size is projected to reach xx Million by 2033, presenting significant opportunities and challenges for key players.
Anti Diabetic Drugs Industry Market Composition & Trends
This section delves into the competitive landscape of the anti-diabetic drugs market, evaluating market concentration, innovation drivers, regulatory hurdles, substitute products, end-user profiles, and mergers & acquisitions (M&A) activity. We analyze market share distribution among major players such as Merck & Co, Takeda, Novartis, Johnson & Johnson (Janssen Pharmaceuticals), Eli Lilly and Company, AstraZeneca, Bristol Myers Squibb, Boehringer Ingelheim, Pfizer, Sanofi S.A., and Astellas Pharma Inc., along with the "Other" segment. The report examines the impact of recent M&A activities, quantifying deal values in Millions where available (e.g., xx Million for a specific deal), and identifying prevalent competitive strategies. The analysis also covers the influence of regulatory changes on market dynamics and assesses the threat of substitute products. The report details end-user profiles, encompassing hospitals, clinics, and pharmacies, as well as the evolving treatment paradigms impacting demand. Finally, the report identifies innovation catalysts, such as research & development efforts focusing on novel drug classes and improved delivery systems.
- Market Concentration: Highly concentrated with top 10 players controlling xx% of market share.
- Innovation Catalysts: Focus on developing oral insulin, GLP-1 analogs, and improved delivery systems.
- Regulatory Landscape: Stringent regulatory approvals driving high R&D expenditure.
- Substitute Products: Lifestyle changes and alternative therapies posing a moderate threat.
- M&A Activity: Analysis of recent deals with values totaling xx Million in the past five years.
Anti Diabetic Drugs Industry Industry Evolution
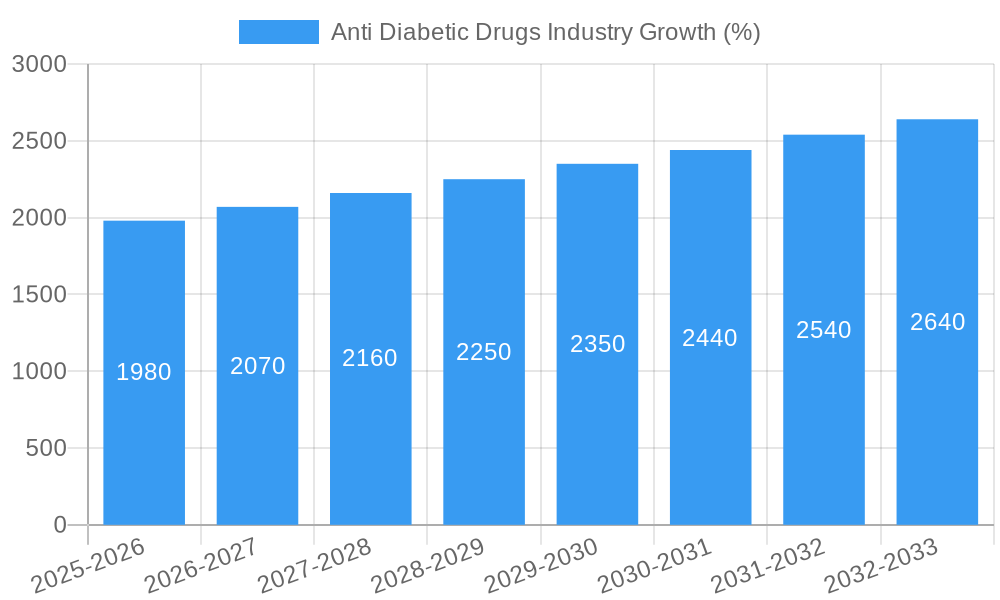
This section provides a detailed analysis of the evolution of the anti-diabetic drugs market from 2019 to 2033. We examine market growth trajectories, analyzing the Compound Annual Growth Rate (CAGR) during the historical period (2019-2024) at xx% and projecting the CAGR for the forecast period (2025-2033) at xx%. Technological advancements, particularly the development of novel drug classes like SGLT-2 inhibitors and GLP-1 receptor agonists, are analyzed in terms of their impact on market growth and adoption rates. The changing consumer demands, influenced by factors such as increased awareness of diabetes, a rise in prevalence, and preference for convenient therapies, are assessed for their role in shaping market dynamics. We discuss how these trends have influenced the market size, product innovation, and overall growth. We also incorporate data on the rising adoption of innovative delivery systems and explore the impact of payer policies and reimbursement scenarios.
Leading Regions, Countries, or Segments in Anti Diabetic Drugs Industry
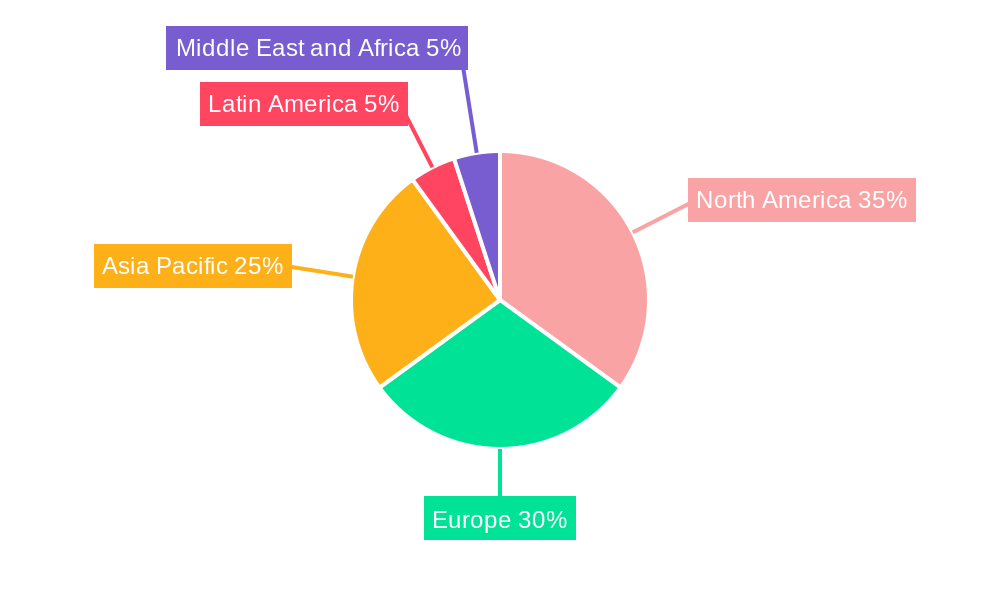
This section identifies the dominant regions, countries, and drug classes within the anti-diabetic drugs market. The report provides a comprehensive analysis of market share distribution across North America, Europe, Asia Pacific, Latin America, and the Middle East & Africa. It pinpoints the leading drug classes—Alpha-glucosidase inhibitors, Dopamine-D2 receptor agonists, SGLT-2 inhibitors, DPP-4 inhibitors, Sulfonylureas, Meglitinides, and Biguanides—examining their market penetration and growth drivers.
- North America: Dominant due to high diabetes prevalence and advanced healthcare infrastructure.
- Key Drivers: High healthcare expenditure, robust R&D investment, and favorable regulatory environment.
- Europe: Strong market growth driven by increasing diabetes diagnosis rates and aging population.
- Key Drivers: Government initiatives promoting diabetes management, and increasing access to advanced therapies.
- Asia Pacific: Rapidly expanding market fueled by rising diabetes prevalence and increasing healthcare awareness.
- Key Drivers: Growing middle class, increased affordability of medications, and expanding healthcare infrastructure.
- Leading Drug Classes: SGLT-2 inhibitors and DPP-4 inhibitors exhibiting the highest growth rates due to their efficacy and safety profiles.
- Detailed analysis of market share, growth drivers and challenges for each class are provided.
Anti Diabetic Drugs Industry Product Innovations
Recent product innovations have focused on improving efficacy, safety, and convenience of anti-diabetic therapies. This includes advancements in oral insulin formulations, like Oramed's ORMD-0801, and the development of novel GLP-1 receptor agonists with improved tolerability. Furthermore, combination therapies targeting multiple pathways have emerged to optimize glycemic control. These innovations address unmet medical needs and cater to the diverse requirements of the patient population, offering unique selling propositions such as improved patient adherence and minimized side effects. Performance metrics, such as HbA1c reduction rates and cardiovascular risk reduction, are analyzed to demonstrate the efficacy of these new products.
Propelling Factors for Anti Diabetic Drugs Industry Growth
Several factors are driving growth in the anti-diabetic drugs market. The rising prevalence of type 2 diabetes globally is a primary driver. Technological advancements, such as the development of novel drug classes with enhanced efficacy and safety profiles, are also significantly contributing to market expansion. Favorable regulatory environments in many regions are further facilitating the introduction of new drugs and therapies. Finally, increased awareness of diabetes and improved healthcare infrastructure are supporting the growth of this market.
Obstacles in the Anti Diabetic Drugs Industry Market
The anti-diabetic drugs market faces several challenges, including stringent regulatory approvals leading to prolonged drug development timelines and high costs. Supply chain disruptions and pricing pressures from generic medications can also affect profitability. Moreover, intense competition among established and emerging pharmaceutical companies poses a significant challenge. These factors are expected to have a quantifiable negative impact on market growth, though the exact figures are difficult to predict precisely.
Future Opportunities in Anti Diabetic Drugs Industry
The future of the anti-diabetic drugs market presents exciting opportunities. The emergence of novel drug classes, such as dual-incretin mimetics, is expanding therapeutic options. Furthermore, personalized medicine approaches that tailor treatment to individual patient characteristics hold great promise. Expansion into emerging markets with high diabetes prevalence presents significant growth potential. Finally, continued investment in research and development will drive innovation and improve patient outcomes.
Major Players in the Anti Diabetic Drugs Industry Ecosystem
- Merck And Co
- Takeda
- Other
- Astellas Pharma Inc
- Novartis
- Johnson & Johnson (Janssen Pharmaceuticals)
- Eli Lilly and Company
- AstraZeneca
- Bristol Myers Squibb
- Boehringer Ingelheim
- Pfizer
- Sanofi S A
Key Developments in Anti Diabetic Drugs Industry Industry
- July 2022: Glenmark Pharmaceuticals Limited launched sitagliptin and its Fixed Dose Combinations (FDCs) in India, offering affordable options for Type 2 diabetes treatment. This increased access to effective treatments in a large market.
- March 2022: Oramed announced promising Phase 3 trials for ORMD-0801, a potential first-ever oral insulin capsule, which could revolutionize insulin delivery and the anti-diabetic drugs market. The development of an oral GLP-1 analog capsule (ORMD-0901) further indicates significant innovation in the sector.
Strategic Anti Diabetic Drugs Industry Market Forecast
The anti-diabetic drugs market is poised for continued growth, driven by increasing diabetes prevalence, technological advancements leading to novel therapies, and expansion into emerging markets. The market's future trajectory will be shaped by further innovation in drug delivery systems, personalized medicine approaches, and the ongoing development of more effective and safer drugs. This will create significant opportunities for pharmaceutical companies that invest in research and development, actively participate in M&A activity, and strategically navigate the regulatory landscape.
Anti Diabetic Drugs Industry Segmentation
-
1. Drugs
-
1.1. Biguanides
- 1.1.1. Metformin
-
1.2. Alpha-glucosidase inhibitors
- 1.2.1. Alpha-glucosidase Inhibitors
-
1.3. Dopamine -D2 Receptor Agonist
- 1.3.1. Bromocriptin (Cycloset)
-
1.4. Sodium-glucose Cotransport -2 (SGLT-2) inhibitor
- 1.4.1. Invokana (Canagliflozin)
- 1.4.2. Jardiance (Empagliflozin)
- 1.4.3. Farxiga/Forxiga (Dapagliflozin)
- 1.4.4. Suglat (Ipragliflozin)
-
1.5. Dipeptidyl Peptidase - 4 (DPP-4) Inhibitors
- 1.5.1. Januvia (Sitagliptin)
- 1.5.2. Onglyza (Saxagliptin)
- 1.5.3. Tradjenta (Linagliptin)
- 1.5.4. Vipidia/Nesina (Alogliptin)
- 1.5.5. Galvus (Vildagliptin)
- 1.6. Sulfonylureas
- 1.7. Meglitinides
-
1.1. Biguanides
Anti Diabetic Drugs Industry Segmentation By Geography
-
1. North America
- 1.1. United States
- 1.2. Canada
- 1.3. Rest of North America
-
2. Europe
- 2.1. France
- 2.2. Germany
- 2.3. Italy
- 2.4. Spain
- 2.5. United Kingdom
- 2.6. Russia
- 2.7. Rest of Europe
-
3. Latin America
- 3.1. Mexico
- 3.2. Brazil
- 3.3. Rest of Latin America
-
4. Asia Pacific
- 4.1. Japan
- 4.2. South Korea
- 4.3. China
- 4.4. India
- 4.5. Australia
- 4.6. Vietnam
- 4.7. Malaysia
- 4.8. Indonesia
- 4.9. Philippines
- 4.10. Thailand
- 4.11. Rest of Asia Pacific
-
5. Middle East and Africa
- 5.1. Saudi Arabia
- 5.2. Iran
- 5.3. Egypt
- 5.4. Oman
- 5.5. South Africa
- 5.6. Rest of Middle East and Africa
Anti Diabetic Drugs Industry REPORT HIGHLIGHTS
| Aspects | Details |
|---|---|
| Study Period | 2019-2033 |
| Base Year | 2024 |
| Estimated Year | 2025 |
| Forecast Period | 2025-2033 |
| Historical Period | 2019-2024 |
| Growth Rate | CAGR of 4.17% from 2019-2033 |
| Segmentation |
|
Table of Contents
- 1. Introduction
- 1.1. Research Scope
- 1.2. Market Segmentation
- 1.3. Research Methodology
- 1.4. Definitions and Assumptions
- 2. Executive Summary
- 2.1. Introduction
- 3. Market Dynamics
- 3.1. Introduction
- 3.2. Market Drivers
- 3.2.1. Rising Prevalence of Chronic Diseases; Technological Advancements
- 3.3. Market Restrains
- 3.3.1. Risk of Needlestick Injuries
- 3.4. Market Trends
- 3.4.1. Biguanide Segment Occupies the Highest Market Share in the Oral Anti-Diabetic Drugs Market in the current year
- 4. Market Factor Analysis
- 4.1. Porters Five Forces
- 4.2. Supply/Value Chain
- 4.3. PESTEL analysis
- 4.4. Market Entropy
- 4.5. Patent/Trademark Analysis
- 5. Global Anti Diabetic Drugs Industry Analysis, Insights and Forecast, 2019-2031
- 5.1. Market Analysis, Insights and Forecast - by Drugs
- 5.1.1. Biguanides
- 5.1.1.1. Metformin
- 5.1.2. Alpha-glucosidase inhibitors
- 5.1.2.1. Alpha-glucosidase Inhibitors
- 5.1.3. Dopamine -D2 Receptor Agonist
- 5.1.3.1. Bromocriptin (Cycloset)
- 5.1.4. Sodium-glucose Cotransport -2 (SGLT-2) inhibitor
- 5.1.4.1. Invokana (Canagliflozin)
- 5.1.4.2. Jardiance (Empagliflozin)
- 5.1.4.3. Farxiga/Forxiga (Dapagliflozin)
- 5.1.4.4. Suglat (Ipragliflozin)
- 5.1.5. Dipeptidyl Peptidase - 4 (DPP-4) Inhibitors
- 5.1.5.1. Januvia (Sitagliptin)
- 5.1.5.2. Onglyza (Saxagliptin)
- 5.1.5.3. Tradjenta (Linagliptin)
- 5.1.5.4. Vipidia/Nesina (Alogliptin)
- 5.1.5.5. Galvus (Vildagliptin)
- 5.1.6. Sulfonylureas
- 5.1.7. Meglitinides
- 5.1.1. Biguanides
- 5.2. Market Analysis, Insights and Forecast - by Region
- 5.2.1. North America
- 5.2.2. Europe
- 5.2.3. Latin America
- 5.2.4. Asia Pacific
- 5.2.5. Middle East and Africa
- 5.1. Market Analysis, Insights and Forecast - by Drugs
- 6. North America Anti Diabetic Drugs Industry Analysis, Insights and Forecast, 2019-2031
- 6.1. Market Analysis, Insights and Forecast - by Drugs
- 6.1.1. Biguanides
- 6.1.1.1. Metformin
- 6.1.2. Alpha-glucosidase inhibitors
- 6.1.2.1. Alpha-glucosidase Inhibitors
- 6.1.3. Dopamine -D2 Receptor Agonist
- 6.1.3.1. Bromocriptin (Cycloset)
- 6.1.4. Sodium-glucose Cotransport -2 (SGLT-2) inhibitor
- 6.1.4.1. Invokana (Canagliflozin)
- 6.1.4.2. Jardiance (Empagliflozin)
- 6.1.4.3. Farxiga/Forxiga (Dapagliflozin)
- 6.1.4.4. Suglat (Ipragliflozin)
- 6.1.5. Dipeptidyl Peptidase - 4 (DPP-4) Inhibitors
- 6.1.5.1. Januvia (Sitagliptin)
- 6.1.5.2. Onglyza (Saxagliptin)
- 6.1.5.3. Tradjenta (Linagliptin)
- 6.1.5.4. Vipidia/Nesina (Alogliptin)
- 6.1.5.5. Galvus (Vildagliptin)
- 6.1.6. Sulfonylureas
- 6.1.7. Meglitinides
- 6.1.1. Biguanides
- 6.1. Market Analysis, Insights and Forecast - by Drugs
- 7. Europe Anti Diabetic Drugs Industry Analysis, Insights and Forecast, 2019-2031
- 7.1. Market Analysis, Insights and Forecast - by Drugs
- 7.1.1. Biguanides
- 7.1.1.1. Metformin
- 7.1.2. Alpha-glucosidase inhibitors
- 7.1.2.1. Alpha-glucosidase Inhibitors
- 7.1.3. Dopamine -D2 Receptor Agonist
- 7.1.3.1. Bromocriptin (Cycloset)
- 7.1.4. Sodium-glucose Cotransport -2 (SGLT-2) inhibitor
- 7.1.4.1. Invokana (Canagliflozin)
- 7.1.4.2. Jardiance (Empagliflozin)
- 7.1.4.3. Farxiga/Forxiga (Dapagliflozin)
- 7.1.4.4. Suglat (Ipragliflozin)
- 7.1.5. Dipeptidyl Peptidase - 4 (DPP-4) Inhibitors
- 7.1.5.1. Januvia (Sitagliptin)
- 7.1.5.2. Onglyza (Saxagliptin)
- 7.1.5.3. Tradjenta (Linagliptin)
- 7.1.5.4. Vipidia/Nesina (Alogliptin)
- 7.1.5.5. Galvus (Vildagliptin)
- 7.1.6. Sulfonylureas
- 7.1.7. Meglitinides
- 7.1.1. Biguanides
- 7.1. Market Analysis, Insights and Forecast - by Drugs
- 8. Latin America Anti Diabetic Drugs Industry Analysis, Insights and Forecast, 2019-2031
- 8.1. Market Analysis, Insights and Forecast - by Drugs
- 8.1.1. Biguanides
- 8.1.1.1. Metformin
- 8.1.2. Alpha-glucosidase inhibitors
- 8.1.2.1. Alpha-glucosidase Inhibitors
- 8.1.3. Dopamine -D2 Receptor Agonist
- 8.1.3.1. Bromocriptin (Cycloset)
- 8.1.4. Sodium-glucose Cotransport -2 (SGLT-2) inhibitor
- 8.1.4.1. Invokana (Canagliflozin)
- 8.1.4.2. Jardiance (Empagliflozin)
- 8.1.4.3. Farxiga/Forxiga (Dapagliflozin)
- 8.1.4.4. Suglat (Ipragliflozin)
- 8.1.5. Dipeptidyl Peptidase - 4 (DPP-4) Inhibitors
- 8.1.5.1. Januvia (Sitagliptin)
- 8.1.5.2. Onglyza (Saxagliptin)
- 8.1.5.3. Tradjenta (Linagliptin)
- 8.1.5.4. Vipidia/Nesina (Alogliptin)
- 8.1.5.5. Galvus (Vildagliptin)
- 8.1.6. Sulfonylureas
- 8.1.7. Meglitinides
- 8.1.1. Biguanides
- 8.1. Market Analysis, Insights and Forecast - by Drugs
- 9. Asia Pacific Anti Diabetic Drugs Industry Analysis, Insights and Forecast, 2019-2031
- 9.1. Market Analysis, Insights and Forecast - by Drugs
- 9.1.1. Biguanides
- 9.1.1.1. Metformin
- 9.1.2. Alpha-glucosidase inhibitors
- 9.1.2.1. Alpha-glucosidase Inhibitors
- 9.1.3. Dopamine -D2 Receptor Agonist
- 9.1.3.1. Bromocriptin (Cycloset)
- 9.1.4. Sodium-glucose Cotransport -2 (SGLT-2) inhibitor
- 9.1.4.1. Invokana (Canagliflozin)
- 9.1.4.2. Jardiance (Empagliflozin)
- 9.1.4.3. Farxiga/Forxiga (Dapagliflozin)
- 9.1.4.4. Suglat (Ipragliflozin)
- 9.1.5. Dipeptidyl Peptidase - 4 (DPP-4) Inhibitors
- 9.1.5.1. Januvia (Sitagliptin)
- 9.1.5.2. Onglyza (Saxagliptin)
- 9.1.5.3. Tradjenta (Linagliptin)
- 9.1.5.4. Vipidia/Nesina (Alogliptin)
- 9.1.5.5. Galvus (Vildagliptin)
- 9.1.6. Sulfonylureas
- 9.1.7. Meglitinides
- 9.1.1. Biguanides
- 9.1. Market Analysis, Insights and Forecast - by Drugs
- 10. Middle East and Africa Anti Diabetic Drugs Industry Analysis, Insights and Forecast, 2019-2031
- 10.1. Market Analysis, Insights and Forecast - by Drugs
- 10.1.1. Biguanides
- 10.1.1.1. Metformin
- 10.1.2. Alpha-glucosidase inhibitors
- 10.1.2.1. Alpha-glucosidase Inhibitors
- 10.1.3. Dopamine -D2 Receptor Agonist
- 10.1.3.1. Bromocriptin (Cycloset)
- 10.1.4. Sodium-glucose Cotransport -2 (SGLT-2) inhibitor
- 10.1.4.1. Invokana (Canagliflozin)
- 10.1.4.2. Jardiance (Empagliflozin)
- 10.1.4.3. Farxiga/Forxiga (Dapagliflozin)
- 10.1.4.4. Suglat (Ipragliflozin)
- 10.1.5. Dipeptidyl Peptidase - 4 (DPP-4) Inhibitors
- 10.1.5.1. Januvia (Sitagliptin)
- 10.1.5.2. Onglyza (Saxagliptin)
- 10.1.5.3. Tradjenta (Linagliptin)
- 10.1.5.4. Vipidia/Nesina (Alogliptin)
- 10.1.5.5. Galvus (Vildagliptin)
- 10.1.6. Sulfonylureas
- 10.1.7. Meglitinides
- 10.1.1. Biguanides
- 10.1. Market Analysis, Insights and Forecast - by Drugs
- 11. North America Anti Diabetic Drugs Industry Analysis, Insights and Forecast, 2019-2031
- 11.1. Market Analysis, Insights and Forecast - By Country/Sub-region
- 11.1.1 United States
- 11.1.2 Canada
- 11.1.3 Mexico
- 12. Europe Anti Diabetic Drugs Industry Analysis, Insights and Forecast, 2019-2031
- 12.1. Market Analysis, Insights and Forecast - By Country/Sub-region
- 12.1.1 Germany
- 12.1.2 United Kingdom
- 12.1.3 France
- 12.1.4 Spain
- 12.1.5 Italy
- 12.1.6 Spain
- 12.1.7 Belgium
- 12.1.8 Netherland
- 12.1.9 Nordics
- 12.1.10 Rest of Europe
- 13. Asia Pacific Anti Diabetic Drugs Industry Analysis, Insights and Forecast, 2019-2031
- 13.1. Market Analysis, Insights and Forecast - By Country/Sub-region
- 13.1.1 China
- 13.1.2 Japan
- 13.1.3 India
- 13.1.4 South Korea
- 13.1.5 Southeast Asia
- 13.1.6 Australia
- 13.1.7 Indonesia
- 13.1.8 Phillipes
- 13.1.9 Singapore
- 13.1.10 Thailandc
- 13.1.11 Rest of Asia Pacific
- 14. South America Anti Diabetic Drugs Industry Analysis, Insights and Forecast, 2019-2031
- 14.1. Market Analysis, Insights and Forecast - By Country/Sub-region
- 14.1.1 Brazil
- 14.1.2 Argentina
- 14.1.3 Peru
- 14.1.4 Chile
- 14.1.5 Colombia
- 14.1.6 Ecuador
- 14.1.7 Venezuela
- 14.1.8 Rest of South America
- 15. MEA Anti Diabetic Drugs Industry Analysis, Insights and Forecast, 2019-2031
- 15.1. Market Analysis, Insights and Forecast - By Country/Sub-region
- 15.1.1 United Arab Emirates
- 15.1.2 Saudi Arabia
- 15.1.3 South Africa
- 15.1.4 Rest of Middle East and Africa
- 16. Competitive Analysis
- 16.1. Global Market Share Analysis 2024
- 16.2. Company Profiles
- 16.2.1 Merck And Co
- 16.2.1.1. Overview
- 16.2.1.2. Products
- 16.2.1.3. SWOT Analysis
- 16.2.1.4. Recent Developments
- 16.2.1.5. Financials (Based on Availability)
- 16.2.2 Takeda
- 16.2.2.1. Overview
- 16.2.2.2. Products
- 16.2.2.3. SWOT Analysis
- 16.2.2.4. Recent Developments
- 16.2.2.5. Financials (Based on Availability)
- 16.2.3 Other
- 16.2.3.1. Overview
- 16.2.3.2. Products
- 16.2.3.3. SWOT Analysis
- 16.2.3.4. Recent Developments
- 16.2.3.5. Financials (Based on Availability)
- 16.2.4 Astellas Pharma Inc
- 16.2.4.1. Overview
- 16.2.4.2. Products
- 16.2.4.3. SWOT Analysis
- 16.2.4.4. Recent Developments
- 16.2.4.5. Financials (Based on Availability)
- 16.2.5 Novartis
- 16.2.5.1. Overview
- 16.2.5.2. Products
- 16.2.5.3. SWOT Analysis
- 16.2.5.4. Recent Developments
- 16.2.5.5. Financials (Based on Availability)
- 16.2.6 Johnson & Johnson (Janssen Pharmaceuticals)
- 16.2.6.1. Overview
- 16.2.6.2. Products
- 16.2.6.3. SWOT Analysis
- 16.2.6.4. Recent Developments
- 16.2.6.5. Financials (Based on Availability)
- 16.2.7 Merck and Co
- 16.2.7.1. Overview
- 16.2.7.2. Products
- 16.2.7.3. SWOT Analysis
- 16.2.7.4. Recent Developments
- 16.2.7.5. Financials (Based on Availability)
- 16.2.8 Eli Lilly and Company
- 16.2.8.1. Overview
- 16.2.8.2. Products
- 16.2.8.3. SWOT Analysis
- 16.2.8.4. Recent Developments
- 16.2.8.5. Financials (Based on Availability)
- 16.2.9 AstraZeneca
- 16.2.9.1. Overview
- 16.2.9.2. Products
- 16.2.9.3. SWOT Analysis
- 16.2.9.4. Recent Developments
- 16.2.9.5. Financials (Based on Availability)
- 16.2.10 Bristol Myers Squibb
- 16.2.10.1. Overview
- 16.2.10.2. Products
- 16.2.10.3. SWOT Analysis
- 16.2.10.4. Recent Developments
- 16.2.10.5. Financials (Based on Availability)
- 16.2.11 Boehringer Ingelheim
- 16.2.11.1. Overview
- 16.2.11.2. Products
- 16.2.11.3. SWOT Analysis
- 16.2.11.4. Recent Developments
- 16.2.11.5. Financials (Based on Availability)
- 16.2.12 Pfizer
- 16.2.12.1. Overview
- 16.2.12.2. Products
- 16.2.12.3. SWOT Analysis
- 16.2.12.4. Recent Developments
- 16.2.12.5. Financials (Based on Availability)
- 16.2.13 Sanofi S A
- 16.2.13.1. Overview
- 16.2.13.2. Products
- 16.2.13.3. SWOT Analysis
- 16.2.13.4. Recent Developments
- 16.2.13.5. Financials (Based on Availability)
- 16.2.1 Merck And Co
List of Figures
- Figure 1: Global Anti Diabetic Drugs Industry Revenue Breakdown (Million, %) by Region 2024 & 2032
- Figure 2: North America Anti Diabetic Drugs Industry Revenue (Million), by Country 2024 & 2032
- Figure 3: North America Anti Diabetic Drugs Industry Revenue Share (%), by Country 2024 & 2032
- Figure 4: Europe Anti Diabetic Drugs Industry Revenue (Million), by Country 2024 & 2032
- Figure 5: Europe Anti Diabetic Drugs Industry Revenue Share (%), by Country 2024 & 2032
- Figure 6: Asia Pacific Anti Diabetic Drugs Industry Revenue (Million), by Country 2024 & 2032
- Figure 7: Asia Pacific Anti Diabetic Drugs Industry Revenue Share (%), by Country 2024 & 2032
- Figure 8: South America Anti Diabetic Drugs Industry Revenue (Million), by Country 2024 & 2032
- Figure 9: South America Anti Diabetic Drugs Industry Revenue Share (%), by Country 2024 & 2032
- Figure 10: MEA Anti Diabetic Drugs Industry Revenue (Million), by Country 2024 & 2032
- Figure 11: MEA Anti Diabetic Drugs Industry Revenue Share (%), by Country 2024 & 2032
- Figure 12: North America Anti Diabetic Drugs Industry Revenue (Million), by Drugs 2024 & 2032
- Figure 13: North America Anti Diabetic Drugs Industry Revenue Share (%), by Drugs 2024 & 2032
- Figure 14: North America Anti Diabetic Drugs Industry Revenue (Million), by Country 2024 & 2032
- Figure 15: North America Anti Diabetic Drugs Industry Revenue Share (%), by Country 2024 & 2032
- Figure 16: Europe Anti Diabetic Drugs Industry Revenue (Million), by Drugs 2024 & 2032
- Figure 17: Europe Anti Diabetic Drugs Industry Revenue Share (%), by Drugs 2024 & 2032
- Figure 18: Europe Anti Diabetic Drugs Industry Revenue (Million), by Country 2024 & 2032
- Figure 19: Europe Anti Diabetic Drugs Industry Revenue Share (%), by Country 2024 & 2032
- Figure 20: Latin America Anti Diabetic Drugs Industry Revenue (Million), by Drugs 2024 & 2032
- Figure 21: Latin America Anti Diabetic Drugs Industry Revenue Share (%), by Drugs 2024 & 2032
- Figure 22: Latin America Anti Diabetic Drugs Industry Revenue (Million), by Country 2024 & 2032
- Figure 23: Latin America Anti Diabetic Drugs Industry Revenue Share (%), by Country 2024 & 2032
- Figure 24: Asia Pacific Anti Diabetic Drugs Industry Revenue (Million), by Drugs 2024 & 2032
- Figure 25: Asia Pacific Anti Diabetic Drugs Industry Revenue Share (%), by Drugs 2024 & 2032
- Figure 26: Asia Pacific Anti Diabetic Drugs Industry Revenue (Million), by Country 2024 & 2032
- Figure 27: Asia Pacific Anti Diabetic Drugs Industry Revenue Share (%), by Country 2024 & 2032
- Figure 28: Middle East and Africa Anti Diabetic Drugs Industry Revenue (Million), by Drugs 2024 & 2032
- Figure 29: Middle East and Africa Anti Diabetic Drugs Industry Revenue Share (%), by Drugs 2024 & 2032
- Figure 30: Middle East and Africa Anti Diabetic Drugs Industry Revenue (Million), by Country 2024 & 2032
- Figure 31: Middle East and Africa Anti Diabetic Drugs Industry Revenue Share (%), by Country 2024 & 2032
List of Tables
- Table 1: Global Anti Diabetic Drugs Industry Revenue Million Forecast, by Region 2019 & 2032
- Table 2: Global Anti Diabetic Drugs Industry Revenue Million Forecast, by Drugs 2019 & 2032
- Table 3: Global Anti Diabetic Drugs Industry Revenue Million Forecast, by Region 2019 & 2032
- Table 4: Global Anti Diabetic Drugs Industry Revenue Million Forecast, by Country 2019 & 2032
- Table 5: United States Anti Diabetic Drugs Industry Revenue (Million) Forecast, by Application 2019 & 2032
- Table 6: Canada Anti Diabetic Drugs Industry Revenue (Million) Forecast, by Application 2019 & 2032
- Table 7: Mexico Anti Diabetic Drugs Industry Revenue (Million) Forecast, by Application 2019 & 2032
- Table 8: Global Anti Diabetic Drugs Industry Revenue Million Forecast, by Country 2019 & 2032
- Table 9: Germany Anti Diabetic Drugs Industry Revenue (Million) Forecast, by Application 2019 & 2032
- Table 10: United Kingdom Anti Diabetic Drugs Industry Revenue (Million) Forecast, by Application 2019 & 2032
- Table 11: France Anti Diabetic Drugs Industry Revenue (Million) Forecast, by Application 2019 & 2032
- Table 12: Spain Anti Diabetic Drugs Industry Revenue (Million) Forecast, by Application 2019 & 2032
- Table 13: Italy Anti Diabetic Drugs Industry Revenue (Million) Forecast, by Application 2019 & 2032
- Table 14: Spain Anti Diabetic Drugs Industry Revenue (Million) Forecast, by Application 2019 & 2032
- Table 15: Belgium Anti Diabetic Drugs Industry Revenue (Million) Forecast, by Application 2019 & 2032
- Table 16: Netherland Anti Diabetic Drugs Industry Revenue (Million) Forecast, by Application 2019 & 2032
- Table 17: Nordics Anti Diabetic Drugs Industry Revenue (Million) Forecast, by Application 2019 & 2032
- Table 18: Rest of Europe Anti Diabetic Drugs Industry Revenue (Million) Forecast, by Application 2019 & 2032
- Table 19: Global Anti Diabetic Drugs Industry Revenue Million Forecast, by Country 2019 & 2032
- Table 20: China Anti Diabetic Drugs Industry Revenue (Million) Forecast, by Application 2019 & 2032
- Table 21: Japan Anti Diabetic Drugs Industry Revenue (Million) Forecast, by Application 2019 & 2032
- Table 22: India Anti Diabetic Drugs Industry Revenue (Million) Forecast, by Application 2019 & 2032
- Table 23: South Korea Anti Diabetic Drugs Industry Revenue (Million) Forecast, by Application 2019 & 2032
- Table 24: Southeast Asia Anti Diabetic Drugs Industry Revenue (Million) Forecast, by Application 2019 & 2032
- Table 25: Australia Anti Diabetic Drugs Industry Revenue (Million) Forecast, by Application 2019 & 2032
- Table 26: Indonesia Anti Diabetic Drugs Industry Revenue (Million) Forecast, by Application 2019 & 2032
- Table 27: Phillipes Anti Diabetic Drugs Industry Revenue (Million) Forecast, by Application 2019 & 2032
- Table 28: Singapore Anti Diabetic Drugs Industry Revenue (Million) Forecast, by Application 2019 & 2032
- Table 29: Thailandc Anti Diabetic Drugs Industry Revenue (Million) Forecast, by Application 2019 & 2032
- Table 30: Rest of Asia Pacific Anti Diabetic Drugs Industry Revenue (Million) Forecast, by Application 2019 & 2032
- Table 31: Global Anti Diabetic Drugs Industry Revenue Million Forecast, by Country 2019 & 2032
- Table 32: Brazil Anti Diabetic Drugs Industry Revenue (Million) Forecast, by Application 2019 & 2032
- Table 33: Argentina Anti Diabetic Drugs Industry Revenue (Million) Forecast, by Application 2019 & 2032
- Table 34: Peru Anti Diabetic Drugs Industry Revenue (Million) Forecast, by Application 2019 & 2032
- Table 35: Chile Anti Diabetic Drugs Industry Revenue (Million) Forecast, by Application 2019 & 2032
- Table 36: Colombia Anti Diabetic Drugs Industry Revenue (Million) Forecast, by Application 2019 & 2032
- Table 37: Ecuador Anti Diabetic Drugs Industry Revenue (Million) Forecast, by Application 2019 & 2032
- Table 38: Venezuela Anti Diabetic Drugs Industry Revenue (Million) Forecast, by Application 2019 & 2032
- Table 39: Rest of South America Anti Diabetic Drugs Industry Revenue (Million) Forecast, by Application 2019 & 2032
- Table 40: Global Anti Diabetic Drugs Industry Revenue Million Forecast, by Country 2019 & 2032
- Table 41: United Arab Emirates Anti Diabetic Drugs Industry Revenue (Million) Forecast, by Application 2019 & 2032
- Table 42: Saudi Arabia Anti Diabetic Drugs Industry Revenue (Million) Forecast, by Application 2019 & 2032
- Table 43: South Africa Anti Diabetic Drugs Industry Revenue (Million) Forecast, by Application 2019 & 2032
- Table 44: Rest of Middle East and Africa Anti Diabetic Drugs Industry Revenue (Million) Forecast, by Application 2019 & 2032
- Table 45: Global Anti Diabetic Drugs Industry Revenue Million Forecast, by Drugs 2019 & 2032
- Table 46: Global Anti Diabetic Drugs Industry Revenue Million Forecast, by Country 2019 & 2032
- Table 47: United States Anti Diabetic Drugs Industry Revenue (Million) Forecast, by Application 2019 & 2032
- Table 48: Canada Anti Diabetic Drugs Industry Revenue (Million) Forecast, by Application 2019 & 2032
- Table 49: Rest of North America Anti Diabetic Drugs Industry Revenue (Million) Forecast, by Application 2019 & 2032
- Table 50: Global Anti Diabetic Drugs Industry Revenue Million Forecast, by Drugs 2019 & 2032
- Table 51: Global Anti Diabetic Drugs Industry Revenue Million Forecast, by Country 2019 & 2032
- Table 52: France Anti Diabetic Drugs Industry Revenue (Million) Forecast, by Application 2019 & 2032
- Table 53: Germany Anti Diabetic Drugs Industry Revenue (Million) Forecast, by Application 2019 & 2032
- Table 54: Italy Anti Diabetic Drugs Industry Revenue (Million) Forecast, by Application 2019 & 2032
- Table 55: Spain Anti Diabetic Drugs Industry Revenue (Million) Forecast, by Application 2019 & 2032
- Table 56: United Kingdom Anti Diabetic Drugs Industry Revenue (Million) Forecast, by Application 2019 & 2032
- Table 57: Russia Anti Diabetic Drugs Industry Revenue (Million) Forecast, by Application 2019 & 2032
- Table 58: Rest of Europe Anti Diabetic Drugs Industry Revenue (Million) Forecast, by Application 2019 & 2032
- Table 59: Global Anti Diabetic Drugs Industry Revenue Million Forecast, by Drugs 2019 & 2032
- Table 60: Global Anti Diabetic Drugs Industry Revenue Million Forecast, by Country 2019 & 2032
- Table 61: Mexico Anti Diabetic Drugs Industry Revenue (Million) Forecast, by Application 2019 & 2032
- Table 62: Brazil Anti Diabetic Drugs Industry Revenue (Million) Forecast, by Application 2019 & 2032
- Table 63: Rest of Latin America Anti Diabetic Drugs Industry Revenue (Million) Forecast, by Application 2019 & 2032
- Table 64: Global Anti Diabetic Drugs Industry Revenue Million Forecast, by Drugs 2019 & 2032
- Table 65: Global Anti Diabetic Drugs Industry Revenue Million Forecast, by Country 2019 & 2032
- Table 66: Japan Anti Diabetic Drugs Industry Revenue (Million) Forecast, by Application 2019 & 2032
- Table 67: South Korea Anti Diabetic Drugs Industry Revenue (Million) Forecast, by Application 2019 & 2032
- Table 68: China Anti Diabetic Drugs Industry Revenue (Million) Forecast, by Application 2019 & 2032
- Table 69: India Anti Diabetic Drugs Industry Revenue (Million) Forecast, by Application 2019 & 2032
- Table 70: Australia Anti Diabetic Drugs Industry Revenue (Million) Forecast, by Application 2019 & 2032
- Table 71: Vietnam Anti Diabetic Drugs Industry Revenue (Million) Forecast, by Application 2019 & 2032
- Table 72: Malaysia Anti Diabetic Drugs Industry Revenue (Million) Forecast, by Application 2019 & 2032
- Table 73: Indonesia Anti Diabetic Drugs Industry Revenue (Million) Forecast, by Application 2019 & 2032
- Table 74: Philippines Anti Diabetic Drugs Industry Revenue (Million) Forecast, by Application 2019 & 2032
- Table 75: Thailand Anti Diabetic Drugs Industry Revenue (Million) Forecast, by Application 2019 & 2032
- Table 76: Rest of Asia Pacific Anti Diabetic Drugs Industry Revenue (Million) Forecast, by Application 2019 & 2032
- Table 77: Global Anti Diabetic Drugs Industry Revenue Million Forecast, by Drugs 2019 & 2032
- Table 78: Global Anti Diabetic Drugs Industry Revenue Million Forecast, by Country 2019 & 2032
- Table 79: Saudi Arabia Anti Diabetic Drugs Industry Revenue (Million) Forecast, by Application 2019 & 2032
- Table 80: Iran Anti Diabetic Drugs Industry Revenue (Million) Forecast, by Application 2019 & 2032
- Table 81: Egypt Anti Diabetic Drugs Industry Revenue (Million) Forecast, by Application 2019 & 2032
- Table 82: Oman Anti Diabetic Drugs Industry Revenue (Million) Forecast, by Application 2019 & 2032
- Table 83: South Africa Anti Diabetic Drugs Industry Revenue (Million) Forecast, by Application 2019 & 2032
- Table 84: Rest of Middle East and Africa Anti Diabetic Drugs Industry Revenue (Million) Forecast, by Application 2019 & 2032
Frequently Asked Questions
1. What is the projected Compound Annual Growth Rate (CAGR) of the Anti Diabetic Drugs Industry?
The projected CAGR is approximately 4.17%.
2. Which companies are prominent players in the Anti Diabetic Drugs Industry?
Key companies in the market include Merck And Co, Takeda, Other, Astellas Pharma Inc, Novartis, Johnson & Johnson (Janssen Pharmaceuticals), Merck and Co, Eli Lilly and Company, AstraZeneca, Bristol Myers Squibb, Boehringer Ingelheim, Pfizer, Sanofi S A.
3. What are the main segments of the Anti Diabetic Drugs Industry?
The market segments include Drugs.
4. Can you provide details about the market size?
The market size is estimated to be USD 46.82 Million as of 2022.
5. What are some drivers contributing to market growth?
Rising Prevalence of Chronic Diseases; Technological Advancements.
6. What are the notable trends driving market growth?
Biguanide Segment Occupies the Highest Market Share in the Oral Anti-Diabetic Drugs Market in the current year.
7. Are there any restraints impacting market growth?
Risk of Needlestick Injuries.
8. Can you provide examples of recent developments in the market?
July 2022: Glenmark Pharmaceuticals Limited announced that it had launched sitagliptin and its Fixed Dose Combinations (FDCs) for adults with Type 2 diabetes in India. Glenmark introduced 8 different combinations of sitagliptin-based drugs under the brand name SITAZIT and its variants at an affordable price.
9. What pricing options are available for accessing the report?
Pricing options include single-user, multi-user, and enterprise licenses priced at USD 4750, USD 5250, and USD 8750 respectively.
10. Is the market size provided in terms of value or volume?
The market size is provided in terms of value, measured in Million.
11. Are there any specific market keywords associated with the report?
Yes, the market keyword associated with the report is "Anti Diabetic Drugs Industry," which aids in identifying and referencing the specific market segment covered.
12. How do I determine which pricing option suits my needs best?
The pricing options vary based on user requirements and access needs. Individual users may opt for single-user licenses, while businesses requiring broader access may choose multi-user or enterprise licenses for cost-effective access to the report.
13. Are there any additional resources or data provided in the Anti Diabetic Drugs Industry report?
While the report offers comprehensive insights, it's advisable to review the specific contents or supplementary materials provided to ascertain if additional resources or data are available.
14. How can I stay updated on further developments or reports in the Anti Diabetic Drugs Industry?
To stay informed about further developments, trends, and reports in the Anti Diabetic Drugs Industry, consider subscribing to industry newsletters, following relevant companies and organizations, or regularly checking reputable industry news sources and publications.
Methodology
Step 1 - Identification of Relevant Samples Size from Population Database


Step 2 - Approaches for Defining Global Market Size (Value, Volume* & Price*)

Note*: In applicable scenarios
Step 3 - Data Sources
Primary Research
- Web Analytics
- Survey Reports
- Research Institute
- Latest Research Reports
- Opinion Leaders
Secondary Research
- Annual Reports
- White Paper
- Latest Press Release
- Industry Association
- Paid Database
- Investor Presentations

Step 4 - Data Triangulation
Involves using different sources of information in order to increase the validity of a study
These sources are likely to be stakeholders in a program - participants, other researchers, program staff, other community members, and so on.
Then we put all data in single framework & apply various statistical tools to find out the dynamic on the market.
During the analysis stage, feedback from the stakeholder groups would be compared to determine areas of agreement as well as areas of divergence
