

Key Insights
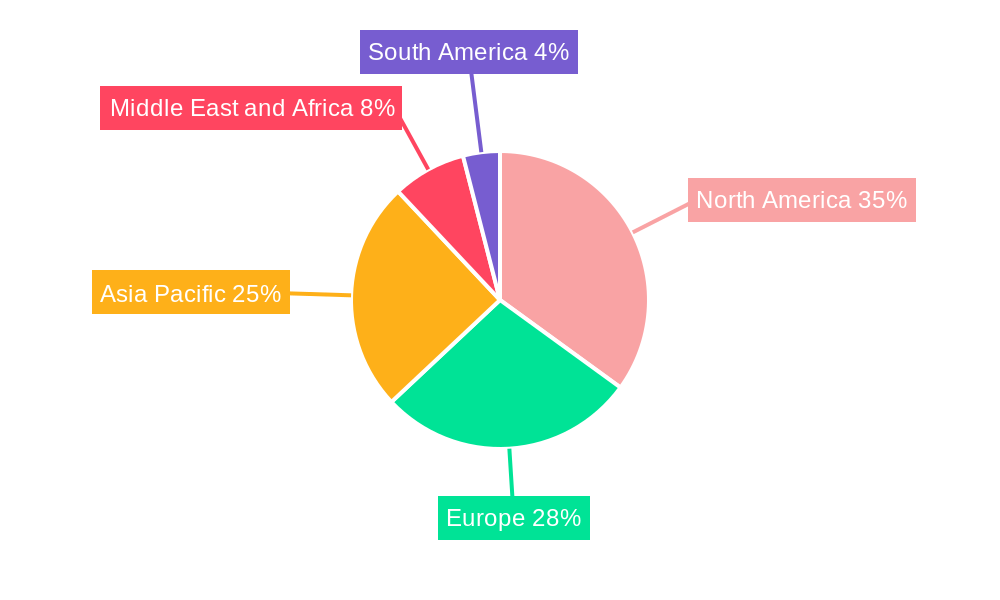
The global anemia treatment market is a significant and rapidly expanding sector, projected to reach a substantial value by 2033. Driven by the increasing prevalence of chronic diseases like chronic kidney disease (CKD) and a growing aging population susceptible to iron deficiency anemia, the market is experiencing robust growth. Technological advancements in treatment methodologies, including the development of novel biopharmaceuticals and targeted therapies, further fuel this expansion. While the market is segmented by disease type (Iron Deficiency Anemia, CKD Anemia, Sickle Cell Anemia, Aplastic Anemia, and Other Diseases), the prevalence of CKD and its associated anemia presents a particularly lucrative segment due to the large and steadily increasing patient population. This segment is likely to witness higher growth rates compared to others, attracting significant investment and R&D efforts from leading pharmaceutical companies. Regional variations exist, with North America and Europe currently holding the largest market share due to established healthcare infrastructure and high per capita healthcare spending. However, the Asia-Pacific region is poised for substantial growth in the coming years due to its large population base and improving healthcare access. Competition is fierce, with major pharmaceutical players like Sanofi, GSK, and AbbVie vying for market dominance, driving innovation and price competition.
Challenges to market growth include the high cost of some innovative therapies, limiting accessibility, particularly in developing regions. Furthermore, the development of new treatment options for rare anemias like aplastic anemia is hampered by the limited patient population and the complexities involved in clinical trials. Regulatory hurdles and the inherent complexities of clinical trials for new therapies also contribute to restraints in market expansion. Nevertheless, the overall market trajectory remains positive, indicating a promising future for companies involved in the research, development, and commercialization of anemia treatments. The continued focus on improving diagnosis techniques and developing more effective and affordable therapies will play a crucial role in shaping the market's future growth trajectory.
Anemia Treatment Industry: A Comprehensive Market Report (2019-2033)
This insightful report provides a detailed analysis of the Anemia Treatment Industry, encompassing market size, segmentation, competitive landscape, and future growth projections from 2019 to 2033. The study period covers 2019-2033, with 2025 as the base and estimated year. The forecast period spans 2025-2033, and the historical period covers 2019-2024. The global market is projected to reach xx Million by 2033, exhibiting a robust Compound Annual Growth Rate (CAGR) of xx%. This report is an essential resource for stakeholders seeking to understand the dynamics and future potential of this crucial healthcare market.
Anemia Treatment Industry Market Composition & Trends
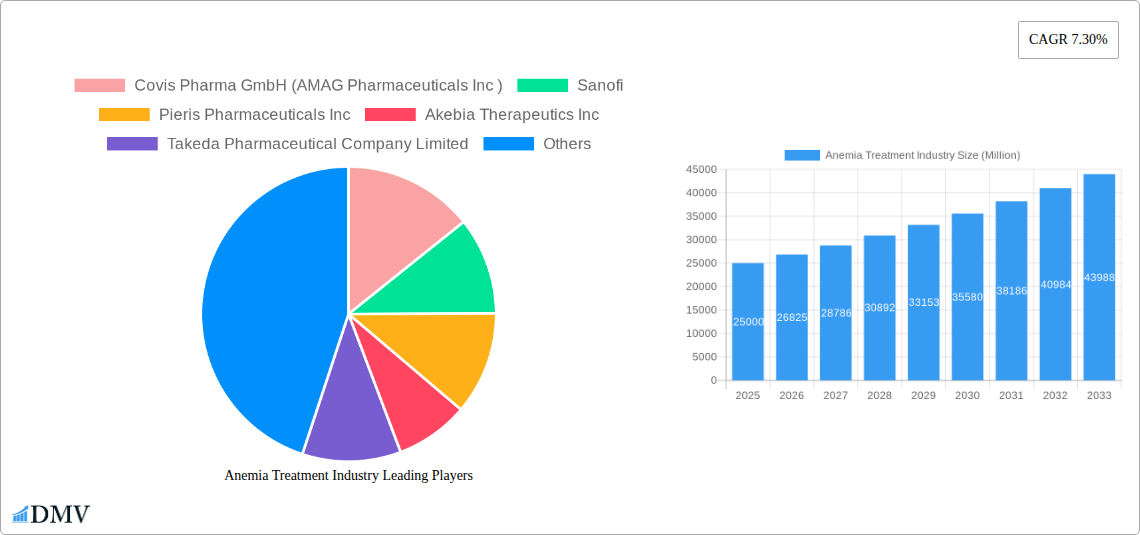
The anemia treatment market is characterized by a moderately concentrated landscape, with key players like Sanofi, Takeda Pharmaceutical Company Limited, and GSK plc holding significant market share. However, the emergence of innovative biotech companies and ongoing M&A activity is reshaping the competitive dynamics. Market share distribution varies significantly across different anemia types, with Iron Deficiency Anemia commanding the largest segment. Innovation is driven by the need for more effective and convenient treatments, particularly for chronic conditions like CKD anemia. Regulatory approvals, particularly in major markets like the US and EU, heavily influence market access and product lifecycles. Substitute products, such as nutritional supplements and lifestyle changes, are limited in their efficacy for severe anemia cases. The end-user profile encompasses hospitals, clinics, and specialized treatment centers. M&A activities, with deal values exceeding xx Million in recent years, suggest ongoing industry consolidation and strategic expansion.
- Market Concentration: Moderately concentrated, with top 5 players holding approximately xx% market share.
- Innovation Catalysts: Demand for more effective treatments for chronic anemia, particularly CKD and Sickle Cell Anemia.
- Regulatory Landscape: Stringent regulatory pathways influence drug approvals and market access.
- Substitute Products: Limited alternatives to pharmaceutical interventions for severe anemia.
- End-User Profile: Hospitals, clinics, specialized treatment centers.
- M&A Activity: Significant M&A activity, with total deal values exceeding xx Million in the past five years.
Anemia Treatment Industry Evolution
The anemia treatment market has witnessed substantial growth driven by increasing prevalence of chronic diseases, technological advancements, and growing awareness among patients and healthcare providers. The historical period (2019-2024) showed a CAGR of xx%, primarily fueled by increased diagnosis rates and the introduction of novel therapies. Technological advancements, such as the development of biosimilars and targeted therapies, have improved treatment efficacy and reduced side effects. Shifting consumer demands towards personalized medicine and convenient treatment options are also influencing market dynamics. The market is projected to maintain a strong growth trajectory in the forecast period (2025-2033), driven by factors like expanding elderly population, rising healthcare expenditure, and continued investment in research and development. The adoption of novel therapies, such as erythropoiesis-stimulating agents (ESAs) and iron chelators, is expected to increase significantly during this period. The market's future growth is dependent on the ongoing development of innovative therapies and the expansion of access to treatment in emerging markets.
Leading Regions, Countries, or Segments in Anemia Treatment Industry
The Iron Deficiency Anemia segment dominates the market, representing approximately xx Million in 2025. North America and Europe currently hold the largest market shares due to higher prevalence rates, advanced healthcare infrastructure, and greater access to advanced therapies.
- Iron Deficiency Anemia: High prevalence, especially in developing regions, drives market growth. Investment in iron supplement formulations is a key driver.
- CKD (Chronic Kidney Disease) Anemia: Large and growing patient population due to rising prevalence of CKD. Strong regulatory support for new therapies accelerates growth.
- Sickle Cell Anemia: High unmet need for effective treatments fuels innovation and market expansion. Significant investment in gene therapy offers substantial growth opportunities.
- Aplastic Anemia: Smaller market segment, but with significant growth potential due to ongoing research in stem cell transplantation and immunomodulatory therapies.
- Other Diseases: This segment includes a variety of rare anemias, presenting a niche market with specific treatment needs.
Anemia Treatment Industry Product Innovations
Recent innovations include the development of novel ESAs with improved efficacy and safety profiles, as well as targeted therapies that address specific mechanisms underlying different types of anemia. Advances in biosimilars offer cost-effective alternatives to existing treatments. These advancements are characterized by enhanced patient outcomes, improved convenience, and reduced side effects. For example, the development of long-acting ESAs reduces the frequency of injections.
Propelling Factors for Anemia Treatment Industry Growth
Technological advancements, such as the development of new and improved treatment modalities, represent a major driver. The increasing prevalence of chronic diseases, particularly CKD and iron deficiency anemia, fuels market demand. Favorable regulatory policies that streamline drug approvals and reimbursement processes facilitate market expansion. The growing awareness and diagnosis of anemia are further accelerating market growth.
Obstacles in the Anemia Treatment Industry Market
High cost of treatment and limited insurance coverage create access barriers. Supply chain disruptions can impact the availability of essential medications. Intense competition among established and emerging players poses challenges. These factors contribute to a complex market with both significant opportunities and inherent limitations.
Future Opportunities in Anemia Treatment Industry
The development of personalized medicine approaches promises significant potential. Expansion into emerging markets with high unmet needs represents a considerable opportunity. Further research into novel therapies such as gene editing could revolutionize treatment options. These developments present exciting growth prospects in the coming years.
Major Players in the Anemia Treatment Industry Ecosystem
- Covis Pharma GmbH (AMAG Pharmaceuticals Inc)
- Sanofi
- Pieris Pharmaceuticals Inc
- Akebia Therapeutics Inc
- Takeda Pharmaceutical Company Limited
- Pharmacosmos A/S
- GSK plc
- Bluebird Bio Inc
- AbbVie Inc (Allergan Plc)
- Pfizer Inc (Global Blood Therapeutics Inc)
Key Developments in Anemia Treatment Industry Industry
- November 2022: Sanofi received EC approval for Enjaymo (sutimlimab) for hemolytic anemia in adult patients with cold agglutinin disease (CAD). This approval expands treatment options for a rare and severe anemia.
- November 2022: CSL Vifor and Fresenius Kabi received NMPA approval in China for Ferinject (ferric carboxymaltose) for intravenous iron therapy in adult patients where oral iron preparations are ineffective. This expansion into a large market provides significant growth potential.
Strategic Anemia Treatment Industry Market Forecast
The anemia treatment market is poised for sustained growth driven by technological innovations, increased prevalence of chronic diseases, and expanding access to healthcare. The market's future is bright, with significant opportunities emerging in personalized medicine, novel treatment modalities, and expansion into untapped global markets. Continued investment in R&D and strategic partnerships will further enhance market growth and improve patient outcomes.
Anemia Treatment Industry Segmentation
-
1. Type of Disease
- 1.1. Iron Deficiency Anemia
- 1.2. CKD (Chronic Kidney Disease) Anemia
- 1.3. Sickle Cell Anemia
- 1.4. Aplastic Anemia
- 1.5. Other Diseases
Anemia Treatment Industry Segmentation By Geography
-
1. North America
- 1.1. United States
- 1.2. Canada
- 1.3. Mexico
-
2. Europe
- 2.1. Germany
- 2.2. United Kingdom
- 2.3. France
- 2.4. Italy
- 2.5. Spain
- 2.6. Rest of Europe
-
3. Asia Pacific
- 3.1. China
- 3.2. Japan
- 3.3. India
- 3.4. Australia
- 3.5. South Korea
- 3.6. Rest of Asia Pacific
-
4. Middle East and Africa
- 4.1. GCC
- 4.2. South Africa
- 4.3. Rest of Middle East and Africa
-
5. South America
- 5.1. Brazil
- 5.2. Argentina
- 5.3. Rest of South America
Anemia Treatment Industry REPORT HIGHLIGHTS
| Aspects | Details |
|---|---|
| Study Period | 2019-2033 |
| Base Year | 2024 |
| Estimated Year | 2025 |
| Forecast Period | 2025-2033 |
| Historical Period | 2019-2024 |
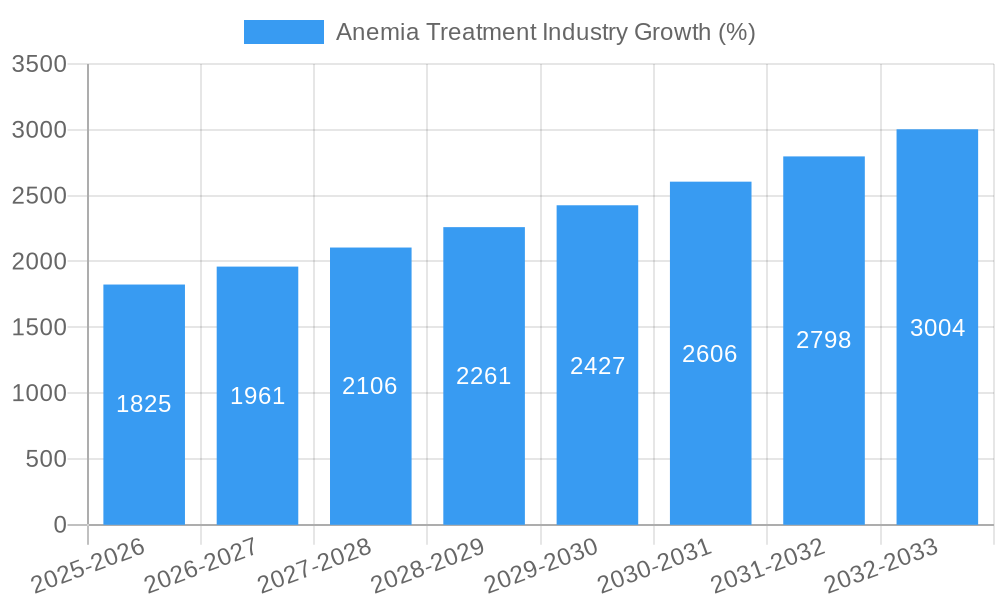
| Growth Rate | CAGR of 7.30% from 2019-2033 |
| Segmentation |
|
Table of Contents
- 1. Introduction
- 1.1. Research Scope
- 1.2. Market Segmentation
- 1.3. Research Methodology
- 1.4. Definitions and Assumptions
- 2. Executive Summary
- 2.1. Introduction
- 3. Market Dynamics
- 3.1. Introduction
- 3.2. Market Drivers
- 3.2.1. Increasing Cases of Anemia Across the Globe; Increasing Number of Women With Reproductive Age
- 3.3. Market Restrains
- 3.3.1. Lack of Awareness About the Treatment in Developing Regions; High Cost of Drugs
- 3.4. Market Trends
- 3.4.1. Iron Deficiency Anemia to Witness Healthy Growth Over the Forecast Period
- 4. Market Factor Analysis
- 4.1. Porters Five Forces
- 4.2. Supply/Value Chain
- 4.3. PESTEL analysis
- 4.4. Market Entropy
- 4.5. Patent/Trademark Analysis
- 5. Global Anemia Treatment Industry Analysis, Insights and Forecast, 2019-2031
- 5.1. Market Analysis, Insights and Forecast - by Type of Disease
- 5.1.1. Iron Deficiency Anemia
- 5.1.2. CKD (Chronic Kidney Disease) Anemia
- 5.1.3. Sickle Cell Anemia
- 5.1.4. Aplastic Anemia
- 5.1.5. Other Diseases
- 5.2. Market Analysis, Insights and Forecast - by Region
- 5.2.1. North America
- 5.2.2. Europe
- 5.2.3. Asia Pacific
- 5.2.4. Middle East and Africa
- 5.2.5. South America
- 5.1. Market Analysis, Insights and Forecast - by Type of Disease
- 6. North America Anemia Treatment Industry Analysis, Insights and Forecast, 2019-2031
- 6.1. Market Analysis, Insights and Forecast - by Type of Disease
- 6.1.1. Iron Deficiency Anemia
- 6.1.2. CKD (Chronic Kidney Disease) Anemia
- 6.1.3. Sickle Cell Anemia
- 6.1.4. Aplastic Anemia
- 6.1.5. Other Diseases
- 6.1. Market Analysis, Insights and Forecast - by Type of Disease
- 7. Europe Anemia Treatment Industry Analysis, Insights and Forecast, 2019-2031
- 7.1. Market Analysis, Insights and Forecast - by Type of Disease
- 7.1.1. Iron Deficiency Anemia
- 7.1.2. CKD (Chronic Kidney Disease) Anemia
- 7.1.3. Sickle Cell Anemia
- 7.1.4. Aplastic Anemia
- 7.1.5. Other Diseases
- 7.1. Market Analysis, Insights and Forecast - by Type of Disease
- 8. Asia Pacific Anemia Treatment Industry Analysis, Insights and Forecast, 2019-2031
- 8.1. Market Analysis, Insights and Forecast - by Type of Disease
- 8.1.1. Iron Deficiency Anemia
- 8.1.2. CKD (Chronic Kidney Disease) Anemia
- 8.1.3. Sickle Cell Anemia
- 8.1.4. Aplastic Anemia
- 8.1.5. Other Diseases
- 8.1. Market Analysis, Insights and Forecast - by Type of Disease
- 9. Middle East and Africa Anemia Treatment Industry Analysis, Insights and Forecast, 2019-2031
- 9.1. Market Analysis, Insights and Forecast - by Type of Disease
- 9.1.1. Iron Deficiency Anemia
- 9.1.2. CKD (Chronic Kidney Disease) Anemia
- 9.1.3. Sickle Cell Anemia
- 9.1.4. Aplastic Anemia
- 9.1.5. Other Diseases
- 9.1. Market Analysis, Insights and Forecast - by Type of Disease
- 10. South America Anemia Treatment Industry Analysis, Insights and Forecast, 2019-2031
- 10.1. Market Analysis, Insights and Forecast - by Type of Disease
- 10.1.1. Iron Deficiency Anemia
- 10.1.2. CKD (Chronic Kidney Disease) Anemia
- 10.1.3. Sickle Cell Anemia
- 10.1.4. Aplastic Anemia
- 10.1.5. Other Diseases
- 10.1. Market Analysis, Insights and Forecast - by Type of Disease
- 11. North America Anemia Treatment Industry Analysis, Insights and Forecast, 2019-2031
- 11.1. Market Analysis, Insights and Forecast - By Country/Sub-region
- 11.1.1. undefined
- 12. Europe Anemia Treatment Industry Analysis, Insights and Forecast, 2019-2031
- 12.1. Market Analysis, Insights and Forecast - By Country/Sub-region
- 12.1.1. undefined
- 13. Asia Pacific Anemia Treatment Industry Analysis, Insights and Forecast, 2019-2031
- 13.1. Market Analysis, Insights and Forecast - By Country/Sub-region
- 13.1.1. undefined
- 14. Middle East and Africa Anemia Treatment Industry Analysis, Insights and Forecast, 2019-2031
- 14.1. Market Analysis, Insights and Forecast - By Country/Sub-region
- 14.1.1. undefined
- 15. South America Anemia Treatment Industry Analysis, Insights and Forecast, 2019-2031
- 15.1. Market Analysis, Insights and Forecast - By Country/Sub-region
- 15.1.1. undefined
- 16. Competitive Analysis
- 16.1. Global Market Share Analysis 2024
- 16.2. Company Profiles
- 16.2.1 Covis Pharma GmbH (AMAG Pharmaceuticals Inc )
- 16.2.1.1. Overview
- 16.2.1.2. Products
- 16.2.1.3. SWOT Analysis
- 16.2.1.4. Recent Developments
- 16.2.1.5. Financials (Based on Availability)
- 16.2.2 Sanofi
- 16.2.2.1. Overview
- 16.2.2.2. Products
- 16.2.2.3. SWOT Analysis
- 16.2.2.4. Recent Developments
- 16.2.2.5. Financials (Based on Availability)
- 16.2.3 Pieris Pharmaceuticals Inc
- 16.2.3.1. Overview
- 16.2.3.2. Products
- 16.2.3.3. SWOT Analysis
- 16.2.3.4. Recent Developments
- 16.2.3.5. Financials (Based on Availability)
- 16.2.4 Akebia Therapeutics Inc
- 16.2.4.1. Overview
- 16.2.4.2. Products
- 16.2.4.3. SWOT Analysis
- 16.2.4.4. Recent Developments
- 16.2.4.5. Financials (Based on Availability)
- 16.2.5 Takeda Pharmaceutical Company Limited
- 16.2.5.1. Overview
- 16.2.5.2. Products
- 16.2.5.3. SWOT Analysis
- 16.2.5.4. Recent Developments
- 16.2.5.5. Financials (Based on Availability)
- 16.2.6 Pharmacosmos A/S
- 16.2.6.1. Overview
- 16.2.6.2. Products
- 16.2.6.3. SWOT Analysis
- 16.2.6.4. Recent Developments
- 16.2.6.5. Financials (Based on Availability)
- 16.2.7 GSK plc
- 16.2.7.1. Overview
- 16.2.7.2. Products
- 16.2.7.3. SWOT Analysis
- 16.2.7.4. Recent Developments
- 16.2.7.5. Financials (Based on Availability)
- 16.2.8 Bluebird Bio Inc
- 16.2.8.1. Overview
- 16.2.8.2. Products
- 16.2.8.3. SWOT Analysis
- 16.2.8.4. Recent Developments
- 16.2.8.5. Financials (Based on Availability)
- 16.2.9 AbbVie Inc (Allergan Plc)
- 16.2.9.1. Overview
- 16.2.9.2. Products
- 16.2.9.3. SWOT Analysis
- 16.2.9.4. Recent Developments
- 16.2.9.5. Financials (Based on Availability)
- 16.2.10 Pfizer Inc (Global Blood Therapeutics Inc )
- 16.2.10.1. Overview
- 16.2.10.2. Products
- 16.2.10.3. SWOT Analysis
- 16.2.10.4. Recent Developments
- 16.2.10.5. Financials (Based on Availability)
- 16.2.1 Covis Pharma GmbH (AMAG Pharmaceuticals Inc )
List of Figures
- Figure 1: Global Anemia Treatment Industry Revenue Breakdown (Million, %) by Region 2024 & 2032
- Figure 2: Global Anemia Treatment Industry Volume Breakdown (K Unit, %) by Region 2024 & 2032
- Figure 3: North America Anemia Treatment Industry Revenue (Million), by Country 2024 & 2032
- Figure 4: North America Anemia Treatment Industry Volume (K Unit), by Country 2024 & 2032
- Figure 5: North America Anemia Treatment Industry Revenue Share (%), by Country 2024 & 2032
- Figure 6: North America Anemia Treatment Industry Volume Share (%), by Country 2024 & 2032
- Figure 7: Europe Anemia Treatment Industry Revenue (Million), by Country 2024 & 2032
- Figure 8: Europe Anemia Treatment Industry Volume (K Unit), by Country 2024 & 2032
- Figure 9: Europe Anemia Treatment Industry Revenue Share (%), by Country 2024 & 2032
- Figure 10: Europe Anemia Treatment Industry Volume Share (%), by Country 2024 & 2032
- Figure 11: Asia Pacific Anemia Treatment Industry Revenue (Million), by Country 2024 & 2032
- Figure 12: Asia Pacific Anemia Treatment Industry Volume (K Unit), by Country 2024 & 2032
- Figure 13: Asia Pacific Anemia Treatment Industry Revenue Share (%), by Country 2024 & 2032
- Figure 14: Asia Pacific Anemia Treatment Industry Volume Share (%), by Country 2024 & 2032
- Figure 15: Middle East and Africa Anemia Treatment Industry Revenue (Million), by Country 2024 & 2032
- Figure 16: Middle East and Africa Anemia Treatment Industry Volume (K Unit), by Country 2024 & 2032
- Figure 17: Middle East and Africa Anemia Treatment Industry Revenue Share (%), by Country 2024 & 2032
- Figure 18: Middle East and Africa Anemia Treatment Industry Volume Share (%), by Country 2024 & 2032
- Figure 19: South America Anemia Treatment Industry Revenue (Million), by Country 2024 & 2032
- Figure 20: South America Anemia Treatment Industry Volume (K Unit), by Country 2024 & 2032
- Figure 21: South America Anemia Treatment Industry Revenue Share (%), by Country 2024 & 2032
- Figure 22: South America Anemia Treatment Industry Volume Share (%), by Country 2024 & 2032
- Figure 23: North America Anemia Treatment Industry Revenue (Million), by Type of Disease 2024 & 2032
- Figure 24: North America Anemia Treatment Industry Volume (K Unit), by Type of Disease 2024 & 2032
- Figure 25: North America Anemia Treatment Industry Revenue Share (%), by Type of Disease 2024 & 2032
- Figure 26: North America Anemia Treatment Industry Volume Share (%), by Type of Disease 2024 & 2032
- Figure 27: North America Anemia Treatment Industry Revenue (Million), by Country 2024 & 2032
- Figure 28: North America Anemia Treatment Industry Volume (K Unit), by Country 2024 & 2032
- Figure 29: North America Anemia Treatment Industry Revenue Share (%), by Country 2024 & 2032
- Figure 30: North America Anemia Treatment Industry Volume Share (%), by Country 2024 & 2032
- Figure 31: Europe Anemia Treatment Industry Revenue (Million), by Type of Disease 2024 & 2032
- Figure 32: Europe Anemia Treatment Industry Volume (K Unit), by Type of Disease 2024 & 2032
- Figure 33: Europe Anemia Treatment Industry Revenue Share (%), by Type of Disease 2024 & 2032
- Figure 34: Europe Anemia Treatment Industry Volume Share (%), by Type of Disease 2024 & 2032
- Figure 35: Europe Anemia Treatment Industry Revenue (Million), by Country 2024 & 2032
- Figure 36: Europe Anemia Treatment Industry Volume (K Unit), by Country 2024 & 2032
- Figure 37: Europe Anemia Treatment Industry Revenue Share (%), by Country 2024 & 2032
- Figure 38: Europe Anemia Treatment Industry Volume Share (%), by Country 2024 & 2032
- Figure 39: Asia Pacific Anemia Treatment Industry Revenue (Million), by Type of Disease 2024 & 2032
- Figure 40: Asia Pacific Anemia Treatment Industry Volume (K Unit), by Type of Disease 2024 & 2032
- Figure 41: Asia Pacific Anemia Treatment Industry Revenue Share (%), by Type of Disease 2024 & 2032
- Figure 42: Asia Pacific Anemia Treatment Industry Volume Share (%), by Type of Disease 2024 & 2032
- Figure 43: Asia Pacific Anemia Treatment Industry Revenue (Million), by Country 2024 & 2032
- Figure 44: Asia Pacific Anemia Treatment Industry Volume (K Unit), by Country 2024 & 2032
- Figure 45: Asia Pacific Anemia Treatment Industry Revenue Share (%), by Country 2024 & 2032
- Figure 46: Asia Pacific Anemia Treatment Industry Volume Share (%), by Country 2024 & 2032
- Figure 47: Middle East and Africa Anemia Treatment Industry Revenue (Million), by Type of Disease 2024 & 2032
- Figure 48: Middle East and Africa Anemia Treatment Industry Volume (K Unit), by Type of Disease 2024 & 2032
- Figure 49: Middle East and Africa Anemia Treatment Industry Revenue Share (%), by Type of Disease 2024 & 2032
- Figure 50: Middle East and Africa Anemia Treatment Industry Volume Share (%), by Type of Disease 2024 & 2032
- Figure 51: Middle East and Africa Anemia Treatment Industry Revenue (Million), by Country 2024 & 2032
- Figure 52: Middle East and Africa Anemia Treatment Industry Volume (K Unit), by Country 2024 & 2032
- Figure 53: Middle East and Africa Anemia Treatment Industry Revenue Share (%), by Country 2024 & 2032
- Figure 54: Middle East and Africa Anemia Treatment Industry Volume Share (%), by Country 2024 & 2032
- Figure 55: South America Anemia Treatment Industry Revenue (Million), by Type of Disease 2024 & 2032
- Figure 56: South America Anemia Treatment Industry Volume (K Unit), by Type of Disease 2024 & 2032
- Figure 57: South America Anemia Treatment Industry Revenue Share (%), by Type of Disease 2024 & 2032
- Figure 58: South America Anemia Treatment Industry Volume Share (%), by Type of Disease 2024 & 2032
- Figure 59: South America Anemia Treatment Industry Revenue (Million), by Country 2024 & 2032
- Figure 60: South America Anemia Treatment Industry Volume (K Unit), by Country 2024 & 2032
- Figure 61: South America Anemia Treatment Industry Revenue Share (%), by Country 2024 & 2032
- Figure 62: South America Anemia Treatment Industry Volume Share (%), by Country 2024 & 2032
List of Tables
- Table 1: Global Anemia Treatment Industry Revenue Million Forecast, by Region 2019 & 2032
- Table 2: Global Anemia Treatment Industry Volume K Unit Forecast, by Region 2019 & 2032
- Table 3: Global Anemia Treatment Industry Revenue Million Forecast, by Type of Disease 2019 & 2032
- Table 4: Global Anemia Treatment Industry Volume K Unit Forecast, by Type of Disease 2019 & 2032
- Table 5: Global Anemia Treatment Industry Revenue Million Forecast, by Region 2019 & 2032
- Table 6: Global Anemia Treatment Industry Volume K Unit Forecast, by Region 2019 & 2032
- Table 7: Global Anemia Treatment Industry Revenue Million Forecast, by Country 2019 & 2032
- Table 8: Global Anemia Treatment Industry Volume K Unit Forecast, by Country 2019 & 2032
- Table 9: Global Anemia Treatment Industry Revenue Million Forecast, by Country 2019 & 2032
- Table 10: Global Anemia Treatment Industry Volume K Unit Forecast, by Country 2019 & 2032
- Table 11: Global Anemia Treatment Industry Revenue Million Forecast, by Country 2019 & 2032
- Table 12: Global Anemia Treatment Industry Volume K Unit Forecast, by Country 2019 & 2032
- Table 13: Global Anemia Treatment Industry Revenue Million Forecast, by Country 2019 & 2032
- Table 14: Global Anemia Treatment Industry Volume K Unit Forecast, by Country 2019 & 2032
- Table 15: Global Anemia Treatment Industry Revenue Million Forecast, by Country 2019 & 2032
- Table 16: Global Anemia Treatment Industry Volume K Unit Forecast, by Country 2019 & 2032
- Table 17: Global Anemia Treatment Industry Revenue Million Forecast, by Type of Disease 2019 & 2032
- Table 18: Global Anemia Treatment Industry Volume K Unit Forecast, by Type of Disease 2019 & 2032
- Table 19: Global Anemia Treatment Industry Revenue Million Forecast, by Country 2019 & 2032
- Table 20: Global Anemia Treatment Industry Volume K Unit Forecast, by Country 2019 & 2032
- Table 21: United States Anemia Treatment Industry Revenue (Million) Forecast, by Application 2019 & 2032
- Table 22: United States Anemia Treatment Industry Volume (K Unit) Forecast, by Application 2019 & 2032
- Table 23: Canada Anemia Treatment Industry Revenue (Million) Forecast, by Application 2019 & 2032
- Table 24: Canada Anemia Treatment Industry Volume (K Unit) Forecast, by Application 2019 & 2032
- Table 25: Mexico Anemia Treatment Industry Revenue (Million) Forecast, by Application 2019 & 2032
- Table 26: Mexico Anemia Treatment Industry Volume (K Unit) Forecast, by Application 2019 & 2032
- Table 27: Global Anemia Treatment Industry Revenue Million Forecast, by Type of Disease 2019 & 2032
- Table 28: Global Anemia Treatment Industry Volume K Unit Forecast, by Type of Disease 2019 & 2032
- Table 29: Global Anemia Treatment Industry Revenue Million Forecast, by Country 2019 & 2032
- Table 30: Global Anemia Treatment Industry Volume K Unit Forecast, by Country 2019 & 2032
- Table 31: Germany Anemia Treatment Industry Revenue (Million) Forecast, by Application 2019 & 2032
- Table 32: Germany Anemia Treatment Industry Volume (K Unit) Forecast, by Application 2019 & 2032
- Table 33: United Kingdom Anemia Treatment Industry Revenue (Million) Forecast, by Application 2019 & 2032
- Table 34: United Kingdom Anemia Treatment Industry Volume (K Unit) Forecast, by Application 2019 & 2032
- Table 35: France Anemia Treatment Industry Revenue (Million) Forecast, by Application 2019 & 2032
- Table 36: France Anemia Treatment Industry Volume (K Unit) Forecast, by Application 2019 & 2032
- Table 37: Italy Anemia Treatment Industry Revenue (Million) Forecast, by Application 2019 & 2032
- Table 38: Italy Anemia Treatment Industry Volume (K Unit) Forecast, by Application 2019 & 2032
- Table 39: Spain Anemia Treatment Industry Revenue (Million) Forecast, by Application 2019 & 2032
- Table 40: Spain Anemia Treatment Industry Volume (K Unit) Forecast, by Application 2019 & 2032
- Table 41: Rest of Europe Anemia Treatment Industry Revenue (Million) Forecast, by Application 2019 & 2032
- Table 42: Rest of Europe Anemia Treatment Industry Volume (K Unit) Forecast, by Application 2019 & 2032
- Table 43: Global Anemia Treatment Industry Revenue Million Forecast, by Type of Disease 2019 & 2032
- Table 44: Global Anemia Treatment Industry Volume K Unit Forecast, by Type of Disease 2019 & 2032
- Table 45: Global Anemia Treatment Industry Revenue Million Forecast, by Country 2019 & 2032
- Table 46: Global Anemia Treatment Industry Volume K Unit Forecast, by Country 2019 & 2032
- Table 47: China Anemia Treatment Industry Revenue (Million) Forecast, by Application 2019 & 2032
- Table 48: China Anemia Treatment Industry Volume (K Unit) Forecast, by Application 2019 & 2032
- Table 49: Japan Anemia Treatment Industry Revenue (Million) Forecast, by Application 2019 & 2032
- Table 50: Japan Anemia Treatment Industry Volume (K Unit) Forecast, by Application 2019 & 2032
- Table 51: India Anemia Treatment Industry Revenue (Million) Forecast, by Application 2019 & 2032
- Table 52: India Anemia Treatment Industry Volume (K Unit) Forecast, by Application 2019 & 2032
- Table 53: Australia Anemia Treatment Industry Revenue (Million) Forecast, by Application 2019 & 2032
- Table 54: Australia Anemia Treatment Industry Volume (K Unit) Forecast, by Application 2019 & 2032
- Table 55: South Korea Anemia Treatment Industry Revenue (Million) Forecast, by Application 2019 & 2032
- Table 56: South Korea Anemia Treatment Industry Volume (K Unit) Forecast, by Application 2019 & 2032
- Table 57: Rest of Asia Pacific Anemia Treatment Industry Revenue (Million) Forecast, by Application 2019 & 2032
- Table 58: Rest of Asia Pacific Anemia Treatment Industry Volume (K Unit) Forecast, by Application 2019 & 2032
- Table 59: Global Anemia Treatment Industry Revenue Million Forecast, by Type of Disease 2019 & 2032
- Table 60: Global Anemia Treatment Industry Volume K Unit Forecast, by Type of Disease 2019 & 2032
- Table 61: Global Anemia Treatment Industry Revenue Million Forecast, by Country 2019 & 2032
- Table 62: Global Anemia Treatment Industry Volume K Unit Forecast, by Country 2019 & 2032
- Table 63: GCC Anemia Treatment Industry Revenue (Million) Forecast, by Application 2019 & 2032
- Table 64: GCC Anemia Treatment Industry Volume (K Unit) Forecast, by Application 2019 & 2032
- Table 65: South Africa Anemia Treatment Industry Revenue (Million) Forecast, by Application 2019 & 2032
- Table 66: South Africa Anemia Treatment Industry Volume (K Unit) Forecast, by Application 2019 & 2032
- Table 67: Rest of Middle East and Africa Anemia Treatment Industry Revenue (Million) Forecast, by Application 2019 & 2032
- Table 68: Rest of Middle East and Africa Anemia Treatment Industry Volume (K Unit) Forecast, by Application 2019 & 2032
- Table 69: Global Anemia Treatment Industry Revenue Million Forecast, by Type of Disease 2019 & 2032
- Table 70: Global Anemia Treatment Industry Volume K Unit Forecast, by Type of Disease 2019 & 2032
- Table 71: Global Anemia Treatment Industry Revenue Million Forecast, by Country 2019 & 2032
- Table 72: Global Anemia Treatment Industry Volume K Unit Forecast, by Country 2019 & 2032
- Table 73: Brazil Anemia Treatment Industry Revenue (Million) Forecast, by Application 2019 & 2032
- Table 74: Brazil Anemia Treatment Industry Volume (K Unit) Forecast, by Application 2019 & 2032
- Table 75: Argentina Anemia Treatment Industry Revenue (Million) Forecast, by Application 2019 & 2032
- Table 76: Argentina Anemia Treatment Industry Volume (K Unit) Forecast, by Application 2019 & 2032
- Table 77: Rest of South America Anemia Treatment Industry Revenue (Million) Forecast, by Application 2019 & 2032
- Table 78: Rest of South America Anemia Treatment Industry Volume (K Unit) Forecast, by Application 2019 & 2032
Frequently Asked Questions
1. What is the projected Compound Annual Growth Rate (CAGR) of the Anemia Treatment Industry?
The projected CAGR is approximately 7.30%.
2. Which companies are prominent players in the Anemia Treatment Industry?
Key companies in the market include Covis Pharma GmbH (AMAG Pharmaceuticals Inc ), Sanofi, Pieris Pharmaceuticals Inc, Akebia Therapeutics Inc, Takeda Pharmaceutical Company Limited, Pharmacosmos A/S, GSK plc, Bluebird Bio Inc, AbbVie Inc (Allergan Plc), Pfizer Inc (Global Blood Therapeutics Inc ).
3. What are the main segments of the Anemia Treatment Industry?
The market segments include Type of Disease.
4. Can you provide details about the market size?
The market size is estimated to be USD XX Million as of 2022.
5. What are some drivers contributing to market growth?
Increasing Cases of Anemia Across the Globe; Increasing Number of Women With Reproductive Age.
6. What are the notable trends driving market growth?
Iron Deficiency Anemia to Witness Healthy Growth Over the Forecast Period.
7. Are there any restraints impacting market growth?
Lack of Awareness About the Treatment in Developing Regions; High Cost of Drugs.
8. Can you provide examples of recent developments in the market?
November 2022: Sanofi received approval from the European Commission (EC) for Enjaymo (sutimlimab) for the treatment of hemolytic anemia in adult patients with cold agglutinin disease (CAD), a rare, serious, and chronic autoimmune hemolytic anemia, where the body's immune system mistakenly attacks healthy red blood cells and causes their rupture, known as hemolysis.
9. What pricing options are available for accessing the report?
Pricing options include single-user, multi-user, and enterprise licenses priced at USD 4750, USD 5250, and USD 8750 respectively.
10. Is the market size provided in terms of value or volume?
The market size is provided in terms of value, measured in Million and volume, measured in K Unit.
11. Are there any specific market keywords associated with the report?
Yes, the market keyword associated with the report is "Anemia Treatment Industry," which aids in identifying and referencing the specific market segment covered.
12. How do I determine which pricing option suits my needs best?
The pricing options vary based on user requirements and access needs. Individual users may opt for single-user licenses, while businesses requiring broader access may choose multi-user or enterprise licenses for cost-effective access to the report.
13. Are there any additional resources or data provided in the Anemia Treatment Industry report?
While the report offers comprehensive insights, it's advisable to review the specific contents or supplementary materials provided to ascertain if additional resources or data are available.
14. How can I stay updated on further developments or reports in the Anemia Treatment Industry?
To stay informed about further developments, trends, and reports in the Anemia Treatment Industry, consider subscribing to industry newsletters, following relevant companies and organizations, or regularly checking reputable industry news sources and publications.
Methodology
Step 1 - Identification of Relevant Samples Size from Population Database


Step 2 - Approaches for Defining Global Market Size (Value, Volume* & Price*)

Note*: In applicable scenarios
Step 3 - Data Sources
Primary Research
- Web Analytics
- Survey Reports
- Research Institute
- Latest Research Reports
- Opinion Leaders
Secondary Research
- Annual Reports
- White Paper
- Latest Press Release
- Industry Association
- Paid Database
- Investor Presentations

Step 4 - Data Triangulation
Involves using different sources of information in order to increase the validity of a study
These sources are likely to be stakeholders in a program - participants, other researchers, program staff, other community members, and so on.
Then we put all data in single framework & apply various statistical tools to find out the dynamic on the market.
During the analysis stage, feedback from the stakeholder groups would be compared to determine areas of agreement as well as areas of divergence
