

Key Insights
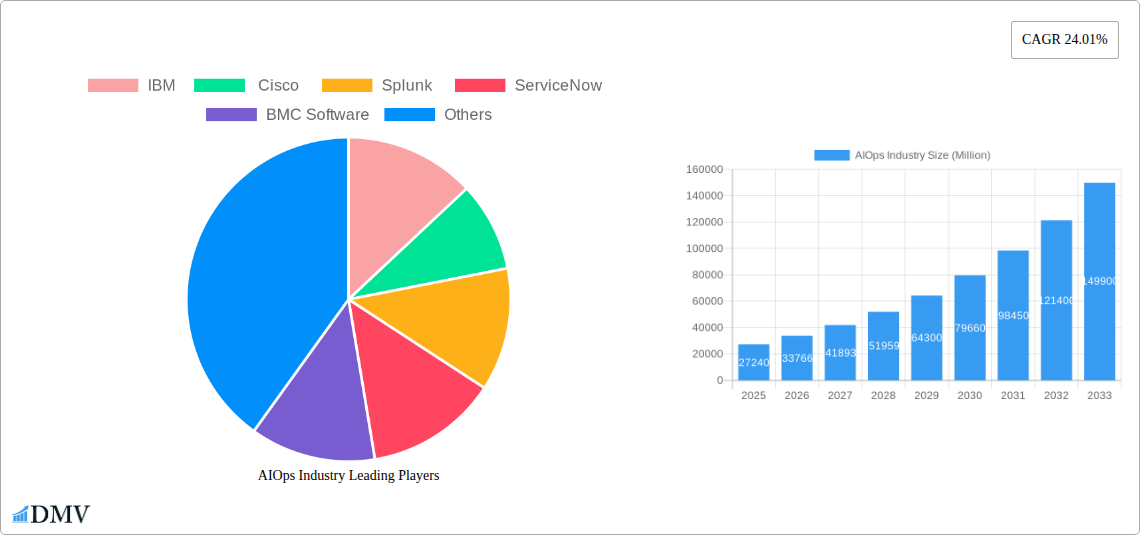
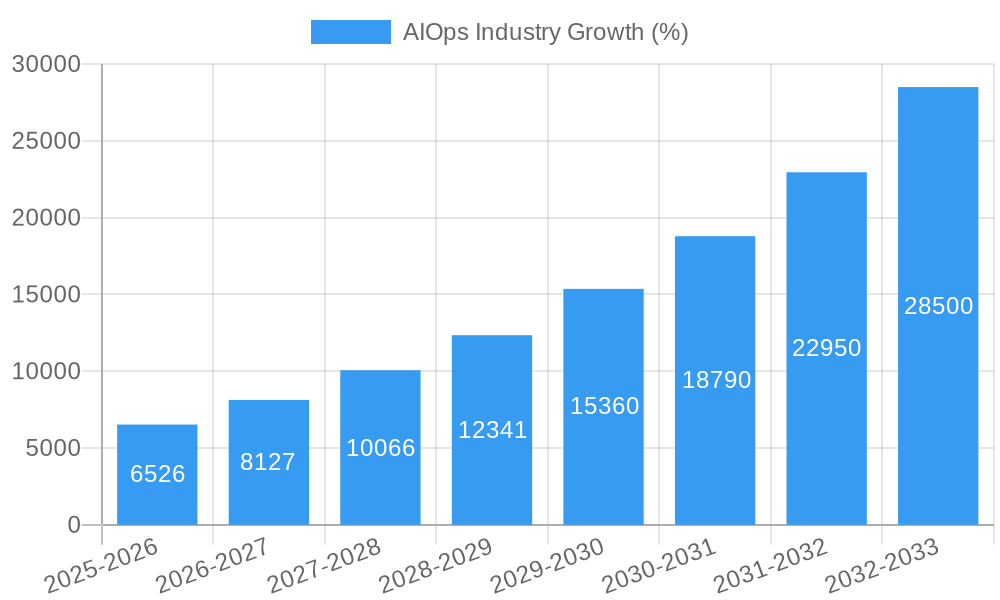
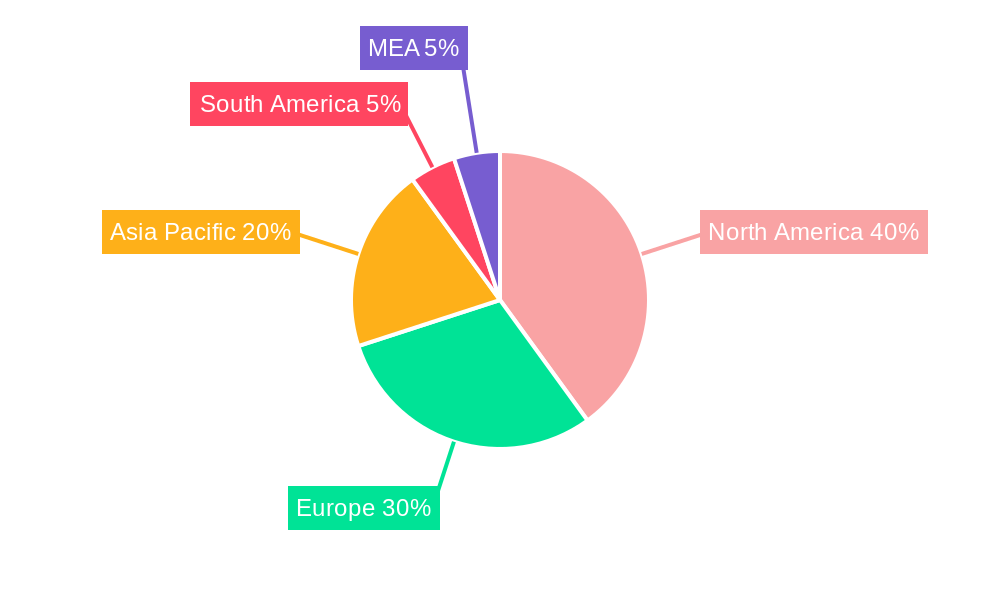
The AIOps market, valued at $27.24 billion in 2025, is experiencing robust growth, projected to expand at a Compound Annual Growth Rate (CAGR) of 24.01% from 2025 to 2033. This surge is driven by the increasing complexity of IT infrastructure, the exponential growth of data, and the rising need for proactive IT operations management. Businesses are increasingly adopting AIOps solutions to automate IT operations, improve incident detection and resolution times, enhance IT efficiency, and reduce operational costs. Key trends shaping the market include the increasing adoption of cloud-based AIOps solutions, the growing integration of AIOps with other IT management tools, and the rise of AI-powered automation for IT tasks. While data security concerns and the need for skilled professionals to implement and manage AIOps solutions represent potential restraints, the overall market outlook remains extremely positive. The strong adoption across various end-user industries, including Media & Entertainment, IT & Telecom, Retail, Healthcare, and BFSI, further fuels this growth. The large enterprise segment is a significant contributor, given their complex IT landscapes. Geographic expansion is also a key driver, with North America currently holding a leading market share, followed by Europe and the Asia-Pacific region, each exhibiting strong growth potential.
The diverse deployment models—on-premise, cloud/SaaS—cater to different organizational needs and preferences. Major players like IBM, Cisco, Splunk, ServiceNow, and BMC Software are actively shaping the market landscape through continuous innovation and strategic partnerships. The forecast period (2025-2033) promises significant expansion, fueled by the continued digital transformation across industries and the increasing reliance on AI-driven insights for streamlined IT operations. Growth in emerging markets within the Asia-Pacific region and MEA will also contribute significantly to the overall market expansion. The shift towards proactive, rather than reactive, IT management further underscores the long-term potential of the AIOps market.
AIOps Industry: A Comprehensive Market Report (2019-2033)
This insightful report provides a detailed analysis of the AIOps (Artificial Intelligence for IT Operations) industry, projecting a market valued at $XX Million by 2033. The study encompasses the historical period (2019-2024), the base year (2025), and the forecast period (2025-2033), offering stakeholders a comprehensive understanding of market dynamics, growth trajectories, and future opportunities. This report is crucial for businesses seeking to understand the evolving AIOps landscape, identify lucrative investment avenues, and strategize for future growth within this rapidly expanding sector.
AIOps Industry Market Composition & Trends
The AIOps market is characterized by a moderately concentrated landscape with key players like IBM, Cisco, Splunk, ServiceNow, and BMC Software vying for market share. The estimated market size in 2025 is $XX Million, with a projected Compound Annual Growth Rate (CAGR) of XX% during the forecast period. Market share distribution in 2025 is estimated as follows: IBM (XX%), Splunk (XX%), ServiceNow (XX%), Cisco (XX%), BMC Software (XX%), and Others (XX%). Innovation is driven by advancements in AI, machine learning, and big data analytics, enabling enhanced automation, predictive capabilities, and proactive issue resolution. The regulatory landscape is evolving, with a focus on data privacy and security, influencing product development and deployment strategies. Substitute products, such as traditional IT monitoring tools, face increasing pressure due to the superior capabilities and cost-effectiveness of AIOps solutions. The report analyzes M&A activity, with an estimated total deal value of $XX Million during the historical period, highlighting key strategic acquisitions and their impact on market consolidation. End-user profiles reveal strong adoption across diverse sectors like IT & Telecom, BFSI (Banking, Financial Services, and Insurance), Retail, Healthcare, and Media & Entertainment, with Large Enterprises exhibiting higher adoption rates than SMEs.
- Market Concentration: Moderately concentrated, with top 5 players holding XX% of market share in 2025.
- Innovation Catalysts: AI/ML advancements, Big Data analytics, and cloud computing.
- Regulatory Landscape: Focus on data privacy and security standards.
- Substitute Products: Traditional IT monitoring tools.
- M&A Activity: Total deal value of $XX Million during 2019-2024.
- End-User Profiles: Strong adoption across various sectors, with Large Enterprises leading the charge.
AIOps Industry Evolution
The AIOps market has witnessed significant growth since 2019, driven by the increasing complexity of IT infrastructures, the rising volume of IT data, and the need for enhanced operational efficiency. The market's evolution is characterized by a shift from reactive to proactive IT management, enabled by AI-powered automation and predictive analytics. Early adoption primarily focused on on-premise deployments; however, cloud/SaaS deployments are rapidly gaining traction due to scalability, cost-effectiveness, and ease of implementation. Technological advancements, including the integration of natural language processing (NLP) and advanced analytics, are further enhancing the capabilities of AIOps platforms. Consumer demand is shifting toward solutions that provide greater context, improved observability, and seamless integration with existing IT tools. This evolution is characterized by an increasing focus on business outcomes, with AIOps solutions providing actionable insights that directly impact business KPIs. The global AIOps market size is estimated at $XX Million in 2025, showcasing significant growth from $XX Million in 2019. The adoption rate across various industries, particularly IT and Telecom, BFSI, and Retail, is accelerating, driven by the need for faster incident resolution and improved operational efficiency.
Leading Regions, Countries, or Segments in AIOps Industry
North America currently dominates the AIOps market, driven by high technological advancements, significant investments in IT infrastructure, and early adoption by large enterprises. However, the Asia-Pacific region is expected to witness significant growth in the coming years, fueled by increasing digitalization and expanding IT spending.
- Dominant Region: North America
- Key Drivers (North America): High tech adoption, substantial IT investments, and early enterprise adoption.
- High-Growth Region: Asia-Pacific
- Key Drivers (Asia-Pacific): Increasing digitalization, expanding IT spending, and government initiatives.
- Leading Deployment Segment: Cloud/SaaS (due to scalability and ease of use)
- Leading End-User Industries: IT and Telecom, BFSI
- Leading Organization Type: Large Enterprises (due to higher IT budgets and complex infrastructures)
AIOps Industry Product Innovations
Recent innovations in AIOps include enhanced AI/ML algorithms for more accurate predictions and automated remediation, advanced visualization dashboards for improved insights and quicker decision-making, and better integration capabilities with existing IT monitoring tools and enterprise applications. These advancements provide unique selling propositions focusing on reduced mean time to resolution (MTTR), improved operational efficiency, and enhanced IT agility.
Propelling Factors for AIOps Industry Growth
Several factors propel AIOps market growth: the increasing complexity of IT environments, requiring automated solutions for efficient management; the exponential growth of IT data, demanding sophisticated analytics for meaningful insights; and the rising adoption of cloud computing and DevOps practices. Furthermore, regulatory compliance mandates drive the need for AIOps solutions offering enhanced security and observability. Economic factors, such as the need for cost optimization and improved ROI on IT investments, further fuel AIOps adoption.
Obstacles in the AIOps Industry Market
Significant barriers to AIOps market growth include the high initial investment costs for implementation, the need for skilled professionals to effectively manage and interpret AIOps data, and the integration complexities with existing legacy IT systems. Supply chain disruptions can hinder the availability of essential hardware and software components, impacting the timely deployment of AIOps solutions. Furthermore, intense competition among established players and emerging startups creates pressure on pricing and innovation.
Future Opportunities in AIOps Industry
Future opportunities lie in the expansion of AIOps into new markets, such as the Internet of Things (IoT) and edge computing. Emerging technologies like serverless computing and quantum computing will further enhance the capabilities of AIOps solutions. Moreover, growing demand for improved cybersecurity and proactive threat detection will drive innovation and adoption of AIOps solutions with enhanced security features. The expanding focus on AIOps for business process optimization and improved customer experience represents a significant growth opportunity.
Major Players in the AIOps Industry Ecosystem
Key Developments in AIOps Industry
- October 2022: IBM announced version 3.5 of IBM Cloud Pak for Watson AIOps, enhancing business context visibility and prioritizing IT issues.
- September 2022: Fortinet introduced AI-based network services management for 5G/LTE gateways, bolstering its AIOps capabilities.
- March 2022: Deloitte launched AIOPS.D, a modular AI-powered platform for autonomous business process management.
Strategic AIOps Industry Market Forecast
The AIOps market is poised for sustained growth, driven by the continuous expansion of cloud adoption, the proliferation of data, and the increasing demand for automated IT operations. Opportunities exist in expanding into new verticals, integrating with emerging technologies, and creating solutions that address specific business challenges across various sectors. The market's potential is significant, with a projected value of $XX Million by 2033, representing substantial growth and investment opportunities.
AIOps Industry Segmentation
-
1. Organization Type
- 1.1. Small and Medium Enterprises
- 1.2. Large Enterprise
-
2. Deployment
- 2.1. On-Premise
- 2.2. Cloud/SaaS
-
3. End-User Industry
- 3.1. Media and Entertainment
- 3.2. IT and Telecom
- 3.3. Retail
- 3.4. Healthcare
- 3.5. BFSI
- 3.6. Other End-User Industries
AIOps Industry Segmentation By Geography
- 1. North America
- 2. Europe
- 3. Asia Pacific
- 4. Latin America
- 5. Middle East and Africa
AIOps Industry REPORT HIGHLIGHTS
| Aspects | Details |
|---|---|
| Study Period | 2019-2033 |
| Base Year | 2024 |
| Estimated Year | 2025 |
| Forecast Period | 2025-2033 |
| Historical Period | 2019-2024 |
| Growth Rate | CAGR of 24.01% from 2019-2033 |
| Segmentation |
|
Table of Contents
- 1. Introduction
- 1.1. Research Scope
- 1.2. Market Segmentation
- 1.3. Research Methodology
- 1.4. Definitions and Assumptions
- 2. Executive Summary
- 2.1. Introduction
- 3. Market Dynamics
- 3.1. Introduction
- 3.2. Market Drivers
- 3.2.1. Growing demand for AI-based services in IT operations; Increasing end-to-end business application assurance and uptime
- 3.3. Market Restrains
- 3.3.1. Increasing number of changes in IT operations
- 3.4. Market Trends
- 3.4.1. BFSI is Expected to Hold Significant Share
- 4. Market Factor Analysis
- 4.1. Porters Five Forces
- 4.2. Supply/Value Chain
- 4.3. PESTEL analysis
- 4.4. Market Entropy
- 4.5. Patent/Trademark Analysis
- 5. Global AIOps Industry Analysis, Insights and Forecast, 2019-2031
- 5.1. Market Analysis, Insights and Forecast - by Organization Type
- 5.1.1. Small and Medium Enterprises
- 5.1.2. Large Enterprise
- 5.2. Market Analysis, Insights and Forecast - by Deployment
- 5.2.1. On-Premise
- 5.2.2. Cloud/SaaS
- 5.3. Market Analysis, Insights and Forecast - by End-User Industry
- 5.3.1. Media and Entertainment
- 5.3.2. IT and Telecom
- 5.3.3. Retail
- 5.3.4. Healthcare
- 5.3.5. BFSI
- 5.3.6. Other End-User Industries
- 5.4. Market Analysis, Insights and Forecast - by Region
- 5.4.1. North America
- 5.4.2. Europe
- 5.4.3. Asia Pacific
- 5.4.4. Latin America
- 5.4.5. Middle East and Africa
- 5.1. Market Analysis, Insights and Forecast - by Organization Type
- 6. North America AIOps Industry Analysis, Insights and Forecast, 2019-2031
- 6.1. Market Analysis, Insights and Forecast - by Organization Type
- 6.1.1. Small and Medium Enterprises
- 6.1.2. Large Enterprise
- 6.2. Market Analysis, Insights and Forecast - by Deployment
- 6.2.1. On-Premise
- 6.2.2. Cloud/SaaS
- 6.3. Market Analysis, Insights and Forecast - by End-User Industry
- 6.3.1. Media and Entertainment
- 6.3.2. IT and Telecom
- 6.3.3. Retail
- 6.3.4. Healthcare
- 6.3.5. BFSI
- 6.3.6. Other End-User Industries
- 6.1. Market Analysis, Insights and Forecast - by Organization Type
- 7. Europe AIOps Industry Analysis, Insights and Forecast, 2019-2031
- 7.1. Market Analysis, Insights and Forecast - by Organization Type
- 7.1.1. Small and Medium Enterprises
- 7.1.2. Large Enterprise
- 7.2. Market Analysis, Insights and Forecast - by Deployment
- 7.2.1. On-Premise
- 7.2.2. Cloud/SaaS
- 7.3. Market Analysis, Insights and Forecast - by End-User Industry
- 7.3.1. Media and Entertainment
- 7.3.2. IT and Telecom
- 7.3.3. Retail
- 7.3.4. Healthcare
- 7.3.5. BFSI
- 7.3.6. Other End-User Industries
- 7.1. Market Analysis, Insights and Forecast - by Organization Type
- 8. Asia Pacific AIOps Industry Analysis, Insights and Forecast, 2019-2031
- 8.1. Market Analysis, Insights and Forecast - by Organization Type
- 8.1.1. Small and Medium Enterprises
- 8.1.2. Large Enterprise
- 8.2. Market Analysis, Insights and Forecast - by Deployment
- 8.2.1. On-Premise
- 8.2.2. Cloud/SaaS
- 8.3. Market Analysis, Insights and Forecast - by End-User Industry
- 8.3.1. Media and Entertainment
- 8.3.2. IT and Telecom
- 8.3.3. Retail
- 8.3.4. Healthcare
- 8.3.5. BFSI
- 8.3.6. Other End-User Industries
- 8.1. Market Analysis, Insights and Forecast - by Organization Type
- 9. Latin America AIOps Industry Analysis, Insights and Forecast, 2019-2031
- 9.1. Market Analysis, Insights and Forecast - by Organization Type
- 9.1.1. Small and Medium Enterprises
- 9.1.2. Large Enterprise
- 9.2. Market Analysis, Insights and Forecast - by Deployment
- 9.2.1. On-Premise
- 9.2.2. Cloud/SaaS
- 9.3. Market Analysis, Insights and Forecast - by End-User Industry
- 9.3.1. Media and Entertainment
- 9.3.2. IT and Telecom
- 9.3.3. Retail
- 9.3.4. Healthcare
- 9.3.5. BFSI
- 9.3.6. Other End-User Industries
- 9.1. Market Analysis, Insights and Forecast - by Organization Type
- 10. Middle East and Africa AIOps Industry Analysis, Insights and Forecast, 2019-2031
- 10.1. Market Analysis, Insights and Forecast - by Organization Type
- 10.1.1. Small and Medium Enterprises
- 10.1.2. Large Enterprise
- 10.2. Market Analysis, Insights and Forecast - by Deployment
- 10.2.1. On-Premise
- 10.2.2. Cloud/SaaS
- 10.3. Market Analysis, Insights and Forecast - by End-User Industry
- 10.3.1. Media and Entertainment
- 10.3.2. IT and Telecom
- 10.3.3. Retail
- 10.3.4. Healthcare
- 10.3.5. BFSI
- 10.3.6. Other End-User Industries
- 10.1. Market Analysis, Insights and Forecast - by Organization Type
- 11. North America AIOps Industry Analysis, Insights and Forecast, 2019-2031
- 11.1. Market Analysis, Insights and Forecast - By Country/Sub-region
- 11.1.1 United States
- 11.1.2 Canada
- 11.1.3 Mexico
- 12. Europe AIOps Industry Analysis, Insights and Forecast, 2019-2031
- 12.1. Market Analysis, Insights and Forecast - By Country/Sub-region
- 12.1.1 Germany
- 12.1.2 United Kingdom
- 12.1.3 France
- 12.1.4 Spain
- 12.1.5 Italy
- 12.1.6 Spain
- 12.1.7 Belgium
- 12.1.8 Netherland
- 12.1.9 Nordics
- 12.1.10 Rest of Europe
- 13. Asia Pacific AIOps Industry Analysis, Insights and Forecast, 2019-2031
- 13.1. Market Analysis, Insights and Forecast - By Country/Sub-region
- 13.1.1 China
- 13.1.2 Japan
- 13.1.3 India
- 13.1.4 South Korea
- 13.1.5 Southeast Asia
- 13.1.6 Australia
- 13.1.7 Indonesia
- 13.1.8 Phillipes
- 13.1.9 Singapore
- 13.1.10 Thailandc
- 13.1.11 Rest of Asia Pacific
- 14. South America AIOps Industry Analysis, Insights and Forecast, 2019-2031
- 14.1. Market Analysis, Insights and Forecast - By Country/Sub-region
- 14.1.1 Brazil
- 14.1.2 Argentina
- 14.1.3 Peru
- 14.1.4 Chile
- 14.1.5 Colombia
- 14.1.6 Ecuador
- 14.1.7 Venezuela
- 14.1.8 Rest of South America
- 15. MEA AIOps Industry Analysis, Insights and Forecast, 2019-2031
- 15.1. Market Analysis, Insights and Forecast - By Country/Sub-region
- 15.1.1 United Arab Emirates
- 15.1.2 Saudi Arabia
- 15.1.3 South Africa
- 15.1.4 Rest of Middle East and Africa
- 16. Competitive Analysis
- 16.1. Global Market Share Analysis 2024
- 16.2. Company Profiles
- 16.2.1 IBM
- 16.2.1.1. Overview
- 16.2.1.2. Products
- 16.2.1.3. SWOT Analysis
- 16.2.1.4. Recent Developments
- 16.2.1.5. Financials (Based on Availability)
- 16.2.2 Cisco
- 16.2.2.1. Overview
- 16.2.2.2. Products
- 16.2.2.3. SWOT Analysis
- 16.2.2.4. Recent Developments
- 16.2.2.5. Financials (Based on Availability)
- 16.2.3 Splunk
- 16.2.3.1. Overview
- 16.2.3.2. Products
- 16.2.3.3. SWOT Analysis
- 16.2.3.4. Recent Developments
- 16.2.3.5. Financials (Based on Availability)
- 16.2.4 ServiceNow
- 16.2.4.1. Overview
- 16.2.4.2. Products
- 16.2.4.3. SWOT Analysis
- 16.2.4.4. Recent Developments
- 16.2.4.5. Financials (Based on Availability)
- 16.2.5 BMC Software
- 16.2.5.1. Overview
- 16.2.5.2. Products
- 16.2.5.3. SWOT Analysis
- 16.2.5.4. Recent Developments
- 16.2.5.5. Financials (Based on Availability)
- 16.2.1 IBM
List of Figures
- Figure 1: Global AIOps Industry Revenue Breakdown (Million, %) by Region 2024 & 2032
- Figure 2: North America AIOps Industry Revenue (Million), by Country 2024 & 2032
- Figure 3: North America AIOps Industry Revenue Share (%), by Country 2024 & 2032
- Figure 4: Europe AIOps Industry Revenue (Million), by Country 2024 & 2032
- Figure 5: Europe AIOps Industry Revenue Share (%), by Country 2024 & 2032
- Figure 6: Asia Pacific AIOps Industry Revenue (Million), by Country 2024 & 2032
- Figure 7: Asia Pacific AIOps Industry Revenue Share (%), by Country 2024 & 2032
- Figure 8: South America AIOps Industry Revenue (Million), by Country 2024 & 2032
- Figure 9: South America AIOps Industry Revenue Share (%), by Country 2024 & 2032
- Figure 10: MEA AIOps Industry Revenue (Million), by Country 2024 & 2032
- Figure 11: MEA AIOps Industry Revenue Share (%), by Country 2024 & 2032
- Figure 12: North America AIOps Industry Revenue (Million), by Organization Type 2024 & 2032
- Figure 13: North America AIOps Industry Revenue Share (%), by Organization Type 2024 & 2032
- Figure 14: North America AIOps Industry Revenue (Million), by Deployment 2024 & 2032
- Figure 15: North America AIOps Industry Revenue Share (%), by Deployment 2024 & 2032
- Figure 16: North America AIOps Industry Revenue (Million), by End-User Industry 2024 & 2032
- Figure 17: North America AIOps Industry Revenue Share (%), by End-User Industry 2024 & 2032
- Figure 18: North America AIOps Industry Revenue (Million), by Country 2024 & 2032
- Figure 19: North America AIOps Industry Revenue Share (%), by Country 2024 & 2032
- Figure 20: Europe AIOps Industry Revenue (Million), by Organization Type 2024 & 2032
- Figure 21: Europe AIOps Industry Revenue Share (%), by Organization Type 2024 & 2032
- Figure 22: Europe AIOps Industry Revenue (Million), by Deployment 2024 & 2032
- Figure 23: Europe AIOps Industry Revenue Share (%), by Deployment 2024 & 2032
- Figure 24: Europe AIOps Industry Revenue (Million), by End-User Industry 2024 & 2032
- Figure 25: Europe AIOps Industry Revenue Share (%), by End-User Industry 2024 & 2032
- Figure 26: Europe AIOps Industry Revenue (Million), by Country 2024 & 2032
- Figure 27: Europe AIOps Industry Revenue Share (%), by Country 2024 & 2032
- Figure 28: Asia Pacific AIOps Industry Revenue (Million), by Organization Type 2024 & 2032
- Figure 29: Asia Pacific AIOps Industry Revenue Share (%), by Organization Type 2024 & 2032
- Figure 30: Asia Pacific AIOps Industry Revenue (Million), by Deployment 2024 & 2032
- Figure 31: Asia Pacific AIOps Industry Revenue Share (%), by Deployment 2024 & 2032
- Figure 32: Asia Pacific AIOps Industry Revenue (Million), by End-User Industry 2024 & 2032
- Figure 33: Asia Pacific AIOps Industry Revenue Share (%), by End-User Industry 2024 & 2032
- Figure 34: Asia Pacific AIOps Industry Revenue (Million), by Country 2024 & 2032
- Figure 35: Asia Pacific AIOps Industry Revenue Share (%), by Country 2024 & 2032
- Figure 36: Latin America AIOps Industry Revenue (Million), by Organization Type 2024 & 2032
- Figure 37: Latin America AIOps Industry Revenue Share (%), by Organization Type 2024 & 2032
- Figure 38: Latin America AIOps Industry Revenue (Million), by Deployment 2024 & 2032
- Figure 39: Latin America AIOps Industry Revenue Share (%), by Deployment 2024 & 2032
- Figure 40: Latin America AIOps Industry Revenue (Million), by End-User Industry 2024 & 2032
- Figure 41: Latin America AIOps Industry Revenue Share (%), by End-User Industry 2024 & 2032
- Figure 42: Latin America AIOps Industry Revenue (Million), by Country 2024 & 2032
- Figure 43: Latin America AIOps Industry Revenue Share (%), by Country 2024 & 2032
- Figure 44: Middle East and Africa AIOps Industry Revenue (Million), by Organization Type 2024 & 2032
- Figure 45: Middle East and Africa AIOps Industry Revenue Share (%), by Organization Type 2024 & 2032
- Figure 46: Middle East and Africa AIOps Industry Revenue (Million), by Deployment 2024 & 2032
- Figure 47: Middle East and Africa AIOps Industry Revenue Share (%), by Deployment 2024 & 2032
- Figure 48: Middle East and Africa AIOps Industry Revenue (Million), by End-User Industry 2024 & 2032
- Figure 49: Middle East and Africa AIOps Industry Revenue Share (%), by End-User Industry 2024 & 2032
- Figure 50: Middle East and Africa AIOps Industry Revenue (Million), by Country 2024 & 2032
- Figure 51: Middle East and Africa AIOps Industry Revenue Share (%), by Country 2024 & 2032
List of Tables
- Table 1: Global AIOps Industry Revenue Million Forecast, by Region 2019 & 2032
- Table 2: Global AIOps Industry Revenue Million Forecast, by Organization Type 2019 & 2032
- Table 3: Global AIOps Industry Revenue Million Forecast, by Deployment 2019 & 2032
- Table 4: Global AIOps Industry Revenue Million Forecast, by End-User Industry 2019 & 2032
- Table 5: Global AIOps Industry Revenue Million Forecast, by Region 2019 & 2032
- Table 6: Global AIOps Industry Revenue Million Forecast, by Country 2019 & 2032
- Table 7: United States AIOps Industry Revenue (Million) Forecast, by Application 2019 & 2032
- Table 8: Canada AIOps Industry Revenue (Million) Forecast, by Application 2019 & 2032
- Table 9: Mexico AIOps Industry Revenue (Million) Forecast, by Application 2019 & 2032
- Table 10: Global AIOps Industry Revenue Million Forecast, by Country 2019 & 2032
- Table 11: Germany AIOps Industry Revenue (Million) Forecast, by Application 2019 & 2032
- Table 12: United Kingdom AIOps Industry Revenue (Million) Forecast, by Application 2019 & 2032
- Table 13: France AIOps Industry Revenue (Million) Forecast, by Application 2019 & 2032
- Table 14: Spain AIOps Industry Revenue (Million) Forecast, by Application 2019 & 2032
- Table 15: Italy AIOps Industry Revenue (Million) Forecast, by Application 2019 & 2032
- Table 16: Spain AIOps Industry Revenue (Million) Forecast, by Application 2019 & 2032
- Table 17: Belgium AIOps Industry Revenue (Million) Forecast, by Application 2019 & 2032
- Table 18: Netherland AIOps Industry Revenue (Million) Forecast, by Application 2019 & 2032
- Table 19: Nordics AIOps Industry Revenue (Million) Forecast, by Application 2019 & 2032
- Table 20: Rest of Europe AIOps Industry Revenue (Million) Forecast, by Application 2019 & 2032
- Table 21: Global AIOps Industry Revenue Million Forecast, by Country 2019 & 2032
- Table 22: China AIOps Industry Revenue (Million) Forecast, by Application 2019 & 2032
- Table 23: Japan AIOps Industry Revenue (Million) Forecast, by Application 2019 & 2032
- Table 24: India AIOps Industry Revenue (Million) Forecast, by Application 2019 & 2032
- Table 25: South Korea AIOps Industry Revenue (Million) Forecast, by Application 2019 & 2032
- Table 26: Southeast Asia AIOps Industry Revenue (Million) Forecast, by Application 2019 & 2032
- Table 27: Australia AIOps Industry Revenue (Million) Forecast, by Application 2019 & 2032
- Table 28: Indonesia AIOps Industry Revenue (Million) Forecast, by Application 2019 & 2032
- Table 29: Phillipes AIOps Industry Revenue (Million) Forecast, by Application 2019 & 2032
- Table 30: Singapore AIOps Industry Revenue (Million) Forecast, by Application 2019 & 2032
- Table 31: Thailandc AIOps Industry Revenue (Million) Forecast, by Application 2019 & 2032
- Table 32: Rest of Asia Pacific AIOps Industry Revenue (Million) Forecast, by Application 2019 & 2032
- Table 33: Global AIOps Industry Revenue Million Forecast, by Country 2019 & 2032
- Table 34: Brazil AIOps Industry Revenue (Million) Forecast, by Application 2019 & 2032
- Table 35: Argentina AIOps Industry Revenue (Million) Forecast, by Application 2019 & 2032
- Table 36: Peru AIOps Industry Revenue (Million) Forecast, by Application 2019 & 2032
- Table 37: Chile AIOps Industry Revenue (Million) Forecast, by Application 2019 & 2032
- Table 38: Colombia AIOps Industry Revenue (Million) Forecast, by Application 2019 & 2032
- Table 39: Ecuador AIOps Industry Revenue (Million) Forecast, by Application 2019 & 2032
- Table 40: Venezuela AIOps Industry Revenue (Million) Forecast, by Application 2019 & 2032
- Table 41: Rest of South America AIOps Industry Revenue (Million) Forecast, by Application 2019 & 2032
- Table 42: Global AIOps Industry Revenue Million Forecast, by Country 2019 & 2032
- Table 43: United Arab Emirates AIOps Industry Revenue (Million) Forecast, by Application 2019 & 2032
- Table 44: Saudi Arabia AIOps Industry Revenue (Million) Forecast, by Application 2019 & 2032
- Table 45: South Africa AIOps Industry Revenue (Million) Forecast, by Application 2019 & 2032
- Table 46: Rest of Middle East and Africa AIOps Industry Revenue (Million) Forecast, by Application 2019 & 2032
- Table 47: Global AIOps Industry Revenue Million Forecast, by Organization Type 2019 & 2032
- Table 48: Global AIOps Industry Revenue Million Forecast, by Deployment 2019 & 2032
- Table 49: Global AIOps Industry Revenue Million Forecast, by End-User Industry 2019 & 2032
- Table 50: Global AIOps Industry Revenue Million Forecast, by Country 2019 & 2032
- Table 51: Global AIOps Industry Revenue Million Forecast, by Organization Type 2019 & 2032
- Table 52: Global AIOps Industry Revenue Million Forecast, by Deployment 2019 & 2032
- Table 53: Global AIOps Industry Revenue Million Forecast, by End-User Industry 2019 & 2032
- Table 54: Global AIOps Industry Revenue Million Forecast, by Country 2019 & 2032
- Table 55: Global AIOps Industry Revenue Million Forecast, by Organization Type 2019 & 2032
- Table 56: Global AIOps Industry Revenue Million Forecast, by Deployment 2019 & 2032
- Table 57: Global AIOps Industry Revenue Million Forecast, by End-User Industry 2019 & 2032
- Table 58: Global AIOps Industry Revenue Million Forecast, by Country 2019 & 2032
- Table 59: Global AIOps Industry Revenue Million Forecast, by Organization Type 2019 & 2032
- Table 60: Global AIOps Industry Revenue Million Forecast, by Deployment 2019 & 2032
- Table 61: Global AIOps Industry Revenue Million Forecast, by End-User Industry 2019 & 2032
- Table 62: Global AIOps Industry Revenue Million Forecast, by Country 2019 & 2032
- Table 63: Global AIOps Industry Revenue Million Forecast, by Organization Type 2019 & 2032
- Table 64: Global AIOps Industry Revenue Million Forecast, by Deployment 2019 & 2032
- Table 65: Global AIOps Industry Revenue Million Forecast, by End-User Industry 2019 & 2032
- Table 66: Global AIOps Industry Revenue Million Forecast, by Country 2019 & 2032
Frequently Asked Questions
1. What is the projected Compound Annual Growth Rate (CAGR) of the AIOps Industry?
The projected CAGR is approximately 24.01%.
2. Which companies are prominent players in the AIOps Industry?
Key companies in the market include IBM , Cisco , Splunk , ServiceNow , BMC Software.
3. What are the main segments of the AIOps Industry?
The market segments include Organization Type, Deployment, End-User Industry.
4. Can you provide details about the market size?
The market size is estimated to be USD 27.24 Million as of 2022.
5. What are some drivers contributing to market growth?
Growing demand for AI-based services in IT operations; Increasing end-to-end business application assurance and uptime.
6. What are the notable trends driving market growth?
BFSI is Expected to Hold Significant Share.
7. Are there any restraints impacting market growth?
Increasing number of changes in IT operations.
8. Can you provide examples of recent developments in the market?
October 2022- IBM announced version 3.5 availability of the IBM Cloud Pak for Watson AIOps. With an emphasis on the capability to assist the users in understanding priorities among all IT stories in the context of a business line or service, IBM Cloud Pak for Watson AIOps v3.5 seeks to close this gap. Business context data is made available on an AIOps Insights Dashboard by Cloud Pak for Watson AIOps v3.5, a new offering feature in this release. It provides an illustration of the buyer context for the stakeholders to link business key performance indicators (KPIs) to application problems and rank repair options according to their potential effect.
9. What pricing options are available for accessing the report?
Pricing options include single-user, multi-user, and enterprise licenses priced at USD 4750, USD 5250, and USD 8750 respectively.
10. Is the market size provided in terms of value or volume?
The market size is provided in terms of value, measured in Million.
11. Are there any specific market keywords associated with the report?
Yes, the market keyword associated with the report is "AIOps Industry," which aids in identifying and referencing the specific market segment covered.
12. How do I determine which pricing option suits my needs best?
The pricing options vary based on user requirements and access needs. Individual users may opt for single-user licenses, while businesses requiring broader access may choose multi-user or enterprise licenses for cost-effective access to the report.
13. Are there any additional resources or data provided in the AIOps Industry report?
While the report offers comprehensive insights, it's advisable to review the specific contents or supplementary materials provided to ascertain if additional resources or data are available.
14. How can I stay updated on further developments or reports in the AIOps Industry?
To stay informed about further developments, trends, and reports in the AIOps Industry, consider subscribing to industry newsletters, following relevant companies and organizations, or regularly checking reputable industry news sources and publications.
Methodology
Step 1 - Identification of Relevant Samples Size from Population Database


Step 2 - Approaches for Defining Global Market Size (Value, Volume* & Price*)

Note*: In applicable scenarios
Step 3 - Data Sources
Primary Research
- Web Analytics
- Survey Reports
- Research Institute
- Latest Research Reports
- Opinion Leaders
Secondary Research
- Annual Reports
- White Paper
- Latest Press Release
- Industry Association
- Paid Database
- Investor Presentations

Step 4 - Data Triangulation
Involves using different sources of information in order to increase the validity of a study
These sources are likely to be stakeholders in a program - participants, other researchers, program staff, other community members, and so on.
Then we put all data in single framework & apply various statistical tools to find out the dynamic on the market.
During the analysis stage, feedback from the stakeholder groups would be compared to determine areas of agreement as well as areas of divergence
