

Key Insights
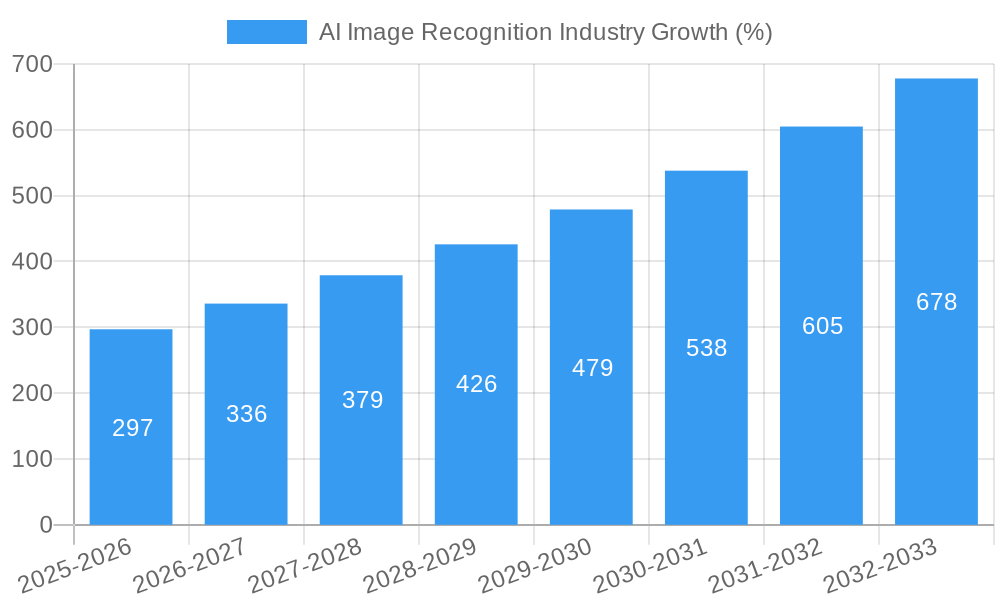
The AI Image Recognition market is experiencing robust growth, projected to reach \$2.55 billion in 2025 and exhibiting a Compound Annual Growth Rate (CAGR) of 11.76% from 2025 to 2033. This expansion is fueled by several key drivers. The increasing adoption of AI across diverse sectors, such as automotive (autonomous driving systems), BFSI (fraud detection and risk management), healthcare (medical image analysis), and retail (inventory management and customer experience enhancement), is a significant catalyst. Advancements in deep learning algorithms, improved computational power, and the availability of large, high-quality image datasets are further propelling market growth. The market is segmented by type (hardware, software, services) and end-user verticals, with hardware components currently dominating due to the need for powerful processors and specialized hardware accelerators. However, the software segment is expected to witness significant growth owing to the increasing demand for sophisticated AI algorithms and cloud-based image recognition solutions. Competitive intensity is high, with major players like Google, Microsoft, Amazon, and NVIDIA driving innovation and market penetration. While data privacy concerns and the need for robust cybersecurity measures pose certain restraints, the overall market outlook remains positive, driven by ongoing technological advancements and expanding applications across various industries.
The geographical distribution of the market shows strong growth across all regions, with North America and Asia Pacific currently holding the largest market shares. However, emerging economies in Asia Pacific, particularly India and Southeast Asia, are projected to experience rapid growth due to increasing digitalization and investments in AI infrastructure. Europe is also expected to witness steady expansion, driven by the adoption of AI in various industries. Companies are strategically focusing on partnerships, acquisitions, and research and development to gain a competitive edge in this rapidly evolving landscape. The future of the AI Image Recognition market is bright, with promising applications emerging in areas like smart cities, environmental monitoring, and augmented reality, ensuring sustained high growth throughout the forecast period. Continued innovation in algorithm development and the accessibility of affordable hardware will be instrumental in expanding market penetration and solidifying the market's long-term growth trajectory.

AI Image Recognition Industry Market Composition & Trends
The AI Image Recognition Industry is characterized by a dynamic market composition, with a significant focus on technological innovation and market consolidation. The industry's market concentration is moderate, with key players like Xilinx Inc, Clarifai Inc, and IBM Corporation holding substantial market shares. The top five companies collectively account for approximately 45% of the market, highlighting a competitive yet consolidated landscape.
Innovation is a primary catalyst in this sector, driven by advancements in deep learning and neural networks. Regulatory landscapes are evolving, with increased focus on data privacy and security, impacting how AI solutions are developed and deployed. The rise of substitute products, such as manual image analysis tools, poses a challenge, but AI's superior accuracy and efficiency continue to drive its adoption across various end-user profiles, including Automotive, BFSI, Healthcare, and Retail.
Mergers and acquisitions are pivotal, with recent deals totaling over $500 Million, aimed at enhancing technological capabilities and expanding market reach. For instance, the acquisition of AI startups by major tech firms like Google and Microsoft has been a trend, bolstering their AI image recognition portfolios.
- Market Share Distribution: Top 5 companies - 45%
- M&A Deal Values: Over $500 Million in recent years
- Key End-User Verticals: Automotive, BFSI, Healthcare, Retail
AI Image Recognition Industry Industry Evolution
The AI Image Recognition Industry has undergone significant evolution over the study period from 2019 to 2033, with notable growth trajectories and technological advancements. The base year of 2025 marked a pivotal point, with the industry witnessing a compound annual growth rate (CAGR) of approximately 15% from 2025 to 2033. This growth is attributed to the increasing adoption of AI technologies across various sectors, driven by the need for automation and enhanced data analysis capabilities.
Technological advancements have been at the forefront of this evolution. The development of more sophisticated algorithms, such as convolutional neural networks (CNNs) and generative adversarial networks (GANs), has significantly improved the accuracy and efficiency of image recognition systems. These advancements have led to a shift in consumer demands, with a growing preference for AI-powered solutions that offer real-time, high-precision image analysis.
The automotive sector, for instance, has seen a 20% increase in the adoption of AI image recognition for autonomous driving and advanced driver-assistance systems (ADAS). Similarly, the healthcare sector has embraced AI for diagnostic imaging, with a 25% rise in the use of AI-assisted tools for detecting diseases from medical images.
Overall, the industry's evolution is marked by a continuous push towards more advanced, user-friendly, and cost-effective AI solutions, driven by both technological innovation and shifting consumer needs.
Leading Regions, Countries, or Segments in AI Image Recognition Industry
The AI Image Recognition Industry is dominated by North America, particularly the United States, which accounts for over 35% of the global market. This dominance is driven by robust investment trends, supportive regulatory frameworks, and a high concentration of leading technology companies.
- Investment Trends: North America has seen investments exceeding $2 Billion in AI image recognition startups and technologies.
- Regulatory Support: The U.S. government's initiatives, such as the National AI Initiative Act, have fostered an environment conducive to AI development.
- Key Players: Presence of major tech giants like Google, Microsoft, and Amazon, which are heavily investing in AI technologies.
In terms of segments, the Software segment leads the market, contributing to over 50% of the industry's revenue. This dominance is due to the scalability and flexibility of software solutions, which can be easily integrated across various end-user verticals.
- Software Segment: Over 50% of market revenue
- Key Drivers: Scalability, flexibility, and ease of integration
The Healthcare vertical is also a significant contributor, driven by the increasing use of AI in medical imaging and diagnostics. The demand for AI-assisted tools in healthcare is expected to grow at a CAGR of 20% over the forecast period.
- Healthcare Vertical: Expected CAGR of 20% from 2025 to 2033
- Key Factors: Rising need for accurate and efficient diagnostic tools
Overall, the dominance of North America and the Software segment is driven by a combination of investment, regulatory support, and the presence of key players, while the Healthcare vertical's growth is propelled by increasing adoption of AI in medical applications.
AI Image Recognition Industry Product Innovations
Product innovations in the AI Image Recognition Industry are centered around enhancing accuracy, speed, and applicability across various sectors. Recent advancements include the development of edge AI solutions, which enable real-time image processing on devices with limited computational resources. For instance, Qualcomm's latest Snapdragon processors incorporate AI capabilities, allowing for on-device image recognition. Additionally, companies like Nvidia are pushing the boundaries with their GPU-accelerated AI platforms, which significantly reduce processing times for complex image analysis tasks. These innovations not only improve performance metrics but also open new avenues for application in fields such as autonomous vehicles and smart retail.
Propelling Factors for AI Image Recognition Industry Growth
The AI Image Recognition Industry is propelled by several key factors:
- Technological Advancements: Continuous improvements in machine learning algorithms and hardware capabilities, such as those from Nvidia and Intel, drive market growth.
- Economic Influences: The increasing demand for automation in industries like automotive and retail boosts the adoption of AI image recognition.
- Regulatory Support: Government initiatives, such as the EU's AI strategy, encourage the development and deployment of AI technologies.
These factors collectively enhance the industry's growth trajectory, with specific examples including the integration of AI in smart city projects and healthcare diagnostics.
Obstacles in the AI Image Recognition Industry Market
Despite its growth, the AI Image Recognition Industry faces several obstacles:
- Regulatory Challenges: Stringent data privacy regulations, like GDPR, can slow down AI development and deployment.
- Supply Chain Disruptions: Global supply chain issues impact the availability of hardware components, affecting product timelines.
- Competitive Pressures: Intense competition leads to price wars and reduced profit margins, with an estimated impact of 10% on industry profitability.
These barriers necessitate strategic planning and innovation to overcome and maintain market growth.
Future Opportunities in AI Image Recognition Industry
The AI Image Recognition Industry is poised for future growth with emerging opportunities:
- New Markets: Expansion into emerging economies like India and Southeast Asia, where demand for AI solutions is growing rapidly.
- Technological Advancements: Development of AI-powered drones and IoT devices for real-time image analysis.
- Consumer Trends: Increasing consumer interest in personalized and AI-enhanced shopping experiences in the retail sector.
These opportunities highlight the potential for significant market expansion and innovation in the coming years.
Major Players in the AI Image Recognition Industry Ecosystem
- Xilinx Inc (AMD Inc)
- Clarifai Inc
- IBM Corporation
- Samsung Electronics Co Ltd
- Google LLC (Alphabet Inc)
- Microsoft Corporation
- Qualcomm Incorporated
- Amazon Web Services Inc (Amazon Com Inc)
- Micron Technologies Inc
- Nvidia Corporation
- Intel Corporation
Key Developments in AI Image Recognition Industry Industry
- September 2022: The International Society of Ultrasound in Obstetrics and Gynecology (ISUOG) World Congress 2022 took place in London, United Kingdom, from September 16 to September 18. Samsung Medison, a subsidiary of Samsung Electronics, showcased its high-end HERA W10 obstetric and gynecological ultrasound equipment with Intelligent Assist (AI diagnostic solutions), V8, and V7. This demonstration highlighted the integration of AI in medical imaging, enhancing diagnostic capabilities across various specialties.
- September 2022: Alcatraz AI, a Bulgarian startup, raised a USD 25 Million Series A round for its security solution that uses 3D facial authentication and AI to manage physical access. This funding, directed at SeedBlink, supports international growth and product innovation, reflecting the industry's trend towards advanced security solutions.
Strategic AI Image Recognition Industry Market Forecast
The strategic forecast for the AI Image Recognition Industry highlights several growth catalysts. The industry is expected to continue its upward trajectory, driven by technological advancements, increasing adoption across various sectors, and supportive regulatory environments. Future opportunities include the expansion into new markets, particularly in Asia-Pacific, and the development of new applications in areas such as smart cities and healthcare. The market potential is significant, with projections indicating a robust CAGR of 15% from 2025 to 2033, reflecting the industry's strong growth prospects and the continuous evolution of AI technologies.
AI Image Recognition Industry Segmentation
-
1. Type
- 1.1. Hardware
- 1.2. Software
- 1.3. Services
-
2. End-user Verticals
- 2.1. Automotive
- 2.2. BFSI
- 2.3. Healthcare
- 2.4. Retail
- 2.5. Security
- 2.6. Other End-user Verticals
AI Image Recognition Industry Segmentation By Geography
- 1. North America
- 2. Europe
- 3. Asia
- 4. Australia and New Zealand
- 5. Latin America
- 6. Middle East and Africa

AI Image Recognition Industry REPORT HIGHLIGHTS
| Aspects | Details |
|---|---|
| Study Period | 2019-2033 |
| Base Year | 2024 |
| Estimated Year | 2025 |
| Forecast Period | 2025-2033 |
| Historical Period | 2019-2024 |
| Growth Rate | CAGR of 11.76% from 2019-2033 |
| Segmentation |
|
Table of Contents
- 1. Introduction
- 1.1. Research Scope
- 1.2. Market Segmentation
- 1.3. Research Methodology
- 1.4. Definitions and Assumptions
- 2. Executive Summary
- 2.1. Introduction
- 3. Market Dynamics
- 3.1. Introduction
- 3.2. Market Drivers
- 3.2.1. Growing AI Adoption; Increasing Use of Big Data Analytics; Declining Costs of Hardware
- 3.3. Market Restrains
- 3.3.1. Lack of Technical Expertise
- 3.4. Market Trends
- 3.4.1. Healthcare Sector is Expected to Witness Significant Growth
- 4. Market Factor Analysis
- 4.1. Porters Five Forces
- 4.2. Supply/Value Chain
- 4.3. PESTEL analysis
- 4.4. Market Entropy
- 4.5. Patent/Trademark Analysis
- 5. Global AI Image Recognition Industry Analysis, Insights and Forecast, 2019-2031
- 5.1. Market Analysis, Insights and Forecast - by Type
- 5.1.1. Hardware
- 5.1.2. Software
- 5.1.3. Services
- 5.2. Market Analysis, Insights and Forecast - by End-user Verticals
- 5.2.1. Automotive
- 5.2.2. BFSI
- 5.2.3. Healthcare
- 5.2.4. Retail
- 5.2.5. Security
- 5.2.6. Other End-user Verticals
- 5.3. Market Analysis, Insights and Forecast - by Region
- 5.3.1. North America
- 5.3.2. Europe
- 5.3.3. Asia
- 5.3.4. Australia and New Zealand
- 5.3.5. Latin America
- 5.3.6. Middle East and Africa
- 5.1. Market Analysis, Insights and Forecast - by Type
- 6. North America AI Image Recognition Industry Analysis, Insights and Forecast, 2019-2031
- 6.1. Market Analysis, Insights and Forecast - by Type
- 6.1.1. Hardware
- 6.1.2. Software
- 6.1.3. Services
- 6.2. Market Analysis, Insights and Forecast - by End-user Verticals
- 6.2.1. Automotive
- 6.2.2. BFSI
- 6.2.3. Healthcare
- 6.2.4. Retail
- 6.2.5. Security
- 6.2.6. Other End-user Verticals
- 6.1. Market Analysis, Insights and Forecast - by Type
- 7. Europe AI Image Recognition Industry Analysis, Insights and Forecast, 2019-2031
- 7.1. Market Analysis, Insights and Forecast - by Type
- 7.1.1. Hardware
- 7.1.2. Software
- 7.1.3. Services
- 7.2. Market Analysis, Insights and Forecast - by End-user Verticals
- 7.2.1. Automotive
- 7.2.2. BFSI
- 7.2.3. Healthcare
- 7.2.4. Retail
- 7.2.5. Security
- 7.2.6. Other End-user Verticals
- 7.1. Market Analysis, Insights and Forecast - by Type
- 8. Asia AI Image Recognition Industry Analysis, Insights and Forecast, 2019-2031
- 8.1. Market Analysis, Insights and Forecast - by Type
- 8.1.1. Hardware
- 8.1.2. Software
- 8.1.3. Services
- 8.2. Market Analysis, Insights and Forecast - by End-user Verticals
- 8.2.1. Automotive
- 8.2.2. BFSI
- 8.2.3. Healthcare
- 8.2.4. Retail
- 8.2.5. Security
- 8.2.6. Other End-user Verticals
- 8.1. Market Analysis, Insights and Forecast - by Type
- 9. Australia and New Zealand AI Image Recognition Industry Analysis, Insights and Forecast, 2019-2031
- 9.1. Market Analysis, Insights and Forecast - by Type
- 9.1.1. Hardware
- 9.1.2. Software
- 9.1.3. Services
- 9.2. Market Analysis, Insights and Forecast - by End-user Verticals
- 9.2.1. Automotive
- 9.2.2. BFSI
- 9.2.3. Healthcare
- 9.2.4. Retail
- 9.2.5. Security
- 9.2.6. Other End-user Verticals
- 9.1. Market Analysis, Insights and Forecast - by Type
- 10. Latin America AI Image Recognition Industry Analysis, Insights and Forecast, 2019-2031
- 10.1. Market Analysis, Insights and Forecast - by Type
- 10.1.1. Hardware
- 10.1.2. Software
- 10.1.3. Services
- 10.2. Market Analysis, Insights and Forecast - by End-user Verticals
- 10.2.1. Automotive
- 10.2.2. BFSI
- 10.2.3. Healthcare
- 10.2.4. Retail
- 10.2.5. Security
- 10.2.6. Other End-user Verticals
- 10.1. Market Analysis, Insights and Forecast - by Type
- 11. Middle East and Africa AI Image Recognition Industry Analysis, Insights and Forecast, 2019-2031
- 11.1. Market Analysis, Insights and Forecast - by Type
- 11.1.1. Hardware
- 11.1.2. Software
- 11.1.3. Services
- 11.2. Market Analysis, Insights and Forecast - by End-user Verticals
- 11.2.1. Automotive
- 11.2.2. BFSI
- 11.2.3. Healthcare
- 11.2.4. Retail
- 11.2.5. Security
- 11.2.6. Other End-user Verticals
- 11.1. Market Analysis, Insights and Forecast - by Type
- 12. North America AI Image Recognition Industry Analysis, Insights and Forecast, 2019-2031
- 12.1. Market Analysis, Insights and Forecast - By Country/Sub-region
- 12.1.1 United States
- 12.1.2 Canada
- 12.1.3 Mexico
- 13. Europe AI Image Recognition Industry Analysis, Insights and Forecast, 2019-2031
- 13.1. Market Analysis, Insights and Forecast - By Country/Sub-region
- 13.1.1 Germany
- 13.1.2 United Kingdom
- 13.1.3 France
- 13.1.4 Spain
- 13.1.5 Italy
- 13.1.6 Spain
- 13.1.7 Belgium
- 13.1.8 Netherland
- 13.1.9 Nordics
- 13.1.10 Rest of Europe
- 14. Asia Pacific AI Image Recognition Industry Analysis, Insights and Forecast, 2019-2031
- 14.1. Market Analysis, Insights and Forecast - By Country/Sub-region
- 14.1.1 China
- 14.1.2 Japan
- 14.1.3 India
- 14.1.4 South Korea
- 14.1.5 Southeast Asia
- 14.1.6 Australia
- 14.1.7 Indonesia
- 14.1.8 Phillipes
- 14.1.9 Singapore
- 14.1.10 Thailandc
- 14.1.11 Rest of Asia Pacific
- 15. South America AI Image Recognition Industry Analysis, Insights and Forecast, 2019-2031
- 15.1. Market Analysis, Insights and Forecast - By Country/Sub-region
- 15.1.1 Brazil
- 15.1.2 Argentina
- 15.1.3 Peru
- 15.1.4 Chile
- 15.1.5 Colombia
- 15.1.6 Ecuador
- 15.1.7 Venezuela
- 15.1.8 Rest of South America
- 16. North America AI Image Recognition Industry Analysis, Insights and Forecast, 2019-2031
- 16.1. Market Analysis, Insights and Forecast - By Country/Sub-region
- 16.1.1 United States
- 16.1.2 Canada
- 16.1.3 Mexico
- 17. MEA AI Image Recognition Industry Analysis, Insights and Forecast, 2019-2031
- 17.1. Market Analysis, Insights and Forecast - By Country/Sub-region
- 17.1.1 United Arab Emirates
- 17.1.2 Saudi Arabia
- 17.1.3 South Africa
- 17.1.4 Rest of Middle East and Africa
- 18. Competitive Analysis
- 18.1. Global Market Share Analysis 2024
- 18.2. Company Profiles
- 18.2.1 Xilinx Inc (AMD Inc )
- 18.2.1.1. Overview
- 18.2.1.2. Products
- 18.2.1.3. SWOT Analysis
- 18.2.1.4. Recent Developments
- 18.2.1.5. Financials (Based on Availability)
- 18.2.2 Clarifai Inc
- 18.2.2.1. Overview
- 18.2.2.2. Products
- 18.2.2.3. SWOT Analysis
- 18.2.2.4. Recent Developments
- 18.2.2.5. Financials (Based on Availability)
- 18.2.3 IBM Corporation
- 18.2.3.1. Overview
- 18.2.3.2. Products
- 18.2.3.3. SWOT Analysis
- 18.2.3.4. Recent Developments
- 18.2.3.5. Financials (Based on Availability)
- 18.2.4 Samsung Electronics Co Ltd
- 18.2.4.1. Overview
- 18.2.4.2. Products
- 18.2.4.3. SWOT Analysis
- 18.2.4.4. Recent Developments
- 18.2.4.5. Financials (Based on Availability)
- 18.2.5 Google LLC (Alphabet Inc )
- 18.2.5.1. Overview
- 18.2.5.2. Products
- 18.2.5.3. SWOT Analysis
- 18.2.5.4. Recent Developments
- 18.2.5.5. Financials (Based on Availability)
- 18.2.6 Microsoft Corporation
- 18.2.6.1. Overview
- 18.2.6.2. Products
- 18.2.6.3. SWOT Analysis
- 18.2.6.4. Recent Developments
- 18.2.6.5. Financials (Based on Availability)
- 18.2.7 Qualcomm Incorporated
- 18.2.7.1. Overview
- 18.2.7.2. Products
- 18.2.7.3. SWOT Analysis
- 18.2.7.4. Recent Developments
- 18.2.7.5. Financials (Based on Availability)
- 18.2.8 Amazon Web Services Inc (Amazon Com Inc )
- 18.2.8.1. Overview
- 18.2.8.2. Products
- 18.2.8.3. SWOT Analysis
- 18.2.8.4. Recent Developments
- 18.2.8.5. Financials (Based on Availability)
- 18.2.9 Micron Technologies Inc
- 18.2.9.1. Overview
- 18.2.9.2. Products
- 18.2.9.3. SWOT Analysis
- 18.2.9.4. Recent Developments
- 18.2.9.5. Financials (Based on Availability)
- 18.2.10 Nvidia Corporation
- 18.2.10.1. Overview
- 18.2.10.2. Products
- 18.2.10.3. SWOT Analysis
- 18.2.10.4. Recent Developments
- 18.2.10.5. Financials (Based on Availability)
- 18.2.11 Intel Corporation
- 18.2.11.1. Overview
- 18.2.11.2. Products
- 18.2.11.3. SWOT Analysis
- 18.2.11.4. Recent Developments
- 18.2.11.5. Financials (Based on Availability)
- 18.2.1 Xilinx Inc (AMD Inc )
List of Figures
- Figure 1: Global AI Image Recognition Industry Revenue Breakdown (Million, %) by Region 2024 & 2032
- Figure 2: Global AI Image Recognition Industry Volume Breakdown (K Unit, %) by Region 2024 & 2032
- Figure 3: North America AI Image Recognition Industry Revenue (Million), by Country 2024 & 2032
- Figure 4: North America AI Image Recognition Industry Volume (K Unit), by Country 2024 & 2032
- Figure 5: North America AI Image Recognition Industry Revenue Share (%), by Country 2024 & 2032
- Figure 6: North America AI Image Recognition Industry Volume Share (%), by Country 2024 & 2032
- Figure 7: Europe AI Image Recognition Industry Revenue (Million), by Country 2024 & 2032
- Figure 8: Europe AI Image Recognition Industry Volume (K Unit), by Country 2024 & 2032
- Figure 9: Europe AI Image Recognition Industry Revenue Share (%), by Country 2024 & 2032
- Figure 10: Europe AI Image Recognition Industry Volume Share (%), by Country 2024 & 2032
- Figure 11: Asia Pacific AI Image Recognition Industry Revenue (Million), by Country 2024 & 2032
- Figure 12: Asia Pacific AI Image Recognition Industry Volume (K Unit), by Country 2024 & 2032
- Figure 13: Asia Pacific AI Image Recognition Industry Revenue Share (%), by Country 2024 & 2032
- Figure 14: Asia Pacific AI Image Recognition Industry Volume Share (%), by Country 2024 & 2032
- Figure 15: South America AI Image Recognition Industry Revenue (Million), by Country 2024 & 2032
- Figure 16: South America AI Image Recognition Industry Volume (K Unit), by Country 2024 & 2032
- Figure 17: South America AI Image Recognition Industry Revenue Share (%), by Country 2024 & 2032
- Figure 18: South America AI Image Recognition Industry Volume Share (%), by Country 2024 & 2032
- Figure 19: North America AI Image Recognition Industry Revenue (Million), by Country 2024 & 2032
- Figure 20: North America AI Image Recognition Industry Volume (K Unit), by Country 2024 & 2032
- Figure 21: North America AI Image Recognition Industry Revenue Share (%), by Country 2024 & 2032
- Figure 22: North America AI Image Recognition Industry Volume Share (%), by Country 2024 & 2032
- Figure 23: MEA AI Image Recognition Industry Revenue (Million), by Country 2024 & 2032
- Figure 24: MEA AI Image Recognition Industry Volume (K Unit), by Country 2024 & 2032
- Figure 25: MEA AI Image Recognition Industry Revenue Share (%), by Country 2024 & 2032
- Figure 26: MEA AI Image Recognition Industry Volume Share (%), by Country 2024 & 2032
- Figure 27: North America AI Image Recognition Industry Revenue (Million), by Type 2024 & 2032
- Figure 28: North America AI Image Recognition Industry Volume (K Unit), by Type 2024 & 2032
- Figure 29: North America AI Image Recognition Industry Revenue Share (%), by Type 2024 & 2032
- Figure 30: North America AI Image Recognition Industry Volume Share (%), by Type 2024 & 2032
- Figure 31: North America AI Image Recognition Industry Revenue (Million), by End-user Verticals 2024 & 2032
- Figure 32: North America AI Image Recognition Industry Volume (K Unit), by End-user Verticals 2024 & 2032
- Figure 33: North America AI Image Recognition Industry Revenue Share (%), by End-user Verticals 2024 & 2032
- Figure 34: North America AI Image Recognition Industry Volume Share (%), by End-user Verticals 2024 & 2032
- Figure 35: North America AI Image Recognition Industry Revenue (Million), by Country 2024 & 2032
- Figure 36: North America AI Image Recognition Industry Volume (K Unit), by Country 2024 & 2032
- Figure 37: North America AI Image Recognition Industry Revenue Share (%), by Country 2024 & 2032
- Figure 38: North America AI Image Recognition Industry Volume Share (%), by Country 2024 & 2032
- Figure 39: Europe AI Image Recognition Industry Revenue (Million), by Type 2024 & 2032
- Figure 40: Europe AI Image Recognition Industry Volume (K Unit), by Type 2024 & 2032
- Figure 41: Europe AI Image Recognition Industry Revenue Share (%), by Type 2024 & 2032
- Figure 42: Europe AI Image Recognition Industry Volume Share (%), by Type 2024 & 2032
- Figure 43: Europe AI Image Recognition Industry Revenue (Million), by End-user Verticals 2024 & 2032
- Figure 44: Europe AI Image Recognition Industry Volume (K Unit), by End-user Verticals 2024 & 2032
- Figure 45: Europe AI Image Recognition Industry Revenue Share (%), by End-user Verticals 2024 & 2032
- Figure 46: Europe AI Image Recognition Industry Volume Share (%), by End-user Verticals 2024 & 2032
- Figure 47: Europe AI Image Recognition Industry Revenue (Million), by Country 2024 & 2032
- Figure 48: Europe AI Image Recognition Industry Volume (K Unit), by Country 2024 & 2032
- Figure 49: Europe AI Image Recognition Industry Revenue Share (%), by Country 2024 & 2032
- Figure 50: Europe AI Image Recognition Industry Volume Share (%), by Country 2024 & 2032
- Figure 51: Asia AI Image Recognition Industry Revenue (Million), by Type 2024 & 2032
- Figure 52: Asia AI Image Recognition Industry Volume (K Unit), by Type 2024 & 2032
- Figure 53: Asia AI Image Recognition Industry Revenue Share (%), by Type 2024 & 2032
- Figure 54: Asia AI Image Recognition Industry Volume Share (%), by Type 2024 & 2032
- Figure 55: Asia AI Image Recognition Industry Revenue (Million), by End-user Verticals 2024 & 2032
- Figure 56: Asia AI Image Recognition Industry Volume (K Unit), by End-user Verticals 2024 & 2032
- Figure 57: Asia AI Image Recognition Industry Revenue Share (%), by End-user Verticals 2024 & 2032
- Figure 58: Asia AI Image Recognition Industry Volume Share (%), by End-user Verticals 2024 & 2032
- Figure 59: Asia AI Image Recognition Industry Revenue (Million), by Country 2024 & 2032
- Figure 60: Asia AI Image Recognition Industry Volume (K Unit), by Country 2024 & 2032
- Figure 61: Asia AI Image Recognition Industry Revenue Share (%), by Country 2024 & 2032
- Figure 62: Asia AI Image Recognition Industry Volume Share (%), by Country 2024 & 2032
- Figure 63: Australia and New Zealand AI Image Recognition Industry Revenue (Million), by Type 2024 & 2032
- Figure 64: Australia and New Zealand AI Image Recognition Industry Volume (K Unit), by Type 2024 & 2032
- Figure 65: Australia and New Zealand AI Image Recognition Industry Revenue Share (%), by Type 2024 & 2032
- Figure 66: Australia and New Zealand AI Image Recognition Industry Volume Share (%), by Type 2024 & 2032
- Figure 67: Australia and New Zealand AI Image Recognition Industry Revenue (Million), by End-user Verticals 2024 & 2032
- Figure 68: Australia and New Zealand AI Image Recognition Industry Volume (K Unit), by End-user Verticals 2024 & 2032
- Figure 69: Australia and New Zealand AI Image Recognition Industry Revenue Share (%), by End-user Verticals 2024 & 2032
- Figure 70: Australia and New Zealand AI Image Recognition Industry Volume Share (%), by End-user Verticals 2024 & 2032
- Figure 71: Australia and New Zealand AI Image Recognition Industry Revenue (Million), by Country 2024 & 2032
- Figure 72: Australia and New Zealand AI Image Recognition Industry Volume (K Unit), by Country 2024 & 2032
- Figure 73: Australia and New Zealand AI Image Recognition Industry Revenue Share (%), by Country 2024 & 2032
- Figure 74: Australia and New Zealand AI Image Recognition Industry Volume Share (%), by Country 2024 & 2032
- Figure 75: Latin America AI Image Recognition Industry Revenue (Million), by Type 2024 & 2032
- Figure 76: Latin America AI Image Recognition Industry Volume (K Unit), by Type 2024 & 2032
- Figure 77: Latin America AI Image Recognition Industry Revenue Share (%), by Type 2024 & 2032
- Figure 78: Latin America AI Image Recognition Industry Volume Share (%), by Type 2024 & 2032
- Figure 79: Latin America AI Image Recognition Industry Revenue (Million), by End-user Verticals 2024 & 2032
- Figure 80: Latin America AI Image Recognition Industry Volume (K Unit), by End-user Verticals 2024 & 2032
- Figure 81: Latin America AI Image Recognition Industry Revenue Share (%), by End-user Verticals 2024 & 2032
- Figure 82: Latin America AI Image Recognition Industry Volume Share (%), by End-user Verticals 2024 & 2032
- Figure 83: Latin America AI Image Recognition Industry Revenue (Million), by Country 2024 & 2032
- Figure 84: Latin America AI Image Recognition Industry Volume (K Unit), by Country 2024 & 2032
- Figure 85: Latin America AI Image Recognition Industry Revenue Share (%), by Country 2024 & 2032
- Figure 86: Latin America AI Image Recognition Industry Volume Share (%), by Country 2024 & 2032
- Figure 87: Middle East and Africa AI Image Recognition Industry Revenue (Million), by Type 2024 & 2032
- Figure 88: Middle East and Africa AI Image Recognition Industry Volume (K Unit), by Type 2024 & 2032
- Figure 89: Middle East and Africa AI Image Recognition Industry Revenue Share (%), by Type 2024 & 2032
- Figure 90: Middle East and Africa AI Image Recognition Industry Volume Share (%), by Type 2024 & 2032
- Figure 91: Middle East and Africa AI Image Recognition Industry Revenue (Million), by End-user Verticals 2024 & 2032
- Figure 92: Middle East and Africa AI Image Recognition Industry Volume (K Unit), by End-user Verticals 2024 & 2032
- Figure 93: Middle East and Africa AI Image Recognition Industry Revenue Share (%), by End-user Verticals 2024 & 2032
- Figure 94: Middle East and Africa AI Image Recognition Industry Volume Share (%), by End-user Verticals 2024 & 2032
- Figure 95: Middle East and Africa AI Image Recognition Industry Revenue (Million), by Country 2024 & 2032
- Figure 96: Middle East and Africa AI Image Recognition Industry Volume (K Unit), by Country 2024 & 2032
- Figure 97: Middle East and Africa AI Image Recognition Industry Revenue Share (%), by Country 2024 & 2032
- Figure 98: Middle East and Africa AI Image Recognition Industry Volume Share (%), by Country 2024 & 2032
List of Tables
- Table 1: Global AI Image Recognition Industry Revenue Million Forecast, by Region 2019 & 2032
- Table 2: Global AI Image Recognition Industry Volume K Unit Forecast, by Region 2019 & 2032
- Table 3: Global AI Image Recognition Industry Revenue Million Forecast, by Type 2019 & 2032
- Table 4: Global AI Image Recognition Industry Volume K Unit Forecast, by Type 2019 & 2032
- Table 5: Global AI Image Recognition Industry Revenue Million Forecast, by End-user Verticals 2019 & 2032
- Table 6: Global AI Image Recognition Industry Volume K Unit Forecast, by End-user Verticals 2019 & 2032
- Table 7: Global AI Image Recognition Industry Revenue Million Forecast, by Region 2019 & 2032
- Table 8: Global AI Image Recognition Industry Volume K Unit Forecast, by Region 2019 & 2032
- Table 9: Global AI Image Recognition Industry Revenue Million Forecast, by Country 2019 & 2032
- Table 10: Global AI Image Recognition Industry Volume K Unit Forecast, by Country 2019 & 2032
- Table 11: United States AI Image Recognition Industry Revenue (Million) Forecast, by Application 2019 & 2032
- Table 12: United States AI Image Recognition Industry Volume (K Unit) Forecast, by Application 2019 & 2032
- Table 13: Canada AI Image Recognition Industry Revenue (Million) Forecast, by Application 2019 & 2032
- Table 14: Canada AI Image Recognition Industry Volume (K Unit) Forecast, by Application 2019 & 2032
- Table 15: Mexico AI Image Recognition Industry Revenue (Million) Forecast, by Application 2019 & 2032
- Table 16: Mexico AI Image Recognition Industry Volume (K Unit) Forecast, by Application 2019 & 2032
- Table 17: Global AI Image Recognition Industry Revenue Million Forecast, by Country 2019 & 2032
- Table 18: Global AI Image Recognition Industry Volume K Unit Forecast, by Country 2019 & 2032
- Table 19: Germany AI Image Recognition Industry Revenue (Million) Forecast, by Application 2019 & 2032
- Table 20: Germany AI Image Recognition Industry Volume (K Unit) Forecast, by Application 2019 & 2032
- Table 21: United Kingdom AI Image Recognition Industry Revenue (Million) Forecast, by Application 2019 & 2032
- Table 22: United Kingdom AI Image Recognition Industry Volume (K Unit) Forecast, by Application 2019 & 2032
- Table 23: France AI Image Recognition Industry Revenue (Million) Forecast, by Application 2019 & 2032
- Table 24: France AI Image Recognition Industry Volume (K Unit) Forecast, by Application 2019 & 2032
- Table 25: Spain AI Image Recognition Industry Revenue (Million) Forecast, by Application 2019 & 2032
- Table 26: Spain AI Image Recognition Industry Volume (K Unit) Forecast, by Application 2019 & 2032
- Table 27: Italy AI Image Recognition Industry Revenue (Million) Forecast, by Application 2019 & 2032
- Table 28: Italy AI Image Recognition Industry Volume (K Unit) Forecast, by Application 2019 & 2032
- Table 29: Spain AI Image Recognition Industry Revenue (Million) Forecast, by Application 2019 & 2032
- Table 30: Spain AI Image Recognition Industry Volume (K Unit) Forecast, by Application 2019 & 2032
- Table 31: Belgium AI Image Recognition Industry Revenue (Million) Forecast, by Application 2019 & 2032
- Table 32: Belgium AI Image Recognition Industry Volume (K Unit) Forecast, by Application 2019 & 2032
- Table 33: Netherland AI Image Recognition Industry Revenue (Million) Forecast, by Application 2019 & 2032
- Table 34: Netherland AI Image Recognition Industry Volume (K Unit) Forecast, by Application 2019 & 2032
- Table 35: Nordics AI Image Recognition Industry Revenue (Million) Forecast, by Application 2019 & 2032
- Table 36: Nordics AI Image Recognition Industry Volume (K Unit) Forecast, by Application 2019 & 2032
- Table 37: Rest of Europe AI Image Recognition Industry Revenue (Million) Forecast, by Application 2019 & 2032
- Table 38: Rest of Europe AI Image Recognition Industry Volume (K Unit) Forecast, by Application 2019 & 2032
- Table 39: Global AI Image Recognition Industry Revenue Million Forecast, by Country 2019 & 2032
- Table 40: Global AI Image Recognition Industry Volume K Unit Forecast, by Country 2019 & 2032
- Table 41: China AI Image Recognition Industry Revenue (Million) Forecast, by Application 2019 & 2032
- Table 42: China AI Image Recognition Industry Volume (K Unit) Forecast, by Application 2019 & 2032
- Table 43: Japan AI Image Recognition Industry Revenue (Million) Forecast, by Application 2019 & 2032
- Table 44: Japan AI Image Recognition Industry Volume (K Unit) Forecast, by Application 2019 & 2032
- Table 45: India AI Image Recognition Industry Revenue (Million) Forecast, by Application 2019 & 2032
- Table 46: India AI Image Recognition Industry Volume (K Unit) Forecast, by Application 2019 & 2032
- Table 47: South Korea AI Image Recognition Industry Revenue (Million) Forecast, by Application 2019 & 2032
- Table 48: South Korea AI Image Recognition Industry Volume (K Unit) Forecast, by Application 2019 & 2032
- Table 49: Southeast Asia AI Image Recognition Industry Revenue (Million) Forecast, by Application 2019 & 2032
- Table 50: Southeast Asia AI Image Recognition Industry Volume (K Unit) Forecast, by Application 2019 & 2032
- Table 51: Australia AI Image Recognition Industry Revenue (Million) Forecast, by Application 2019 & 2032
- Table 52: Australia AI Image Recognition Industry Volume (K Unit) Forecast, by Application 2019 & 2032
- Table 53: Indonesia AI Image Recognition Industry Revenue (Million) Forecast, by Application 2019 & 2032
- Table 54: Indonesia AI Image Recognition Industry Volume (K Unit) Forecast, by Application 2019 & 2032
- Table 55: Phillipes AI Image Recognition Industry Revenue (Million) Forecast, by Application 2019 & 2032
- Table 56: Phillipes AI Image Recognition Industry Volume (K Unit) Forecast, by Application 2019 & 2032
- Table 57: Singapore AI Image Recognition Industry Revenue (Million) Forecast, by Application 2019 & 2032
- Table 58: Singapore AI Image Recognition Industry Volume (K Unit) Forecast, by Application 2019 & 2032
- Table 59: Thailandc AI Image Recognition Industry Revenue (Million) Forecast, by Application 2019 & 2032
- Table 60: Thailandc AI Image Recognition Industry Volume (K Unit) Forecast, by Application 2019 & 2032
- Table 61: Rest of Asia Pacific AI Image Recognition Industry Revenue (Million) Forecast, by Application 2019 & 2032
- Table 62: Rest of Asia Pacific AI Image Recognition Industry Volume (K Unit) Forecast, by Application 2019 & 2032
- Table 63: Global AI Image Recognition Industry Revenue Million Forecast, by Country 2019 & 2032
- Table 64: Global AI Image Recognition Industry Volume K Unit Forecast, by Country 2019 & 2032
- Table 65: Brazil AI Image Recognition Industry Revenue (Million) Forecast, by Application 2019 & 2032
- Table 66: Brazil AI Image Recognition Industry Volume (K Unit) Forecast, by Application 2019 & 2032
- Table 67: Argentina AI Image Recognition Industry Revenue (Million) Forecast, by Application 2019 & 2032
- Table 68: Argentina AI Image Recognition Industry Volume (K Unit) Forecast, by Application 2019 & 2032
- Table 69: Peru AI Image Recognition Industry Revenue (Million) Forecast, by Application 2019 & 2032
- Table 70: Peru AI Image Recognition Industry Volume (K Unit) Forecast, by Application 2019 & 2032
- Table 71: Chile AI Image Recognition Industry Revenue (Million) Forecast, by Application 2019 & 2032
- Table 72: Chile AI Image Recognition Industry Volume (K Unit) Forecast, by Application 2019 & 2032
- Table 73: Colombia AI Image Recognition Industry Revenue (Million) Forecast, by Application 2019 & 2032
- Table 74: Colombia AI Image Recognition Industry Volume (K Unit) Forecast, by Application 2019 & 2032
- Table 75: Ecuador AI Image Recognition Industry Revenue (Million) Forecast, by Application 2019 & 2032
- Table 76: Ecuador AI Image Recognition Industry Volume (K Unit) Forecast, by Application 2019 & 2032
- Table 77: Venezuela AI Image Recognition Industry Revenue (Million) Forecast, by Application 2019 & 2032
- Table 78: Venezuela AI Image Recognition Industry Volume (K Unit) Forecast, by Application 2019 & 2032
- Table 79: Rest of South America AI Image Recognition Industry Revenue (Million) Forecast, by Application 2019 & 2032
- Table 80: Rest of South America AI Image Recognition Industry Volume (K Unit) Forecast, by Application 2019 & 2032
- Table 81: Global AI Image Recognition Industry Revenue Million Forecast, by Country 2019 & 2032
- Table 82: Global AI Image Recognition Industry Volume K Unit Forecast, by Country 2019 & 2032
- Table 83: United States AI Image Recognition Industry Revenue (Million) Forecast, by Application 2019 & 2032
- Table 84: United States AI Image Recognition Industry Volume (K Unit) Forecast, by Application 2019 & 2032
- Table 85: Canada AI Image Recognition Industry Revenue (Million) Forecast, by Application 2019 & 2032
- Table 86: Canada AI Image Recognition Industry Volume (K Unit) Forecast, by Application 2019 & 2032
- Table 87: Mexico AI Image Recognition Industry Revenue (Million) Forecast, by Application 2019 & 2032
- Table 88: Mexico AI Image Recognition Industry Volume (K Unit) Forecast, by Application 2019 & 2032
- Table 89: Global AI Image Recognition Industry Revenue Million Forecast, by Country 2019 & 2032
- Table 90: Global AI Image Recognition Industry Volume K Unit Forecast, by Country 2019 & 2032
- Table 91: United Arab Emirates AI Image Recognition Industry Revenue (Million) Forecast, by Application 2019 & 2032
- Table 92: United Arab Emirates AI Image Recognition Industry Volume (K Unit) Forecast, by Application 2019 & 2032
- Table 93: Saudi Arabia AI Image Recognition Industry Revenue (Million) Forecast, by Application 2019 & 2032
- Table 94: Saudi Arabia AI Image Recognition Industry Volume (K Unit) Forecast, by Application 2019 & 2032
- Table 95: South Africa AI Image Recognition Industry Revenue (Million) Forecast, by Application 2019 & 2032
- Table 96: South Africa AI Image Recognition Industry Volume (K Unit) Forecast, by Application 2019 & 2032
- Table 97: Rest of Middle East and Africa AI Image Recognition Industry Revenue (Million) Forecast, by Application 2019 & 2032
- Table 98: Rest of Middle East and Africa AI Image Recognition Industry Volume (K Unit) Forecast, by Application 2019 & 2032
- Table 99: Global AI Image Recognition Industry Revenue Million Forecast, by Type 2019 & 2032
- Table 100: Global AI Image Recognition Industry Volume K Unit Forecast, by Type 2019 & 2032
- Table 101: Global AI Image Recognition Industry Revenue Million Forecast, by End-user Verticals 2019 & 2032
- Table 102: Global AI Image Recognition Industry Volume K Unit Forecast, by End-user Verticals 2019 & 2032
- Table 103: Global AI Image Recognition Industry Revenue Million Forecast, by Country 2019 & 2032
- Table 104: Global AI Image Recognition Industry Volume K Unit Forecast, by Country 2019 & 2032
- Table 105: Global AI Image Recognition Industry Revenue Million Forecast, by Type 2019 & 2032
- Table 106: Global AI Image Recognition Industry Volume K Unit Forecast, by Type 2019 & 2032
- Table 107: Global AI Image Recognition Industry Revenue Million Forecast, by End-user Verticals 2019 & 2032
- Table 108: Global AI Image Recognition Industry Volume K Unit Forecast, by End-user Verticals 2019 & 2032
- Table 109: Global AI Image Recognition Industry Revenue Million Forecast, by Country 2019 & 2032
- Table 110: Global AI Image Recognition Industry Volume K Unit Forecast, by Country 2019 & 2032
- Table 111: Global AI Image Recognition Industry Revenue Million Forecast, by Type 2019 & 2032
- Table 112: Global AI Image Recognition Industry Volume K Unit Forecast, by Type 2019 & 2032
- Table 113: Global AI Image Recognition Industry Revenue Million Forecast, by End-user Verticals 2019 & 2032
- Table 114: Global AI Image Recognition Industry Volume K Unit Forecast, by End-user Verticals 2019 & 2032
- Table 115: Global AI Image Recognition Industry Revenue Million Forecast, by Country 2019 & 2032
- Table 116: Global AI Image Recognition Industry Volume K Unit Forecast, by Country 2019 & 2032
- Table 117: Global AI Image Recognition Industry Revenue Million Forecast, by Type 2019 & 2032
- Table 118: Global AI Image Recognition Industry Volume K Unit Forecast, by Type 2019 & 2032
- Table 119: Global AI Image Recognition Industry Revenue Million Forecast, by End-user Verticals 2019 & 2032
- Table 120: Global AI Image Recognition Industry Volume K Unit Forecast, by End-user Verticals 2019 & 2032
- Table 121: Global AI Image Recognition Industry Revenue Million Forecast, by Country 2019 & 2032
- Table 122: Global AI Image Recognition Industry Volume K Unit Forecast, by Country 2019 & 2032
- Table 123: Global AI Image Recognition Industry Revenue Million Forecast, by Type 2019 & 2032
- Table 124: Global AI Image Recognition Industry Volume K Unit Forecast, by Type 2019 & 2032
- Table 125: Global AI Image Recognition Industry Revenue Million Forecast, by End-user Verticals 2019 & 2032
- Table 126: Global AI Image Recognition Industry Volume K Unit Forecast, by End-user Verticals 2019 & 2032
- Table 127: Global AI Image Recognition Industry Revenue Million Forecast, by Country 2019 & 2032
- Table 128: Global AI Image Recognition Industry Volume K Unit Forecast, by Country 2019 & 2032
- Table 129: Global AI Image Recognition Industry Revenue Million Forecast, by Type 2019 & 2032
- Table 130: Global AI Image Recognition Industry Volume K Unit Forecast, by Type 2019 & 2032
- Table 131: Global AI Image Recognition Industry Revenue Million Forecast, by End-user Verticals 2019 & 2032
- Table 132: Global AI Image Recognition Industry Volume K Unit Forecast, by End-user Verticals 2019 & 2032
- Table 133: Global AI Image Recognition Industry Revenue Million Forecast, by Country 2019 & 2032
- Table 134: Global AI Image Recognition Industry Volume K Unit Forecast, by Country 2019 & 2032
Frequently Asked Questions
1. What is the projected Compound Annual Growth Rate (CAGR) of the AI Image Recognition Industry?
The projected CAGR is approximately 11.76%.
2. Which companies are prominent players in the AI Image Recognition Industry?
Key companies in the market include Xilinx Inc (AMD Inc ), Clarifai Inc, IBM Corporation, Samsung Electronics Co Ltd, Google LLC (Alphabet Inc ), Microsoft Corporation, Qualcomm Incorporated, Amazon Web Services Inc (Amazon Com Inc ), Micron Technologies Inc, Nvidia Corporation, Intel Corporation.
3. What are the main segments of the AI Image Recognition Industry?
The market segments include Type, End-user Verticals.
4. Can you provide details about the market size?
The market size is estimated to be USD 2.55 Million as of 2022.
5. What are some drivers contributing to market growth?
Growing AI Adoption; Increasing Use of Big Data Analytics; Declining Costs of Hardware.
6. What are the notable trends driving market growth?
Healthcare Sector is Expected to Witness Significant Growth.
7. Are there any restraints impacting market growth?
Lack of Technical Expertise.
8. Can you provide examples of recent developments in the market?
September 2022: The International Society of Ultrasound in Obstetrics and Gynecology (ISUOG) World Congress 2022 was to take place in London, United Kingdom, from September 16 to September 18, and Samsung Medison, a leading manufacturer of medical equipment and a subsidiary of Samsung Electronics, was to attend the function to demonstrate its high-end HERA W10 obstetric and gynecological ultrasound equipment. The HERA W10 system has Intelligent Assist (AI diagnostic solutions), V8, and V7. These two top-of-the-line ultrasound systems can be employed with premium AI diagnostic solutions in various medical specialties.
9. What pricing options are available for accessing the report?
Pricing options include single-user, multi-user, and enterprise licenses priced at USD 4750, USD 5250, and USD 8750 respectively.
10. Is the market size provided in terms of value or volume?
The market size is provided in terms of value, measured in Million and volume, measured in K Unit.
11. Are there any specific market keywords associated with the report?
Yes, the market keyword associated with the report is "AI Image Recognition Industry," which aids in identifying and referencing the specific market segment covered.
12. How do I determine which pricing option suits my needs best?
The pricing options vary based on user requirements and access needs. Individual users may opt for single-user licenses, while businesses requiring broader access may choose multi-user or enterprise licenses for cost-effective access to the report.
13. Are there any additional resources or data provided in the AI Image Recognition Industry report?
While the report offers comprehensive insights, it's advisable to review the specific contents or supplementary materials provided to ascertain if additional resources or data are available.
14. How can I stay updated on further developments or reports in the AI Image Recognition Industry?
To stay informed about further developments, trends, and reports in the AI Image Recognition Industry, consider subscribing to industry newsletters, following relevant companies and organizations, or regularly checking reputable industry news sources and publications.
Methodology
Step 1 - Identification of Relevant Samples Size from Population Database


Step 2 - Approaches for Defining Global Market Size (Value, Volume* & Price*)

Note*: In applicable scenarios
Step 3 - Data Sources
Primary Research
- Web Analytics
- Survey Reports
- Research Institute
- Latest Research Reports
- Opinion Leaders
Secondary Research
- Annual Reports
- White Paper
- Latest Press Release
- Industry Association
- Paid Database
- Investor Presentations

Step 4 - Data Triangulation
Involves using different sources of information in order to increase the validity of a study
These sources are likely to be stakeholders in a program - participants, other researchers, program staff, other community members, and so on.
Then we put all data in single framework & apply various statistical tools to find out the dynamic on the market.
During the analysis stage, feedback from the stakeholder groups would be compared to determine areas of agreement as well as areas of divergence
