

Key Insights
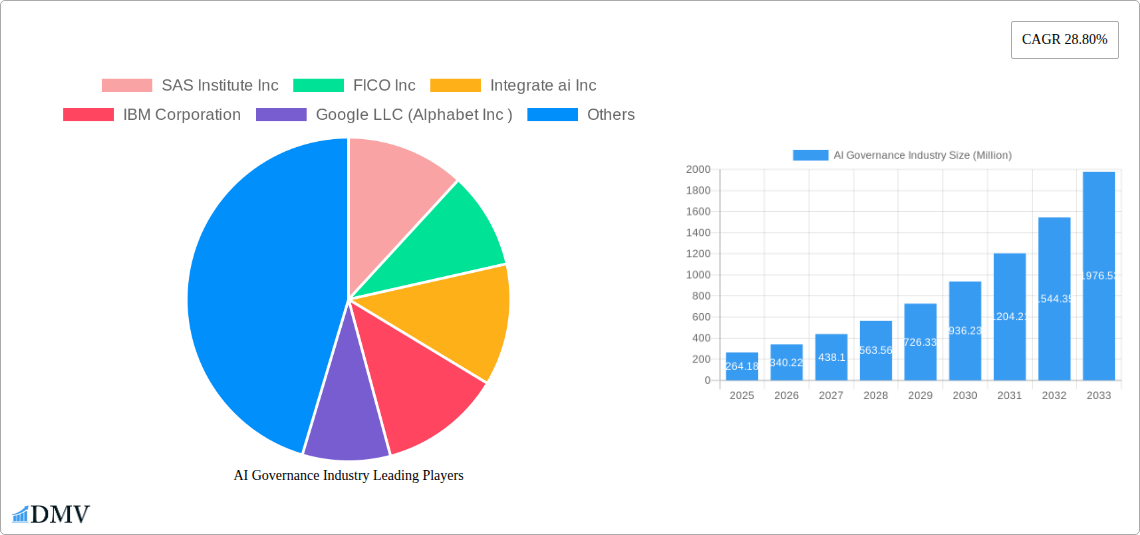
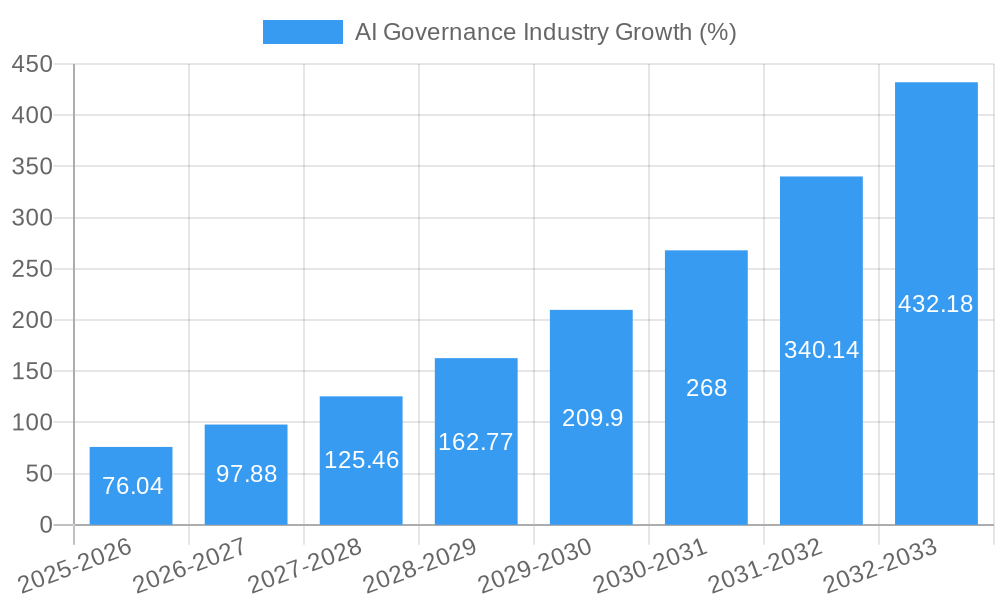
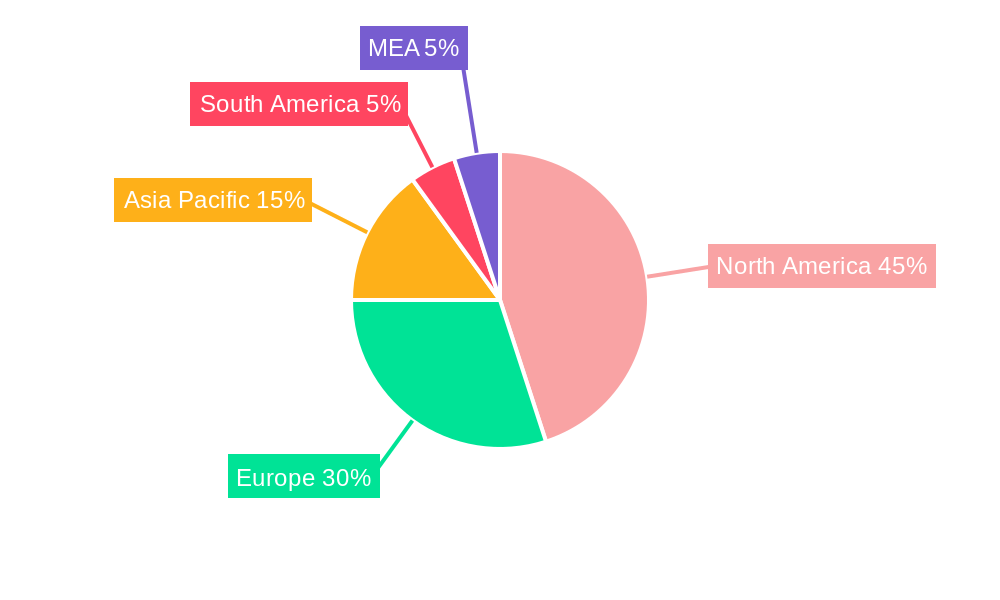
The AI governance market, currently valued at $264.18 million in 2025, is projected to experience robust growth, driven by increasing concerns around AI bias, ethical considerations, and regulatory compliance. The compound annual growth rate (CAGR) of 28.80% from 2025 to 2033 indicates a significant expansion of this market. Key drivers include the rising adoption of AI across various sectors (healthcare, finance, automotive) necessitating robust governance frameworks. The increasing complexity of AI systems and their potential for unintended consequences further fuel the demand for solutions ensuring responsible AI development and deployment. Market trends show a shift towards cloud-based AI governance solutions due to their scalability and cost-effectiveness. However, challenges like the lack of standardized AI governance frameworks and the high cost of implementation pose restraints to market growth. The market is segmented by component (solution and service), deployment (on-premise and cloud), and end-user vertical (healthcare, government & defense, automotive, retail, BFSI, and others). Leading companies like SAS Institute, FICO, IBM, Google, and Salesforce are actively shaping this evolving landscape through innovative solutions and strategic partnerships. The North American market currently holds a significant share, with Europe and Asia-Pacific expected to witness substantial growth in the coming years. The continued maturation of AI technologies and growing awareness of potential risks will further propel the expansion of the AI governance market.
The projected market size for 2033, based on the provided CAGR of 28.80%, suggests a substantial increase. The growth will be fuelled by factors such as increasing government regulations, heightened awareness of AI ethical implications, and advancements in AI auditing and monitoring technologies. The diverse range of end-user verticals adopting AI necessitates customized governance solutions, creating further opportunities for market expansion. Competition among established technology providers and emerging startups is intensifying, leading to innovations in AI risk management and compliance solutions. The market’s future success will depend on the ability of vendors to provide scalable, adaptable, and user-friendly solutions that cater to the specific needs of various industries and regulatory landscapes. Ongoing research and development in AI explainability and transparency will be crucial in fostering trust and driving wider adoption of AI governance practices.
AI Governance Industry Market Report: 2019-2033
This comprehensive report provides a detailed analysis of the AI Governance industry, projecting a market value of $XX Million by 2033. The study covers the period from 2019 to 2033, with 2025 serving as both the base and estimated year. This in-depth analysis examines market composition, technological advancements, leading players, and future opportunities, providing crucial insights for stakeholders across the AI ecosystem.
AI Governance Industry Market Composition & Trends
The AI Governance market, valued at $XX Million in 2024, is experiencing robust growth driven by increasing concerns around AI ethics, bias mitigation, and regulatory compliance. Market concentration is moderate, with key players such as SAS Institute Inc, FICO Inc, Integrate.ai Inc, IBM Corporation, Google LLC (Alphabet Inc), Salesforce.com Inc, Microsoft Corporation, Pymetrics Inc, Facebook Inc (Meta Platforms Inc), H2O.ai Inc, and SAP SE holding significant market share. However, the market is also characterized by a high level of innovation from smaller players and startups.
- Market Share Distribution (2024): The top 5 players hold approximately XX% of the market share.
- Innovation Catalysts: Increasing demand for explainable AI (XAI), growing concerns over AI bias, and the rise of AI-specific regulations are driving innovation.
- Regulatory Landscape: The evolving regulatory landscape, particularly in regions like Europe and North America, significantly impacts market dynamics. Stringent data privacy regulations and increasing scrutiny of algorithmic fairness are shaping industry practices.
- Substitute Products: While direct substitutes are limited, alternative approaches to risk management and compliance may indirectly impact market growth.
- End-User Profiles: The key end-user verticals include Healthcare, Government & Defense, Automotive, Retail, BFSI, and other sectors adopting AI technologies.
- M&A Activities: The AI Governance space has witnessed several M&A activities in recent years, with deal values exceeding $XX Million cumulatively from 2019-2024. These activities primarily focus on expanding technological capabilities and market reach.
AI Governance Industry Industry Evolution
The AI Governance industry has witnessed exponential growth since 2019, fueled by several key factors. Technological advancements, such as the development of more robust AI auditing tools and improved bias detection algorithms, have enabled better governance frameworks. The increasing adoption of AI across various industries has created a corresponding demand for effective governance solutions. Shifting consumer demands for transparency and accountability in AI systems have further accelerated market growth. The compound annual growth rate (CAGR) for the historical period (2019-2024) is estimated at XX%, while the forecast period (2025-2033) projects a CAGR of XX%. This signifies a substantial expansion in the market size, reaching $XX Million by 2033. Adoption rates have increased significantly, with a projected XX% increase in AI governance solution implementations across various industries in the forecast period.
Leading Regions, Countries, or Segments in AI Governance Industry
North America currently holds the largest market share in the AI Governance industry, driven by robust technological advancements, high AI adoption rates, and stringent data privacy regulations. Europe follows closely, demonstrating strong growth potential due to its proactive regulatory framework (e.g., GDPR) and increasing focus on ethical AI.
- By Component: The Solution segment dominates the market, with a XX% share in 2024, reflecting a higher demand for comprehensive AI governance platforms compared to services.
- By Deployment: Cloud-based deployments are witnessing faster adoption due to scalability and cost-effectiveness, making them the leading deployment model.
- By End-user Vertical: The BFSI and Healthcare sectors demonstrate the highest adoption rates driven by rigorous regulatory compliance and the sensitive nature of the data handled.
- Key Drivers for North America: High investment in R&D, strong government support for AI initiatives, and early adoption of AI technologies.
- Key Drivers for Europe: Strict data privacy regulations (GDPR), increasing focus on ethical AI, and substantial government funding for research.
- Key Drivers for BFSI: Stringent regulatory compliance requirements, the need to manage sensitive customer data, and opportunities for improved risk management.
- Key Drivers for Healthcare: Growing demand for patient data privacy and security, regulatory compliance, and increasing adoption of AI in clinical decision support systems.
AI Governance Industry Product Innovations
Recent innovations in AI governance include advanced AI bias detection tools, automated compliance monitoring systems, and explainable AI (XAI) solutions providing greater transparency and auditability. These advancements are addressing key challenges related to fairness, accountability, and transparency in AI systems, enhancing their performance and trustworthiness. Unique selling propositions include real-time monitoring capabilities, customizable dashboards, and integration with existing IT infrastructure.
Propelling Factors for AI Governance Industry Growth
The AI Governance market is propelled by several factors: increasing regulatory scrutiny of AI systems, escalating concerns regarding AI bias and ethical implications, a growing demand for transparency in AI decision-making, and the increasing adoption of AI across various sectors. Technological advancements in AI auditing and bias detection technologies further fuel market expansion. The economic incentives for improved risk management and compliance through robust AI governance solutions also play a significant role.
Obstacles in the AI Governance Industry Market
Despite significant growth potential, challenges exist. Regulatory ambiguities and inconsistencies across different jurisdictions pose a hurdle, creating compliance complexities for organizations. Supply chain disruptions can impact the availability of specialized hardware and software components. Intense competition from both established players and new entrants also creates pressure on pricing and profitability. These factors cumulatively reduce market growth by an estimated XX% annually.
Future Opportunities in AI Governance Industry
Future opportunities lie in the expansion of AI governance solutions into new and emerging AI applications, such as autonomous vehicles, robotics, and the metaverse. The development of more sophisticated AI auditing techniques and the integration of AI governance solutions with other emerging technologies, such as blockchain, present significant growth potential. Increased focus on explainable AI (XAI) will further drive market expansion.
Major Players in the AI Governance Industry Ecosystem
- SAS Institute Inc
- FICO Inc
- Integrate ai Inc
- IBM Corporation
- Google LLC (Alphabet Inc)
- Salesforce com Inc
- Microsoft Corporation
- Pymetrics Inc
- Facebook Inc (Meta Platforms Inc)
- H2O ai Inc
- SAP SE
Key Developments in AI Governance Industry Industry
- February 2022: Meta AI open-sourced data2vec, a unified framework for self-supervised deep learning, impacting the development of more robust and ethical AI models.
- February 2022: Virtana launched a hybrid cloud management solution leveraging AI/ML for improved observability, indirectly impacting the need for AI governance in hybrid cloud environments.
Strategic AI Governance Industry Market Forecast
The AI Governance market is poised for sustained growth driven by technological advancements, increased regulatory oversight, and the expanding adoption of AI across diverse sectors. The market's potential is substantial, with ongoing innovation and the emergence of new applications promising a robust and expanding market in the years to come. Continued investment in R&D and the development of user-friendly, scalable solutions will be critical for sustained market growth.
AI Governance Industry Segmentation
-
1. Component
- 1.1. Solution
- 1.2. Service
-
2. Deployment
- 2.1. On-Premise
- 2.2. Cloud
-
3. End-user Vertical
- 3.1. Healthcare
- 3.2. Government and Defense
- 3.3. Automotive
- 3.4. Retail
- 3.5. BFSI
- 3.6. Other End-user Verticals
AI Governance Industry Segmentation By Geography
-
1. North America
- 1.1. United States
- 1.2. Canada
-
2. Europe
- 2.1. United Kingdom
- 2.2. Germany
- 2.3. France
-
3. Asia
- 3.1. China
- 3.2. India
- 3.3. Japan
- 4. Australia and New Zealand
- 5. Latin America
- 6. Middle East and Africa
AI Governance Industry REPORT HIGHLIGHTS
| Aspects | Details |
|---|---|
| Study Period | 2019-2033 |
| Base Year | 2024 |
| Estimated Year | 2025 |
| Forecast Period | 2025-2033 |
| Historical Period | 2019-2024 |
| Growth Rate | CAGR of 28.80% from 2019-2033 |
| Segmentation |
|
Table of Contents
- 1. Introduction
- 1.1. Research Scope
- 1.2. Market Segmentation
- 1.3. Research Methodology
- 1.4. Definitions and Assumptions
- 2. Executive Summary
- 2.1. Introduction
- 3. Market Dynamics
- 3.1. Introduction
- 3.2. Market Drivers
- 3.2.1. Growing Demand for Transparency in AI Decision Making; Expanding Government Initiatives to Leverage the AI Technology
- 3.3. Market Restrains
- 3.3.1. Inadequate AI Expertise and Skills can Act as a Restraint
- 3.4. Market Trends
- 3.4.1. Growing use of AI in Retail is Expected to Open Up New Avenues for Market Growth
- 4. Market Factor Analysis
- 4.1. Porters Five Forces
- 4.2. Supply/Value Chain
- 4.3. PESTEL analysis
- 4.4. Market Entropy
- 4.5. Patent/Trademark Analysis
- 5. Global AI Governance Industry Analysis, Insights and Forecast, 2019-2031
- 5.1. Market Analysis, Insights and Forecast - by Component
- 5.1.1. Solution
- 5.1.2. Service
- 5.2. Market Analysis, Insights and Forecast - by Deployment
- 5.2.1. On-Premise
- 5.2.2. Cloud
- 5.3. Market Analysis, Insights and Forecast - by End-user Vertical
- 5.3.1. Healthcare
- 5.3.2. Government and Defense
- 5.3.3. Automotive
- 5.3.4. Retail
- 5.3.5. BFSI
- 5.3.6. Other End-user Verticals
- 5.4. Market Analysis, Insights and Forecast - by Region
- 5.4.1. North America
- 5.4.2. Europe
- 5.4.3. Asia
- 5.4.4. Australia and New Zealand
- 5.4.5. Latin America
- 5.4.6. Middle East and Africa
- 5.1. Market Analysis, Insights and Forecast - by Component
- 6. North America AI Governance Industry Analysis, Insights and Forecast, 2019-2031
- 6.1. Market Analysis, Insights and Forecast - by Component
- 6.1.1. Solution
- 6.1.2. Service
- 6.2. Market Analysis, Insights and Forecast - by Deployment
- 6.2.1. On-Premise
- 6.2.2. Cloud
- 6.3. Market Analysis, Insights and Forecast - by End-user Vertical
- 6.3.1. Healthcare
- 6.3.2. Government and Defense
- 6.3.3. Automotive
- 6.3.4. Retail
- 6.3.5. BFSI
- 6.3.6. Other End-user Verticals
- 6.1. Market Analysis, Insights and Forecast - by Component
- 7. Europe AI Governance Industry Analysis, Insights and Forecast, 2019-2031
- 7.1. Market Analysis, Insights and Forecast - by Component
- 7.1.1. Solution
- 7.1.2. Service
- 7.2. Market Analysis, Insights and Forecast - by Deployment
- 7.2.1. On-Premise
- 7.2.2. Cloud
- 7.3. Market Analysis, Insights and Forecast - by End-user Vertical
- 7.3.1. Healthcare
- 7.3.2. Government and Defense
- 7.3.3. Automotive
- 7.3.4. Retail
- 7.3.5. BFSI
- 7.3.6. Other End-user Verticals
- 7.1. Market Analysis, Insights and Forecast - by Component
- 8. Asia AI Governance Industry Analysis, Insights and Forecast, 2019-2031
- 8.1. Market Analysis, Insights and Forecast - by Component
- 8.1.1. Solution
- 8.1.2. Service
- 8.2. Market Analysis, Insights and Forecast - by Deployment
- 8.2.1. On-Premise
- 8.2.2. Cloud
- 8.3. Market Analysis, Insights and Forecast - by End-user Vertical
- 8.3.1. Healthcare
- 8.3.2. Government and Defense
- 8.3.3. Automotive
- 8.3.4. Retail
- 8.3.5. BFSI
- 8.3.6. Other End-user Verticals
- 8.1. Market Analysis, Insights and Forecast - by Component
- 9. Australia and New Zealand AI Governance Industry Analysis, Insights and Forecast, 2019-2031
- 9.1. Market Analysis, Insights and Forecast - by Component
- 9.1.1. Solution
- 9.1.2. Service
- 9.2. Market Analysis, Insights and Forecast - by Deployment
- 9.2.1. On-Premise
- 9.2.2. Cloud
- 9.3. Market Analysis, Insights and Forecast - by End-user Vertical
- 9.3.1. Healthcare
- 9.3.2. Government and Defense
- 9.3.3. Automotive
- 9.3.4. Retail
- 9.3.5. BFSI
- 9.3.6. Other End-user Verticals
- 9.1. Market Analysis, Insights and Forecast - by Component
- 10. Latin America AI Governance Industry Analysis, Insights and Forecast, 2019-2031
- 10.1. Market Analysis, Insights and Forecast - by Component
- 10.1.1. Solution
- 10.1.2. Service
- 10.2. Market Analysis, Insights and Forecast - by Deployment
- 10.2.1. On-Premise
- 10.2.2. Cloud
- 10.3. Market Analysis, Insights and Forecast - by End-user Vertical
- 10.3.1. Healthcare
- 10.3.2. Government and Defense
- 10.3.3. Automotive
- 10.3.4. Retail
- 10.3.5. BFSI
- 10.3.6. Other End-user Verticals
- 10.1. Market Analysis, Insights and Forecast - by Component
- 11. Middle East and Africa AI Governance Industry Analysis, Insights and Forecast, 2019-2031
- 11.1. Market Analysis, Insights and Forecast - by Component
- 11.1.1. Solution
- 11.1.2. Service
- 11.2. Market Analysis, Insights and Forecast - by Deployment
- 11.2.1. On-Premise
- 11.2.2. Cloud
- 11.3. Market Analysis, Insights and Forecast - by End-user Vertical
- 11.3.1. Healthcare
- 11.3.2. Government and Defense
- 11.3.3. Automotive
- 11.3.4. Retail
- 11.3.5. BFSI
- 11.3.6. Other End-user Verticals
- 11.1. Market Analysis, Insights and Forecast - by Component
- 12. North America AI Governance Industry Analysis, Insights and Forecast, 2019-2031
- 12.1. Market Analysis, Insights and Forecast - By Country/Sub-region
- 12.1.1 United States
- 12.1.2 Canada
- 12.1.3 Mexico
- 13. Europe AI Governance Industry Analysis, Insights and Forecast, 2019-2031
- 13.1. Market Analysis, Insights and Forecast - By Country/Sub-region
- 13.1.1 Germany
- 13.1.2 United Kingdom
- 13.1.3 France
- 13.1.4 Spain
- 13.1.5 Italy
- 13.1.6 Spain
- 13.1.7 Belgium
- 13.1.8 Netherland
- 13.1.9 Nordics
- 13.1.10 Rest of Europe
- 14. Asia Pacific AI Governance Industry Analysis, Insights and Forecast, 2019-2031
- 14.1. Market Analysis, Insights and Forecast - By Country/Sub-region
- 14.1.1 China
- 14.1.2 Japan
- 14.1.3 India
- 14.1.4 South Korea
- 14.1.5 Southeast Asia
- 14.1.6 Australia
- 14.1.7 Indonesia
- 14.1.8 Phillipes
- 14.1.9 Singapore
- 14.1.10 Thailandc
- 14.1.11 Rest of Asia Pacific
- 15. South America AI Governance Industry Analysis, Insights and Forecast, 2019-2031
- 15.1. Market Analysis, Insights and Forecast - By Country/Sub-region
- 15.1.1 Brazil
- 15.1.2 Argentina
- 15.1.3 Peru
- 15.1.4 Chile
- 15.1.5 Colombia
- 15.1.6 Ecuador
- 15.1.7 Venezuela
- 15.1.8 Rest of South America
- 16. North America AI Governance Industry Analysis, Insights and Forecast, 2019-2031
- 16.1. Market Analysis, Insights and Forecast - By Country/Sub-region
- 16.1.1 United States
- 16.1.2 Canada
- 16.1.3 Mexico
- 17. MEA AI Governance Industry Analysis, Insights and Forecast, 2019-2031
- 17.1. Market Analysis, Insights and Forecast - By Country/Sub-region
- 17.1.1 United Arab Emirates
- 17.1.2 Saudi Arabia
- 17.1.3 South Africa
- 17.1.4 Rest of Middle East and Africa
- 18. Competitive Analysis
- 18.1. Global Market Share Analysis 2024
- 18.2. Company Profiles
- 18.2.1 SAS Institute Inc
- 18.2.1.1. Overview
- 18.2.1.2. Products
- 18.2.1.3. SWOT Analysis
- 18.2.1.4. Recent Developments
- 18.2.1.5. Financials (Based on Availability)
- 18.2.2 FICO Inc
- 18.2.2.1. Overview
- 18.2.2.2. Products
- 18.2.2.3. SWOT Analysis
- 18.2.2.4. Recent Developments
- 18.2.2.5. Financials (Based on Availability)
- 18.2.3 Integrate ai Inc
- 18.2.3.1. Overview
- 18.2.3.2. Products
- 18.2.3.3. SWOT Analysis
- 18.2.3.4. Recent Developments
- 18.2.3.5. Financials (Based on Availability)
- 18.2.4 IBM Corporation
- 18.2.4.1. Overview
- 18.2.4.2. Products
- 18.2.4.3. SWOT Analysis
- 18.2.4.4. Recent Developments
- 18.2.4.5. Financials (Based on Availability)
- 18.2.5 Google LLC (Alphabet Inc )
- 18.2.5.1. Overview
- 18.2.5.2. Products
- 18.2.5.3. SWOT Analysis
- 18.2.5.4. Recent Developments
- 18.2.5.5. Financials (Based on Availability)
- 18.2.6 Salesforce com Inc
- 18.2.6.1. Overview
- 18.2.6.2. Products
- 18.2.6.3. SWOT Analysis
- 18.2.6.4. Recent Developments
- 18.2.6.5. Financials (Based on Availability)
- 18.2.7 Microsoft Corporation
- 18.2.7.1. Overview
- 18.2.7.2. Products
- 18.2.7.3. SWOT Analysis
- 18.2.7.4. Recent Developments
- 18.2.7.5. Financials (Based on Availability)
- 18.2.8 Pymetrics Inc
- 18.2.8.1. Overview
- 18.2.8.2. Products
- 18.2.8.3. SWOT Analysis
- 18.2.8.4. Recent Developments
- 18.2.8.5. Financials (Based on Availability)
- 18.2.9 Facebook Inc (Meta Platforms Inc )*List Not Exhaustive
- 18.2.9.1. Overview
- 18.2.9.2. Products
- 18.2.9.3. SWOT Analysis
- 18.2.9.4. Recent Developments
- 18.2.9.5. Financials (Based on Availability)
- 18.2.10 H2O ai Inc
- 18.2.10.1. Overview
- 18.2.10.2. Products
- 18.2.10.3. SWOT Analysis
- 18.2.10.4. Recent Developments
- 18.2.10.5. Financials (Based on Availability)
- 18.2.11 SAP SE
- 18.2.11.1. Overview
- 18.2.11.2. Products
- 18.2.11.3. SWOT Analysis
- 18.2.11.4. Recent Developments
- 18.2.11.5. Financials (Based on Availability)
- 18.2.1 SAS Institute Inc
List of Figures
- Figure 1: Global AI Governance Industry Revenue Breakdown (Million, %) by Region 2024 & 2032
- Figure 2: North America AI Governance Industry Revenue (Million), by Country 2024 & 2032
- Figure 3: North America AI Governance Industry Revenue Share (%), by Country 2024 & 2032
- Figure 4: Europe AI Governance Industry Revenue (Million), by Country 2024 & 2032
- Figure 5: Europe AI Governance Industry Revenue Share (%), by Country 2024 & 2032
- Figure 6: Asia Pacific AI Governance Industry Revenue (Million), by Country 2024 & 2032
- Figure 7: Asia Pacific AI Governance Industry Revenue Share (%), by Country 2024 & 2032
- Figure 8: South America AI Governance Industry Revenue (Million), by Country 2024 & 2032
- Figure 9: South America AI Governance Industry Revenue Share (%), by Country 2024 & 2032
- Figure 10: North America AI Governance Industry Revenue (Million), by Country 2024 & 2032
- Figure 11: North America AI Governance Industry Revenue Share (%), by Country 2024 & 2032
- Figure 12: MEA AI Governance Industry Revenue (Million), by Country 2024 & 2032
- Figure 13: MEA AI Governance Industry Revenue Share (%), by Country 2024 & 2032
- Figure 14: North America AI Governance Industry Revenue (Million), by Component 2024 & 2032
- Figure 15: North America AI Governance Industry Revenue Share (%), by Component 2024 & 2032
- Figure 16: North America AI Governance Industry Revenue (Million), by Deployment 2024 & 2032
- Figure 17: North America AI Governance Industry Revenue Share (%), by Deployment 2024 & 2032
- Figure 18: North America AI Governance Industry Revenue (Million), by End-user Vertical 2024 & 2032
- Figure 19: North America AI Governance Industry Revenue Share (%), by End-user Vertical 2024 & 2032
- Figure 20: North America AI Governance Industry Revenue (Million), by Country 2024 & 2032
- Figure 21: North America AI Governance Industry Revenue Share (%), by Country 2024 & 2032
- Figure 22: Europe AI Governance Industry Revenue (Million), by Component 2024 & 2032
- Figure 23: Europe AI Governance Industry Revenue Share (%), by Component 2024 & 2032
- Figure 24: Europe AI Governance Industry Revenue (Million), by Deployment 2024 & 2032
- Figure 25: Europe AI Governance Industry Revenue Share (%), by Deployment 2024 & 2032
- Figure 26: Europe AI Governance Industry Revenue (Million), by End-user Vertical 2024 & 2032
- Figure 27: Europe AI Governance Industry Revenue Share (%), by End-user Vertical 2024 & 2032
- Figure 28: Europe AI Governance Industry Revenue (Million), by Country 2024 & 2032
- Figure 29: Europe AI Governance Industry Revenue Share (%), by Country 2024 & 2032
- Figure 30: Asia AI Governance Industry Revenue (Million), by Component 2024 & 2032
- Figure 31: Asia AI Governance Industry Revenue Share (%), by Component 2024 & 2032
- Figure 32: Asia AI Governance Industry Revenue (Million), by Deployment 2024 & 2032
- Figure 33: Asia AI Governance Industry Revenue Share (%), by Deployment 2024 & 2032
- Figure 34: Asia AI Governance Industry Revenue (Million), by End-user Vertical 2024 & 2032
- Figure 35: Asia AI Governance Industry Revenue Share (%), by End-user Vertical 2024 & 2032
- Figure 36: Asia AI Governance Industry Revenue (Million), by Country 2024 & 2032
- Figure 37: Asia AI Governance Industry Revenue Share (%), by Country 2024 & 2032
- Figure 38: Australia and New Zealand AI Governance Industry Revenue (Million), by Component 2024 & 2032
- Figure 39: Australia and New Zealand AI Governance Industry Revenue Share (%), by Component 2024 & 2032
- Figure 40: Australia and New Zealand AI Governance Industry Revenue (Million), by Deployment 2024 & 2032
- Figure 41: Australia and New Zealand AI Governance Industry Revenue Share (%), by Deployment 2024 & 2032
- Figure 42: Australia and New Zealand AI Governance Industry Revenue (Million), by End-user Vertical 2024 & 2032
- Figure 43: Australia and New Zealand AI Governance Industry Revenue Share (%), by End-user Vertical 2024 & 2032
- Figure 44: Australia and New Zealand AI Governance Industry Revenue (Million), by Country 2024 & 2032
- Figure 45: Australia and New Zealand AI Governance Industry Revenue Share (%), by Country 2024 & 2032
- Figure 46: Latin America AI Governance Industry Revenue (Million), by Component 2024 & 2032
- Figure 47: Latin America AI Governance Industry Revenue Share (%), by Component 2024 & 2032
- Figure 48: Latin America AI Governance Industry Revenue (Million), by Deployment 2024 & 2032
- Figure 49: Latin America AI Governance Industry Revenue Share (%), by Deployment 2024 & 2032
- Figure 50: Latin America AI Governance Industry Revenue (Million), by End-user Vertical 2024 & 2032
- Figure 51: Latin America AI Governance Industry Revenue Share (%), by End-user Vertical 2024 & 2032
- Figure 52: Latin America AI Governance Industry Revenue (Million), by Country 2024 & 2032
- Figure 53: Latin America AI Governance Industry Revenue Share (%), by Country 2024 & 2032
- Figure 54: Middle East and Africa AI Governance Industry Revenue (Million), by Component 2024 & 2032
- Figure 55: Middle East and Africa AI Governance Industry Revenue Share (%), by Component 2024 & 2032
- Figure 56: Middle East and Africa AI Governance Industry Revenue (Million), by Deployment 2024 & 2032
- Figure 57: Middle East and Africa AI Governance Industry Revenue Share (%), by Deployment 2024 & 2032
- Figure 58: Middle East and Africa AI Governance Industry Revenue (Million), by End-user Vertical 2024 & 2032
- Figure 59: Middle East and Africa AI Governance Industry Revenue Share (%), by End-user Vertical 2024 & 2032
- Figure 60: Middle East and Africa AI Governance Industry Revenue (Million), by Country 2024 & 2032
- Figure 61: Middle East and Africa AI Governance Industry Revenue Share (%), by Country 2024 & 2032
List of Tables
- Table 1: Global AI Governance Industry Revenue Million Forecast, by Region 2019 & 2032
- Table 2: Global AI Governance Industry Revenue Million Forecast, by Component 2019 & 2032
- Table 3: Global AI Governance Industry Revenue Million Forecast, by Deployment 2019 & 2032
- Table 4: Global AI Governance Industry Revenue Million Forecast, by End-user Vertical 2019 & 2032
- Table 5: Global AI Governance Industry Revenue Million Forecast, by Region 2019 & 2032
- Table 6: Global AI Governance Industry Revenue Million Forecast, by Country 2019 & 2032
- Table 7: United States AI Governance Industry Revenue (Million) Forecast, by Application 2019 & 2032
- Table 8: Canada AI Governance Industry Revenue (Million) Forecast, by Application 2019 & 2032
- Table 9: Mexico AI Governance Industry Revenue (Million) Forecast, by Application 2019 & 2032
- Table 10: Global AI Governance Industry Revenue Million Forecast, by Country 2019 & 2032
- Table 11: Germany AI Governance Industry Revenue (Million) Forecast, by Application 2019 & 2032
- Table 12: United Kingdom AI Governance Industry Revenue (Million) Forecast, by Application 2019 & 2032
- Table 13: France AI Governance Industry Revenue (Million) Forecast, by Application 2019 & 2032
- Table 14: Spain AI Governance Industry Revenue (Million) Forecast, by Application 2019 & 2032
- Table 15: Italy AI Governance Industry Revenue (Million) Forecast, by Application 2019 & 2032
- Table 16: Spain AI Governance Industry Revenue (Million) Forecast, by Application 2019 & 2032
- Table 17: Belgium AI Governance Industry Revenue (Million) Forecast, by Application 2019 & 2032
- Table 18: Netherland AI Governance Industry Revenue (Million) Forecast, by Application 2019 & 2032
- Table 19: Nordics AI Governance Industry Revenue (Million) Forecast, by Application 2019 & 2032
- Table 20: Rest of Europe AI Governance Industry Revenue (Million) Forecast, by Application 2019 & 2032
- Table 21: Global AI Governance Industry Revenue Million Forecast, by Country 2019 & 2032
- Table 22: China AI Governance Industry Revenue (Million) Forecast, by Application 2019 & 2032
- Table 23: Japan AI Governance Industry Revenue (Million) Forecast, by Application 2019 & 2032
- Table 24: India AI Governance Industry Revenue (Million) Forecast, by Application 2019 & 2032
- Table 25: South Korea AI Governance Industry Revenue (Million) Forecast, by Application 2019 & 2032
- Table 26: Southeast Asia AI Governance Industry Revenue (Million) Forecast, by Application 2019 & 2032
- Table 27: Australia AI Governance Industry Revenue (Million) Forecast, by Application 2019 & 2032
- Table 28: Indonesia AI Governance Industry Revenue (Million) Forecast, by Application 2019 & 2032
- Table 29: Phillipes AI Governance Industry Revenue (Million) Forecast, by Application 2019 & 2032
- Table 30: Singapore AI Governance Industry Revenue (Million) Forecast, by Application 2019 & 2032
- Table 31: Thailandc AI Governance Industry Revenue (Million) Forecast, by Application 2019 & 2032
- Table 32: Rest of Asia Pacific AI Governance Industry Revenue (Million) Forecast, by Application 2019 & 2032
- Table 33: Global AI Governance Industry Revenue Million Forecast, by Country 2019 & 2032
- Table 34: Brazil AI Governance Industry Revenue (Million) Forecast, by Application 2019 & 2032
- Table 35: Argentina AI Governance Industry Revenue (Million) Forecast, by Application 2019 & 2032
- Table 36: Peru AI Governance Industry Revenue (Million) Forecast, by Application 2019 & 2032
- Table 37: Chile AI Governance Industry Revenue (Million) Forecast, by Application 2019 & 2032
- Table 38: Colombia AI Governance Industry Revenue (Million) Forecast, by Application 2019 & 2032
- Table 39: Ecuador AI Governance Industry Revenue (Million) Forecast, by Application 2019 & 2032
- Table 40: Venezuela AI Governance Industry Revenue (Million) Forecast, by Application 2019 & 2032
- Table 41: Rest of South America AI Governance Industry Revenue (Million) Forecast, by Application 2019 & 2032
- Table 42: Global AI Governance Industry Revenue Million Forecast, by Country 2019 & 2032
- Table 43: United States AI Governance Industry Revenue (Million) Forecast, by Application 2019 & 2032
- Table 44: Canada AI Governance Industry Revenue (Million) Forecast, by Application 2019 & 2032
- Table 45: Mexico AI Governance Industry Revenue (Million) Forecast, by Application 2019 & 2032
- Table 46: Global AI Governance Industry Revenue Million Forecast, by Country 2019 & 2032
- Table 47: United Arab Emirates AI Governance Industry Revenue (Million) Forecast, by Application 2019 & 2032
- Table 48: Saudi Arabia AI Governance Industry Revenue (Million) Forecast, by Application 2019 & 2032
- Table 49: South Africa AI Governance Industry Revenue (Million) Forecast, by Application 2019 & 2032
- Table 50: Rest of Middle East and Africa AI Governance Industry Revenue (Million) Forecast, by Application 2019 & 2032
- Table 51: Global AI Governance Industry Revenue Million Forecast, by Component 2019 & 2032
- Table 52: Global AI Governance Industry Revenue Million Forecast, by Deployment 2019 & 2032
- Table 53: Global AI Governance Industry Revenue Million Forecast, by End-user Vertical 2019 & 2032
- Table 54: Global AI Governance Industry Revenue Million Forecast, by Country 2019 & 2032
- Table 55: United States AI Governance Industry Revenue (Million) Forecast, by Application 2019 & 2032
- Table 56: Canada AI Governance Industry Revenue (Million) Forecast, by Application 2019 & 2032
- Table 57: Global AI Governance Industry Revenue Million Forecast, by Component 2019 & 2032
- Table 58: Global AI Governance Industry Revenue Million Forecast, by Deployment 2019 & 2032
- Table 59: Global AI Governance Industry Revenue Million Forecast, by End-user Vertical 2019 & 2032
- Table 60: Global AI Governance Industry Revenue Million Forecast, by Country 2019 & 2032
- Table 61: United Kingdom AI Governance Industry Revenue (Million) Forecast, by Application 2019 & 2032
- Table 62: Germany AI Governance Industry Revenue (Million) Forecast, by Application 2019 & 2032
- Table 63: France AI Governance Industry Revenue (Million) Forecast, by Application 2019 & 2032
- Table 64: Global AI Governance Industry Revenue Million Forecast, by Component 2019 & 2032
- Table 65: Global AI Governance Industry Revenue Million Forecast, by Deployment 2019 & 2032
- Table 66: Global AI Governance Industry Revenue Million Forecast, by End-user Vertical 2019 & 2032
- Table 67: Global AI Governance Industry Revenue Million Forecast, by Country 2019 & 2032
- Table 68: China AI Governance Industry Revenue (Million) Forecast, by Application 2019 & 2032
- Table 69: India AI Governance Industry Revenue (Million) Forecast, by Application 2019 & 2032
- Table 70: Japan AI Governance Industry Revenue (Million) Forecast, by Application 2019 & 2032
- Table 71: Global AI Governance Industry Revenue Million Forecast, by Component 2019 & 2032
- Table 72: Global AI Governance Industry Revenue Million Forecast, by Deployment 2019 & 2032
- Table 73: Global AI Governance Industry Revenue Million Forecast, by End-user Vertical 2019 & 2032
- Table 74: Global AI Governance Industry Revenue Million Forecast, by Country 2019 & 2032
- Table 75: Global AI Governance Industry Revenue Million Forecast, by Component 2019 & 2032
- Table 76: Global AI Governance Industry Revenue Million Forecast, by Deployment 2019 & 2032
- Table 77: Global AI Governance Industry Revenue Million Forecast, by End-user Vertical 2019 & 2032
- Table 78: Global AI Governance Industry Revenue Million Forecast, by Country 2019 & 2032
- Table 79: Global AI Governance Industry Revenue Million Forecast, by Component 2019 & 2032
- Table 80: Global AI Governance Industry Revenue Million Forecast, by Deployment 2019 & 2032
- Table 81: Global AI Governance Industry Revenue Million Forecast, by End-user Vertical 2019 & 2032
- Table 82: Global AI Governance Industry Revenue Million Forecast, by Country 2019 & 2032
Frequently Asked Questions
1. What is the projected Compound Annual Growth Rate (CAGR) of the AI Governance Industry?
The projected CAGR is approximately 28.80%.
2. Which companies are prominent players in the AI Governance Industry?
Key companies in the market include SAS Institute Inc, FICO Inc, Integrate ai Inc, IBM Corporation, Google LLC (Alphabet Inc ), Salesforce com Inc, Microsoft Corporation, Pymetrics Inc, Facebook Inc (Meta Platforms Inc )*List Not Exhaustive, H2O ai Inc, SAP SE.
3. What are the main segments of the AI Governance Industry?
The market segments include Component, Deployment, End-user Vertical.
4. Can you provide details about the market size?
The market size is estimated to be USD 264.18 Million as of 2022.
5. What are some drivers contributing to market growth?
Growing Demand for Transparency in AI Decision Making; Expanding Government Initiatives to Leverage the AI Technology.
6. What are the notable trends driving market growth?
Growing use of AI in Retail is Expected to Open Up New Avenues for Market Growth.
7. Are there any restraints impacting market growth?
Inadequate AI Expertise and Skills can Act as a Restraint.
8. Can you provide examples of recent developments in the market?
February 2022 - Meta AI (Formerly known as Facebook AI) announced that it had open-sourced data2vec, a unified framework for self-supervised deep learning on text, images, and speech audio data.
9. What pricing options are available for accessing the report?
Pricing options include single-user, multi-user, and enterprise licenses priced at USD 4750, USD 5250, and USD 8750 respectively.
10. Is the market size provided in terms of value or volume?
The market size is provided in terms of value, measured in Million.
11. Are there any specific market keywords associated with the report?
Yes, the market keyword associated with the report is "AI Governance Industry," which aids in identifying and referencing the specific market segment covered.
12. How do I determine which pricing option suits my needs best?
The pricing options vary based on user requirements and access needs. Individual users may opt for single-user licenses, while businesses requiring broader access may choose multi-user or enterprise licenses for cost-effective access to the report.
13. Are there any additional resources or data provided in the AI Governance Industry report?
While the report offers comprehensive insights, it's advisable to review the specific contents or supplementary materials provided to ascertain if additional resources or data are available.
14. How can I stay updated on further developments or reports in the AI Governance Industry?
To stay informed about further developments, trends, and reports in the AI Governance Industry, consider subscribing to industry newsletters, following relevant companies and organizations, or regularly checking reputable industry news sources and publications.
Methodology
Step 1 - Identification of Relevant Samples Size from Population Database


Step 2 - Approaches for Defining Global Market Size (Value, Volume* & Price*)

Note*: In applicable scenarios
Step 3 - Data Sources
Primary Research
- Web Analytics
- Survey Reports
- Research Institute
- Latest Research Reports
- Opinion Leaders
Secondary Research
- Annual Reports
- White Paper
- Latest Press Release
- Industry Association
- Paid Database
- Investor Presentations

Step 4 - Data Triangulation
Involves using different sources of information in order to increase the validity of a study
These sources are likely to be stakeholders in a program - participants, other researchers, program staff, other community members, and so on.
Then we put all data in single framework & apply various statistical tools to find out the dynamic on the market.
During the analysis stage, feedback from the stakeholder groups would be compared to determine areas of agreement as well as areas of divergence
