

Key Insights
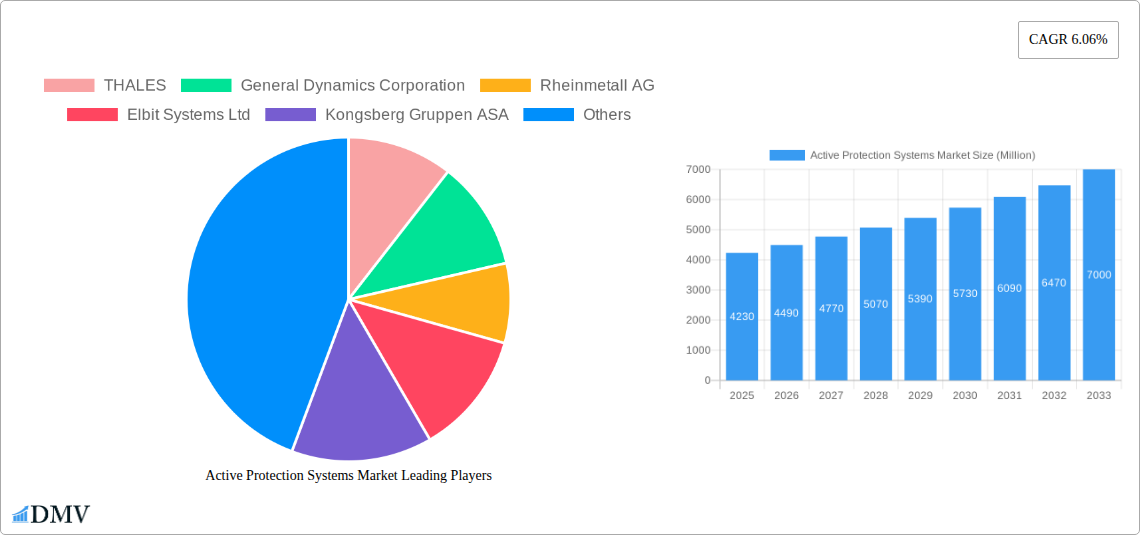
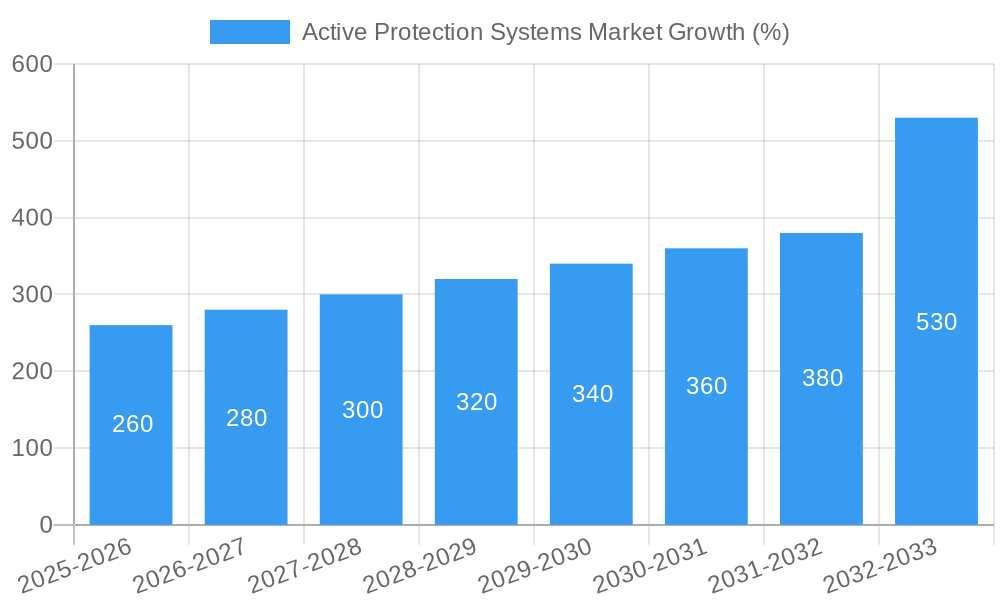
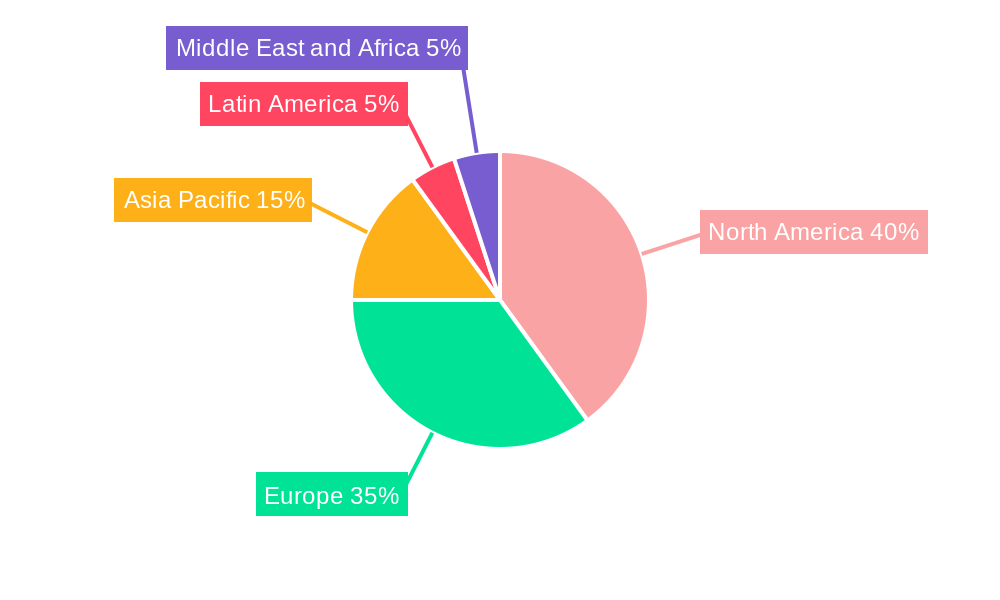
The Active Protection Systems (APS) market, valued at $4.23 billion in 2025, is projected to experience robust growth, driven by escalating geopolitical instability and the increasing need for enhanced military vehicle protection. A Compound Annual Growth Rate (CAGR) of 6.06% from 2025 to 2033 indicates a significant market expansion, reaching an estimated $7.0 billion by 2033. Key drivers include the modernization of existing military fleets, the integration of APS into next-generation combat vehicles, and rising demand from diverse defense applications such as naval platforms and unmanned aerial vehicles. The market segmentation reveals a strong preference for Hard-Kill systems due to their superior capability to neutralize incoming threats. However, the Soft-Kill segment is expected to witness substantial growth driven by technological advancements leading to increased effectiveness and reduced cost. Geographically, North America and Europe currently dominate the market, reflecting high defense budgets and technological advancements in these regions. However, Asia-Pacific is expected to exhibit significant growth, fueled by increasing military expenditure and modernization efforts in countries like China and India. Competition amongst established players like Thales, General Dynamics, and Rheinmetall is intense, driving innovation and fostering a dynamic market landscape.
The growth trajectory is influenced by several factors. Technological advancements, particularly in areas such as sensor technology, artificial intelligence, and improved countermeasures, are creating more effective and versatile APS solutions. Government investments in defense modernization and technological upgrades are crucial in stimulating market demand. Furthermore, the increasing adoption of APS across various platforms, including both terrestrial and naval vehicles, expands the overall market potential. While certain restraints like high initial investment costs and the complexities of system integration might pose challenges, these are likely to be offset by the significant benefits in terms of enhanced troop safety and operational effectiveness, fueling continued market expansion in the forecast period.
Active Protection Systems Market: A Comprehensive Report (2019-2033)
This insightful report provides a detailed analysis of the global Active Protection Systems (APS) market, offering a comprehensive overview of its current state, future trajectory, and key players. The study period spans 2019-2033, with 2025 serving as the base and estimated year. The report delves into market composition, technological advancements, regional dominance, and future opportunities, providing invaluable insights for stakeholders across the defense and security sectors. The market is projected to reach xx Million by 2033, showcasing significant growth potential.
Active Protection Systems Market Composition & Trends
This section meticulously examines the competitive landscape of the Active Protection Systems market, evaluating market concentration, innovation drivers, regulatory frameworks, substitute products, and end-user profiles. We analyze mergers and acquisitions (M&A) activity, quantifying deal values and their impact on market share distribution. Key findings include:
- Market Concentration: The market exhibits a moderately concentrated structure, with a few major players holding significant market share. The top five players account for approximately xx% of the global market (2025).
- Innovation Catalysts: Continuous advancements in sensor technology, artificial intelligence (AI), and miniaturization are driving innovation within the APS sector. The development of more effective countermeasures against advanced threats is a primary focus.
- Regulatory Landscape: Stringent regulations governing the export and deployment of defense technologies significantly influence market dynamics. Compliance costs and limitations on certain technologies impact market growth.
- Substitute Products: While APS systems offer unique capabilities, alternative solutions such as improved reactive armor and enhanced camouflage technologies exert competitive pressure.
- End-User Profiles: The primary end-users are military forces globally, with a strong focus on armored vehicles and naval platforms. Government procurement policies and budgetary allocations significantly impact demand.
- M&A Activity: The past five years have witnessed a surge in M&A activity, with an estimated xx Million invested in deals aimed at expanding technological capabilities and market reach. Consolidation among key players is expected to continue. Significant deals included [List specific examples with deal values, if available].
Active Protection Systems Market Industry Evolution
This section provides a deep dive into the evolution of the Active Protection Systems market, analyzing growth trajectories, technological breakthroughs, and evolving consumer (military) demands. The report traces the market's journey from 2019 to 2025 and projects its trajectory through 2033. We explore shifts in military strategies and technological advancements that have shaped the market's development. Specific data points include:
- CAGR (2019-2024): xx%
- Projected CAGR (2025-2033): xx%
- Adoption Rate (2025): xx% of deployed armored vehicles are estimated to be equipped with APS.
[Insert a detailed paragraph here explaining growth, technological advancements (e.g., transition from hard-kill to soft-kill, AI integration), and evolving consumer/military needs, referencing the data points above and providing further specific examples of technological advancements and their impact on market growth. Note: This section needs 600 words of in-depth analysis and requires data to fill in the xx placeholders.]
Leading Regions, Countries, or Segments in Active Protection Systems Market
This section identifies the dominant regions, countries, and segments within the Active Protection Systems market. We analyze the factors driving their prominence.
Dominant Segment: [Identify either Hard-Kill, Soft-Kill, Terrestrial, or Naval as the dominant segment based on your data].
Key Drivers (using bullet points):
- [Specific Region/Country/Segment]:
- High defense spending
- Stringent security concerns
- Favorable government policies
- Presence of major APS manufacturers
- Significant military modernization programs.
[Insert detailed paragraphs here explaining the dominance of the identified segment/region/country, referencing the bullet points above and providing further in-depth analysis. Consider using comparative analysis against other segments. This section requires 600 words of detailed analysis]
Active Protection Systems Market Product Innovations
Recent innovations in Active Protection Systems focus on enhancing effectiveness, reducing weight and size, improving reliability, and integrating advanced technologies such as AI-powered threat detection and discrimination. Systems now boast improved reaction times, more precise targeting capabilities, and countermeasures against a wider range of threats, including rockets, missiles, and kinetic energy penetrators. This leads to improved survivability for armored vehicles and enhances mission success rates. Unique selling propositions include reduced collateral damage and improved battlefield awareness.
Propelling Factors for Active Protection Systems Market Growth
Several factors drive the growth of the Active Protection Systems market. Increased defense budgets globally, particularly in regions experiencing geopolitical instability, are a primary catalyst. Technological advancements leading to more effective, reliable, and affordable systems fuel market expansion. Stringent regulations demanding increased protection for military personnel further propel demand. The growing integration of APS into various platforms, including naval vessels, further contributes to market growth.
Obstacles in the Active Protection Systems Market
Despite considerable growth potential, several factors pose challenges to market expansion. High initial investment costs for APS systems can hinder adoption, especially for smaller militaries. The complexity of integrating APS into existing platforms and the need for specialized training present implementation barriers. Supply chain disruptions related to the sourcing of critical components can affect production and delivery timelines. Intense competition among established players further complicates market dynamics.
Future Opportunities in Active Protection Systems Market
Future opportunities lie in the development of next-generation APS systems integrating advanced technologies such as directed energy weapons, improved countermeasures against advanced threats (e.g., drones, anti-tank guided missiles), and increased integration with other defensive systems. Expansion into new markets, particularly in developing economies, holds significant potential. The growing demand for enhanced protection in civilian applications, such as armored vehicles for law enforcement, could also open new avenues for growth.
Major Players in the Active Protection Systems Market Ecosystem
- THALES
- General Dynamics Corporation
- Rheinmetall AG
- Elbit Systems Ltd
- Kongsberg Gruppen ASA
- Rostec State Corporation
- Rafael Advanced Defense Systems Ltd
- RTX Corporation
- Artis
- Leonardo S p A
- BAE Systems plc
- Saab AB
- ASELSAN A Ş
Key Developments in Active Protection Systems Market Industry
- [Insert bullet points here with specific developments, dates, and their impact on market dynamics. Example: "January 2023: Rheinmetall AG launched its new Trophy-MV APS system for main battle tanks, expanding its market share in the hard-kill segment."]
Strategic Active Protection Systems Market Forecast
The Active Protection Systems market is poised for robust growth over the forecast period (2025-2033). Continuous technological advancements, increasing defense budgets, and the growing need for enhanced protection in various military and potentially civilian applications will drive market expansion. Emerging markets and the development of next-generation systems present significant opportunities for growth. The market is expected to experience substantial expansion, driven by technological innovation and geopolitical factors. The focus on advanced countermeasures and the integration of AI and other emerging technologies will shape the future landscape.
Active Protection Systems Market Segmentation
- 1. Production Analysis
- 2. Consumption Analysis
- 3. Import Market Analysis (Value & Volume)
- 4. Export Market Analysis (Value & Volume)
- 5. Price Trend Analysis
Active Protection Systems Market Segmentation By Geography
-
1. North America
- 1.1. United States
- 1.2. Canada
- 1.3. Mexico
-
2. South America
- 2.1. Brazil
- 2.2. Argentina
- 2.3. Rest of South America
-
3. Europe
- 3.1. United Kingdom
- 3.2. Germany
- 3.3. France
- 3.4. Italy
- 3.5. Spain
- 3.6. Russia
- 3.7. Benelux
- 3.8. Nordics
- 3.9. Rest of Europe
-
4. Middle East & Africa
- 4.1. Turkey
- 4.2. Israel
- 4.3. GCC
- 4.4. North Africa
- 4.5. South Africa
- 4.6. Rest of Middle East & Africa
-
5. Asia Pacific
- 5.1. China
- 5.2. India
- 5.3. Japan
- 5.4. South Korea
- 5.5. ASEAN
- 5.6. Oceania
- 5.7. Rest of Asia Pacific
Active Protection Systems Market REPORT HIGHLIGHTS
| Aspects | Details |
|---|---|
| Study Period | 2019-2033 |
| Base Year | 2024 |
| Estimated Year | 2025 |
| Forecast Period | 2025-2033 |
| Historical Period | 2019-2024 |
| Growth Rate | CAGR of 6.06% from 2019-2033 |
| Segmentation |
|
Table of Contents
- 1. Introduction
- 1.1. Research Scope
- 1.2. Market Segmentation
- 1.3. Research Methodology
- 1.4. Definitions and Assumptions
- 2. Executive Summary
- 2.1. Introduction
- 3. Market Dynamics
- 3.1. Introduction
- 3.2. Market Drivers
- 3.2.1. ; Increasing Number Of Air Passengers; Use Of Portable Electronic Devices
- 3.3. Market Restrains
- 3.3.1. ; High Cost Of Connectivity Equipments
- 3.4. Market Trends
- 3.4.1. The Terrestrial Segment Holds Highest Shares in the Market
- 4. Market Factor Analysis
- 4.1. Porters Five Forces
- 4.2. Supply/Value Chain
- 4.3. PESTEL analysis
- 4.4. Market Entropy
- 4.5. Patent/Trademark Analysis
- 5. Global Active Protection Systems Market Analysis, Insights and Forecast, 2019-2031
- 5.1. Market Analysis, Insights and Forecast - by Production Analysis
- 5.2. Market Analysis, Insights and Forecast - by Consumption Analysis
- 5.3. Market Analysis, Insights and Forecast - by Import Market Analysis (Value & Volume)
- 5.4. Market Analysis, Insights and Forecast - by Export Market Analysis (Value & Volume)
- 5.5. Market Analysis, Insights and Forecast - by Price Trend Analysis
- 5.6. Market Analysis, Insights and Forecast - by Region
- 5.6.1. North America
- 5.6.2. South America
- 5.6.3. Europe
- 5.6.4. Middle East & Africa
- 5.6.5. Asia Pacific
- 5.1. Market Analysis, Insights and Forecast - by Production Analysis
- 6. North America Active Protection Systems Market Analysis, Insights and Forecast, 2019-2031
- 6.1. Market Analysis, Insights and Forecast - by Production Analysis
- 6.2. Market Analysis, Insights and Forecast - by Consumption Analysis
- 6.3. Market Analysis, Insights and Forecast - by Import Market Analysis (Value & Volume)
- 6.4. Market Analysis, Insights and Forecast - by Export Market Analysis (Value & Volume)
- 6.5. Market Analysis, Insights and Forecast - by Price Trend Analysis
- 6.1. Market Analysis, Insights and Forecast - by Production Analysis
- 7. South America Active Protection Systems Market Analysis, Insights and Forecast, 2019-2031
- 7.1. Market Analysis, Insights and Forecast - by Production Analysis
- 7.2. Market Analysis, Insights and Forecast - by Consumption Analysis
- 7.3. Market Analysis, Insights and Forecast - by Import Market Analysis (Value & Volume)
- 7.4. Market Analysis, Insights and Forecast - by Export Market Analysis (Value & Volume)
- 7.5. Market Analysis, Insights and Forecast - by Price Trend Analysis
- 7.1. Market Analysis, Insights and Forecast - by Production Analysis
- 8. Europe Active Protection Systems Market Analysis, Insights and Forecast, 2019-2031
- 8.1. Market Analysis, Insights and Forecast - by Production Analysis
- 8.2. Market Analysis, Insights and Forecast - by Consumption Analysis
- 8.3. Market Analysis, Insights and Forecast - by Import Market Analysis (Value & Volume)
- 8.4. Market Analysis, Insights and Forecast - by Export Market Analysis (Value & Volume)
- 8.5. Market Analysis, Insights and Forecast - by Price Trend Analysis
- 8.1. Market Analysis, Insights and Forecast - by Production Analysis
- 9. Middle East & Africa Active Protection Systems Market Analysis, Insights and Forecast, 2019-2031
- 9.1. Market Analysis, Insights and Forecast - by Production Analysis
- 9.2. Market Analysis, Insights and Forecast - by Consumption Analysis
- 9.3. Market Analysis, Insights and Forecast - by Import Market Analysis (Value & Volume)
- 9.4. Market Analysis, Insights and Forecast - by Export Market Analysis (Value & Volume)
- 9.5. Market Analysis, Insights and Forecast - by Price Trend Analysis
- 9.1. Market Analysis, Insights and Forecast - by Production Analysis
- 10. Asia Pacific Active Protection Systems Market Analysis, Insights and Forecast, 2019-2031
- 10.1. Market Analysis, Insights and Forecast - by Production Analysis
- 10.2. Market Analysis, Insights and Forecast - by Consumption Analysis
- 10.3. Market Analysis, Insights and Forecast - by Import Market Analysis (Value & Volume)
- 10.4. Market Analysis, Insights and Forecast - by Export Market Analysis (Value & Volume)
- 10.5. Market Analysis, Insights and Forecast - by Price Trend Analysis
- 10.1. Market Analysis, Insights and Forecast - by Production Analysis
- 11. North America Active Protection Systems Market Analysis, Insights and Forecast, 2019-2031
- 11.1. Market Analysis, Insights and Forecast - By Country/Sub-region
- 11.1.1 United States
- 11.1.2 Canada
- 12. Europe Active Protection Systems Market Analysis, Insights and Forecast, 2019-2031
- 12.1. Market Analysis, Insights and Forecast - By Country/Sub-region
- 12.1.1 United Kingdom
- 12.1.2 France
- 12.1.3 Germany
- 12.1.4 Russia
- 12.1.5 Rest of Europe
- 13. Asia Pacific Active Protection Systems Market Analysis, Insights and Forecast, 2019-2031
- 13.1. Market Analysis, Insights and Forecast - By Country/Sub-region
- 13.1.1 China
- 13.1.2 India
- 13.1.3 Japan
- 13.1.4 South Korea
- 13.1.5 Rest of Asia Pacific
- 14. Latin America Active Protection Systems Market Analysis, Insights and Forecast, 2019-2031
- 14.1. Market Analysis, Insights and Forecast - By Country/Sub-region
- 14.1.1 Brazil
- 14.1.2 Mexico
- 14.1.3 Rest of Latin America
- 15. Middle East and Africa Active Protection Systems Market Analysis, Insights and Forecast, 2019-2031
- 15.1. Market Analysis, Insights and Forecast - By Country/Sub-region
- 15.1.1 United Arab Emirates
- 15.1.2 Saudi Arabia
- 15.1.3 Israel
- 15.1.4 South Africa
- 15.1.5 Rest of Middle East and Africa
- 16. Competitive Analysis
- 16.1. Global Market Share Analysis 2024
- 16.2. Company Profiles
- 16.2.1 THALES
- 16.2.1.1. Overview
- 16.2.1.2. Products
- 16.2.1.3. SWOT Analysis
- 16.2.1.4. Recent Developments
- 16.2.1.5. Financials (Based on Availability)
- 16.2.2 General Dynamics Corporation
- 16.2.2.1. Overview
- 16.2.2.2. Products
- 16.2.2.3. SWOT Analysis
- 16.2.2.4. Recent Developments
- 16.2.2.5. Financials (Based on Availability)
- 16.2.3 Rheinmetall AG
- 16.2.3.1. Overview
- 16.2.3.2. Products
- 16.2.3.3. SWOT Analysis
- 16.2.3.4. Recent Developments
- 16.2.3.5. Financials (Based on Availability)
- 16.2.4 Elbit Systems Ltd
- 16.2.4.1. Overview
- 16.2.4.2. Products
- 16.2.4.3. SWOT Analysis
- 16.2.4.4. Recent Developments
- 16.2.4.5. Financials (Based on Availability)
- 16.2.5 Kongsberg Gruppen ASA
- 16.2.5.1. Overview
- 16.2.5.2. Products
- 16.2.5.3. SWOT Analysis
- 16.2.5.4. Recent Developments
- 16.2.5.5. Financials (Based on Availability)
- 16.2.6 Rostec State Corporatio
- 16.2.6.1. Overview
- 16.2.6.2. Products
- 16.2.6.3. SWOT Analysis
- 16.2.6.4. Recent Developments
- 16.2.6.5. Financials (Based on Availability)
- 16.2.7 Rafael Advanced Defense Systems Ltd
- 16.2.7.1. Overview
- 16.2.7.2. Products
- 16.2.7.3. SWOT Analysis
- 16.2.7.4. Recent Developments
- 16.2.7.5. Financials (Based on Availability)
- 16.2.8 RTX Corporation
- 16.2.8.1. Overview
- 16.2.8.2. Products
- 16.2.8.3. SWOT Analysis
- 16.2.8.4. Recent Developments
- 16.2.8.5. Financials (Based on Availability)
- 16.2.9 Artis
- 16.2.9.1. Overview
- 16.2.9.2. Products
- 16.2.9.3. SWOT Analysis
- 16.2.9.4. Recent Developments
- 16.2.9.5. Financials (Based on Availability)
- 16.2.10 Leonardo S p A
- 16.2.10.1. Overview
- 16.2.10.2. Products
- 16.2.10.3. SWOT Analysis
- 16.2.10.4. Recent Developments
- 16.2.10.5. Financials (Based on Availability)
- 16.2.11 BAE Systems plc
- 16.2.11.1. Overview
- 16.2.11.2. Products
- 16.2.11.3. SWOT Analysis
- 16.2.11.4. Recent Developments
- 16.2.11.5. Financials (Based on Availability)
- 16.2.12 Saab AB
- 16.2.12.1. Overview
- 16.2.12.2. Products
- 16.2.12.3. SWOT Analysis
- 16.2.12.4. Recent Developments
- 16.2.12.5. Financials (Based on Availability)
- 16.2.13 ASELSAN A Ş
- 16.2.13.1. Overview
- 16.2.13.2. Products
- 16.2.13.3. SWOT Analysis
- 16.2.13.4. Recent Developments
- 16.2.13.5. Financials (Based on Availability)
- 16.2.1 THALES
List of Figures
- Figure 1: Global Active Protection Systems Market Revenue Breakdown (Million, %) by Region 2024 & 2032
- Figure 2: North America Active Protection Systems Market Revenue (Million), by Country 2024 & 2032
- Figure 3: North America Active Protection Systems Market Revenue Share (%), by Country 2024 & 2032
- Figure 4: Europe Active Protection Systems Market Revenue (Million), by Country 2024 & 2032
- Figure 5: Europe Active Protection Systems Market Revenue Share (%), by Country 2024 & 2032
- Figure 6: Asia Pacific Active Protection Systems Market Revenue (Million), by Country 2024 & 2032
- Figure 7: Asia Pacific Active Protection Systems Market Revenue Share (%), by Country 2024 & 2032
- Figure 8: Latin America Active Protection Systems Market Revenue (Million), by Country 2024 & 2032
- Figure 9: Latin America Active Protection Systems Market Revenue Share (%), by Country 2024 & 2032
- Figure 10: Middle East and Africa Active Protection Systems Market Revenue (Million), by Country 2024 & 2032
- Figure 11: Middle East and Africa Active Protection Systems Market Revenue Share (%), by Country 2024 & 2032
- Figure 12: North America Active Protection Systems Market Revenue (Million), by Production Analysis 2024 & 2032
- Figure 13: North America Active Protection Systems Market Revenue Share (%), by Production Analysis 2024 & 2032
- Figure 14: North America Active Protection Systems Market Revenue (Million), by Consumption Analysis 2024 & 2032
- Figure 15: North America Active Protection Systems Market Revenue Share (%), by Consumption Analysis 2024 & 2032
- Figure 16: North America Active Protection Systems Market Revenue (Million), by Import Market Analysis (Value & Volume) 2024 & 2032
- Figure 17: North America Active Protection Systems Market Revenue Share (%), by Import Market Analysis (Value & Volume) 2024 & 2032
- Figure 18: North America Active Protection Systems Market Revenue (Million), by Export Market Analysis (Value & Volume) 2024 & 2032
- Figure 19: North America Active Protection Systems Market Revenue Share (%), by Export Market Analysis (Value & Volume) 2024 & 2032
- Figure 20: North America Active Protection Systems Market Revenue (Million), by Price Trend Analysis 2024 & 2032
- Figure 21: North America Active Protection Systems Market Revenue Share (%), by Price Trend Analysis 2024 & 2032
- Figure 22: North America Active Protection Systems Market Revenue (Million), by Country 2024 & 2032
- Figure 23: North America Active Protection Systems Market Revenue Share (%), by Country 2024 & 2032
- Figure 24: South America Active Protection Systems Market Revenue (Million), by Production Analysis 2024 & 2032
- Figure 25: South America Active Protection Systems Market Revenue Share (%), by Production Analysis 2024 & 2032
- Figure 26: South America Active Protection Systems Market Revenue (Million), by Consumption Analysis 2024 & 2032
- Figure 27: South America Active Protection Systems Market Revenue Share (%), by Consumption Analysis 2024 & 2032
- Figure 28: South America Active Protection Systems Market Revenue (Million), by Import Market Analysis (Value & Volume) 2024 & 2032
- Figure 29: South America Active Protection Systems Market Revenue Share (%), by Import Market Analysis (Value & Volume) 2024 & 2032
- Figure 30: South America Active Protection Systems Market Revenue (Million), by Export Market Analysis (Value & Volume) 2024 & 2032
- Figure 31: South America Active Protection Systems Market Revenue Share (%), by Export Market Analysis (Value & Volume) 2024 & 2032
- Figure 32: South America Active Protection Systems Market Revenue (Million), by Price Trend Analysis 2024 & 2032
- Figure 33: South America Active Protection Systems Market Revenue Share (%), by Price Trend Analysis 2024 & 2032
- Figure 34: South America Active Protection Systems Market Revenue (Million), by Country 2024 & 2032
- Figure 35: South America Active Protection Systems Market Revenue Share (%), by Country 2024 & 2032
- Figure 36: Europe Active Protection Systems Market Revenue (Million), by Production Analysis 2024 & 2032
- Figure 37: Europe Active Protection Systems Market Revenue Share (%), by Production Analysis 2024 & 2032
- Figure 38: Europe Active Protection Systems Market Revenue (Million), by Consumption Analysis 2024 & 2032
- Figure 39: Europe Active Protection Systems Market Revenue Share (%), by Consumption Analysis 2024 & 2032
- Figure 40: Europe Active Protection Systems Market Revenue (Million), by Import Market Analysis (Value & Volume) 2024 & 2032
- Figure 41: Europe Active Protection Systems Market Revenue Share (%), by Import Market Analysis (Value & Volume) 2024 & 2032
- Figure 42: Europe Active Protection Systems Market Revenue (Million), by Export Market Analysis (Value & Volume) 2024 & 2032
- Figure 43: Europe Active Protection Systems Market Revenue Share (%), by Export Market Analysis (Value & Volume) 2024 & 2032
- Figure 44: Europe Active Protection Systems Market Revenue (Million), by Price Trend Analysis 2024 & 2032
- Figure 45: Europe Active Protection Systems Market Revenue Share (%), by Price Trend Analysis 2024 & 2032
- Figure 46: Europe Active Protection Systems Market Revenue (Million), by Country 2024 & 2032
- Figure 47: Europe Active Protection Systems Market Revenue Share (%), by Country 2024 & 2032
- Figure 48: Middle East & Africa Active Protection Systems Market Revenue (Million), by Production Analysis 2024 & 2032
- Figure 49: Middle East & Africa Active Protection Systems Market Revenue Share (%), by Production Analysis 2024 & 2032
- Figure 50: Middle East & Africa Active Protection Systems Market Revenue (Million), by Consumption Analysis 2024 & 2032
- Figure 51: Middle East & Africa Active Protection Systems Market Revenue Share (%), by Consumption Analysis 2024 & 2032
- Figure 52: Middle East & Africa Active Protection Systems Market Revenue (Million), by Import Market Analysis (Value & Volume) 2024 & 2032
- Figure 53: Middle East & Africa Active Protection Systems Market Revenue Share (%), by Import Market Analysis (Value & Volume) 2024 & 2032
- Figure 54: Middle East & Africa Active Protection Systems Market Revenue (Million), by Export Market Analysis (Value & Volume) 2024 & 2032
- Figure 55: Middle East & Africa Active Protection Systems Market Revenue Share (%), by Export Market Analysis (Value & Volume) 2024 & 2032
- Figure 56: Middle East & Africa Active Protection Systems Market Revenue (Million), by Price Trend Analysis 2024 & 2032
- Figure 57: Middle East & Africa Active Protection Systems Market Revenue Share (%), by Price Trend Analysis 2024 & 2032
- Figure 58: Middle East & Africa Active Protection Systems Market Revenue (Million), by Country 2024 & 2032
- Figure 59: Middle East & Africa Active Protection Systems Market Revenue Share (%), by Country 2024 & 2032
- Figure 60: Asia Pacific Active Protection Systems Market Revenue (Million), by Production Analysis 2024 & 2032
- Figure 61: Asia Pacific Active Protection Systems Market Revenue Share (%), by Production Analysis 2024 & 2032
- Figure 62: Asia Pacific Active Protection Systems Market Revenue (Million), by Consumption Analysis 2024 & 2032
- Figure 63: Asia Pacific Active Protection Systems Market Revenue Share (%), by Consumption Analysis 2024 & 2032
- Figure 64: Asia Pacific Active Protection Systems Market Revenue (Million), by Import Market Analysis (Value & Volume) 2024 & 2032
- Figure 65: Asia Pacific Active Protection Systems Market Revenue Share (%), by Import Market Analysis (Value & Volume) 2024 & 2032
- Figure 66: Asia Pacific Active Protection Systems Market Revenue (Million), by Export Market Analysis (Value & Volume) 2024 & 2032
- Figure 67: Asia Pacific Active Protection Systems Market Revenue Share (%), by Export Market Analysis (Value & Volume) 2024 & 2032
- Figure 68: Asia Pacific Active Protection Systems Market Revenue (Million), by Price Trend Analysis 2024 & 2032
- Figure 69: Asia Pacific Active Protection Systems Market Revenue Share (%), by Price Trend Analysis 2024 & 2032
- Figure 70: Asia Pacific Active Protection Systems Market Revenue (Million), by Country 2024 & 2032
- Figure 71: Asia Pacific Active Protection Systems Market Revenue Share (%), by Country 2024 & 2032
List of Tables
- Table 1: Global Active Protection Systems Market Revenue Million Forecast, by Region 2019 & 2032
- Table 2: Global Active Protection Systems Market Revenue Million Forecast, by Production Analysis 2019 & 2032
- Table 3: Global Active Protection Systems Market Revenue Million Forecast, by Consumption Analysis 2019 & 2032
- Table 4: Global Active Protection Systems Market Revenue Million Forecast, by Import Market Analysis (Value & Volume) 2019 & 2032
- Table 5: Global Active Protection Systems Market Revenue Million Forecast, by Export Market Analysis (Value & Volume) 2019 & 2032
- Table 6: Global Active Protection Systems Market Revenue Million Forecast, by Price Trend Analysis 2019 & 2032
- Table 7: Global Active Protection Systems Market Revenue Million Forecast, by Region 2019 & 2032
- Table 8: Global Active Protection Systems Market Revenue Million Forecast, by Country 2019 & 2032
- Table 9: United States Active Protection Systems Market Revenue (Million) Forecast, by Application 2019 & 2032
- Table 10: Canada Active Protection Systems Market Revenue (Million) Forecast, by Application 2019 & 2032
- Table 11: Global Active Protection Systems Market Revenue Million Forecast, by Country 2019 & 2032
- Table 12: United Kingdom Active Protection Systems Market Revenue (Million) Forecast, by Application 2019 & 2032
- Table 13: France Active Protection Systems Market Revenue (Million) Forecast, by Application 2019 & 2032
- Table 14: Germany Active Protection Systems Market Revenue (Million) Forecast, by Application 2019 & 2032
- Table 15: Russia Active Protection Systems Market Revenue (Million) Forecast, by Application 2019 & 2032
- Table 16: Rest of Europe Active Protection Systems Market Revenue (Million) Forecast, by Application 2019 & 2032
- Table 17: Global Active Protection Systems Market Revenue Million Forecast, by Country 2019 & 2032
- Table 18: China Active Protection Systems Market Revenue (Million) Forecast, by Application 2019 & 2032
- Table 19: India Active Protection Systems Market Revenue (Million) Forecast, by Application 2019 & 2032
- Table 20: Japan Active Protection Systems Market Revenue (Million) Forecast, by Application 2019 & 2032
- Table 21: South Korea Active Protection Systems Market Revenue (Million) Forecast, by Application 2019 & 2032
- Table 22: Rest of Asia Pacific Active Protection Systems Market Revenue (Million) Forecast, by Application 2019 & 2032
- Table 23: Global Active Protection Systems Market Revenue Million Forecast, by Country 2019 & 2032
- Table 24: Brazil Active Protection Systems Market Revenue (Million) Forecast, by Application 2019 & 2032
- Table 25: Mexico Active Protection Systems Market Revenue (Million) Forecast, by Application 2019 & 2032
- Table 26: Rest of Latin America Active Protection Systems Market Revenue (Million) Forecast, by Application 2019 & 2032
- Table 27: Global Active Protection Systems Market Revenue Million Forecast, by Country 2019 & 2032
- Table 28: United Arab Emirates Active Protection Systems Market Revenue (Million) Forecast, by Application 2019 & 2032
- Table 29: Saudi Arabia Active Protection Systems Market Revenue (Million) Forecast, by Application 2019 & 2032
- Table 30: Israel Active Protection Systems Market Revenue (Million) Forecast, by Application 2019 & 2032
- Table 31: South Africa Active Protection Systems Market Revenue (Million) Forecast, by Application 2019 & 2032
- Table 32: Rest of Middle East and Africa Active Protection Systems Market Revenue (Million) Forecast, by Application 2019 & 2032
- Table 33: Global Active Protection Systems Market Revenue Million Forecast, by Production Analysis 2019 & 2032
- Table 34: Global Active Protection Systems Market Revenue Million Forecast, by Consumption Analysis 2019 & 2032
- Table 35: Global Active Protection Systems Market Revenue Million Forecast, by Import Market Analysis (Value & Volume) 2019 & 2032
- Table 36: Global Active Protection Systems Market Revenue Million Forecast, by Export Market Analysis (Value & Volume) 2019 & 2032
- Table 37: Global Active Protection Systems Market Revenue Million Forecast, by Price Trend Analysis 2019 & 2032
- Table 38: Global Active Protection Systems Market Revenue Million Forecast, by Country 2019 & 2032
- Table 39: United States Active Protection Systems Market Revenue (Million) Forecast, by Application 2019 & 2032
- Table 40: Canada Active Protection Systems Market Revenue (Million) Forecast, by Application 2019 & 2032
- Table 41: Mexico Active Protection Systems Market Revenue (Million) Forecast, by Application 2019 & 2032
- Table 42: Global Active Protection Systems Market Revenue Million Forecast, by Production Analysis 2019 & 2032
- Table 43: Global Active Protection Systems Market Revenue Million Forecast, by Consumption Analysis 2019 & 2032
- Table 44: Global Active Protection Systems Market Revenue Million Forecast, by Import Market Analysis (Value & Volume) 2019 & 2032
- Table 45: Global Active Protection Systems Market Revenue Million Forecast, by Export Market Analysis (Value & Volume) 2019 & 2032
- Table 46: Global Active Protection Systems Market Revenue Million Forecast, by Price Trend Analysis 2019 & 2032
- Table 47: Global Active Protection Systems Market Revenue Million Forecast, by Country 2019 & 2032
- Table 48: Brazil Active Protection Systems Market Revenue (Million) Forecast, by Application 2019 & 2032
- Table 49: Argentina Active Protection Systems Market Revenue (Million) Forecast, by Application 2019 & 2032
- Table 50: Rest of South America Active Protection Systems Market Revenue (Million) Forecast, by Application 2019 & 2032
- Table 51: Global Active Protection Systems Market Revenue Million Forecast, by Production Analysis 2019 & 2032
- Table 52: Global Active Protection Systems Market Revenue Million Forecast, by Consumption Analysis 2019 & 2032
- Table 53: Global Active Protection Systems Market Revenue Million Forecast, by Import Market Analysis (Value & Volume) 2019 & 2032
- Table 54: Global Active Protection Systems Market Revenue Million Forecast, by Export Market Analysis (Value & Volume) 2019 & 2032
- Table 55: Global Active Protection Systems Market Revenue Million Forecast, by Price Trend Analysis 2019 & 2032
- Table 56: Global Active Protection Systems Market Revenue Million Forecast, by Country 2019 & 2032
- Table 57: United Kingdom Active Protection Systems Market Revenue (Million) Forecast, by Application 2019 & 2032
- Table 58: Germany Active Protection Systems Market Revenue (Million) Forecast, by Application 2019 & 2032
- Table 59: France Active Protection Systems Market Revenue (Million) Forecast, by Application 2019 & 2032
- Table 60: Italy Active Protection Systems Market Revenue (Million) Forecast, by Application 2019 & 2032
- Table 61: Spain Active Protection Systems Market Revenue (Million) Forecast, by Application 2019 & 2032
- Table 62: Russia Active Protection Systems Market Revenue (Million) Forecast, by Application 2019 & 2032
- Table 63: Benelux Active Protection Systems Market Revenue (Million) Forecast, by Application 2019 & 2032
- Table 64: Nordics Active Protection Systems Market Revenue (Million) Forecast, by Application 2019 & 2032
- Table 65: Rest of Europe Active Protection Systems Market Revenue (Million) Forecast, by Application 2019 & 2032
- Table 66: Global Active Protection Systems Market Revenue Million Forecast, by Production Analysis 2019 & 2032
- Table 67: Global Active Protection Systems Market Revenue Million Forecast, by Consumption Analysis 2019 & 2032
- Table 68: Global Active Protection Systems Market Revenue Million Forecast, by Import Market Analysis (Value & Volume) 2019 & 2032
- Table 69: Global Active Protection Systems Market Revenue Million Forecast, by Export Market Analysis (Value & Volume) 2019 & 2032
- Table 70: Global Active Protection Systems Market Revenue Million Forecast, by Price Trend Analysis 2019 & 2032
- Table 71: Global Active Protection Systems Market Revenue Million Forecast, by Country 2019 & 2032
- Table 72: Turkey Active Protection Systems Market Revenue (Million) Forecast, by Application 2019 & 2032
- Table 73: Israel Active Protection Systems Market Revenue (Million) Forecast, by Application 2019 & 2032
- Table 74: GCC Active Protection Systems Market Revenue (Million) Forecast, by Application 2019 & 2032
- Table 75: North Africa Active Protection Systems Market Revenue (Million) Forecast, by Application 2019 & 2032
- Table 76: South Africa Active Protection Systems Market Revenue (Million) Forecast, by Application 2019 & 2032
- Table 77: Rest of Middle East & Africa Active Protection Systems Market Revenue (Million) Forecast, by Application 2019 & 2032
- Table 78: Global Active Protection Systems Market Revenue Million Forecast, by Production Analysis 2019 & 2032
- Table 79: Global Active Protection Systems Market Revenue Million Forecast, by Consumption Analysis 2019 & 2032
- Table 80: Global Active Protection Systems Market Revenue Million Forecast, by Import Market Analysis (Value & Volume) 2019 & 2032
- Table 81: Global Active Protection Systems Market Revenue Million Forecast, by Export Market Analysis (Value & Volume) 2019 & 2032
- Table 82: Global Active Protection Systems Market Revenue Million Forecast, by Price Trend Analysis 2019 & 2032
- Table 83: Global Active Protection Systems Market Revenue Million Forecast, by Country 2019 & 2032
- Table 84: China Active Protection Systems Market Revenue (Million) Forecast, by Application 2019 & 2032
- Table 85: India Active Protection Systems Market Revenue (Million) Forecast, by Application 2019 & 2032
- Table 86: Japan Active Protection Systems Market Revenue (Million) Forecast, by Application 2019 & 2032
- Table 87: South Korea Active Protection Systems Market Revenue (Million) Forecast, by Application 2019 & 2032
- Table 88: ASEAN Active Protection Systems Market Revenue (Million) Forecast, by Application 2019 & 2032
- Table 89: Oceania Active Protection Systems Market Revenue (Million) Forecast, by Application 2019 & 2032
- Table 90: Rest of Asia Pacific Active Protection Systems Market Revenue (Million) Forecast, by Application 2019 & 2032
Frequently Asked Questions
1. What is the projected Compound Annual Growth Rate (CAGR) of the Active Protection Systems Market?
The projected CAGR is approximately 6.06%.
2. Which companies are prominent players in the Active Protection Systems Market?
Key companies in the market include THALES, General Dynamics Corporation, Rheinmetall AG, Elbit Systems Ltd, Kongsberg Gruppen ASA, Rostec State Corporatio, Rafael Advanced Defense Systems Ltd, RTX Corporation, Artis, Leonardo S p A, BAE Systems plc, Saab AB, ASELSAN A Ş.
3. What are the main segments of the Active Protection Systems Market?
The market segments include Production Analysis, Consumption Analysis, Import Market Analysis (Value & Volume), Export Market Analysis (Value & Volume), Price Trend Analysis.
4. Can you provide details about the market size?
The market size is estimated to be USD 4.23 Million as of 2022.
5. What are some drivers contributing to market growth?
; Increasing Number Of Air Passengers; Use Of Portable Electronic Devices.
6. What are the notable trends driving market growth?
The Terrestrial Segment Holds Highest Shares in the Market.
7. Are there any restraints impacting market growth?
; High Cost Of Connectivity Equipments.
8. Can you provide examples of recent developments in the market?
N/A
9. What pricing options are available for accessing the report?
Pricing options include single-user, multi-user, and enterprise licenses priced at USD 4750, USD 5250, and USD 8750 respectively.
10. Is the market size provided in terms of value or volume?
The market size is provided in terms of value, measured in Million.
11. Are there any specific market keywords associated with the report?
Yes, the market keyword associated with the report is "Active Protection Systems Market," which aids in identifying and referencing the specific market segment covered.
12. How do I determine which pricing option suits my needs best?
The pricing options vary based on user requirements and access needs. Individual users may opt for single-user licenses, while businesses requiring broader access may choose multi-user or enterprise licenses for cost-effective access to the report.
13. Are there any additional resources or data provided in the Active Protection Systems Market report?
While the report offers comprehensive insights, it's advisable to review the specific contents or supplementary materials provided to ascertain if additional resources or data are available.
14. How can I stay updated on further developments or reports in the Active Protection Systems Market?
To stay informed about further developments, trends, and reports in the Active Protection Systems Market, consider subscribing to industry newsletters, following relevant companies and organizations, or regularly checking reputable industry news sources and publications.
Methodology
Step 1 - Identification of Relevant Samples Size from Population Database


Step 2 - Approaches for Defining Global Market Size (Value, Volume* & Price*)

Note*: In applicable scenarios
Step 3 - Data Sources
Primary Research
- Web Analytics
- Survey Reports
- Research Institute
- Latest Research Reports
- Opinion Leaders
Secondary Research
- Annual Reports
- White Paper
- Latest Press Release
- Industry Association
- Paid Database
- Investor Presentations

Step 4 - Data Triangulation
Involves using different sources of information in order to increase the validity of a study
These sources are likely to be stakeholders in a program - participants, other researchers, program staff, other community members, and so on.
Then we put all data in single framework & apply various statistical tools to find out the dynamic on the market.
During the analysis stage, feedback from the stakeholder groups would be compared to determine areas of agreement as well as areas of divergence
