

Key Insights
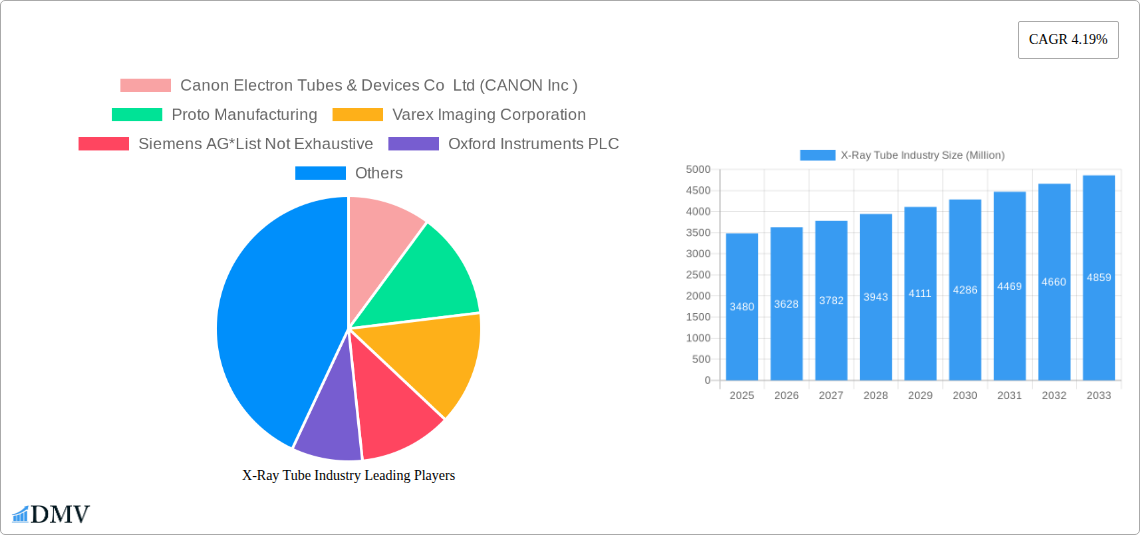
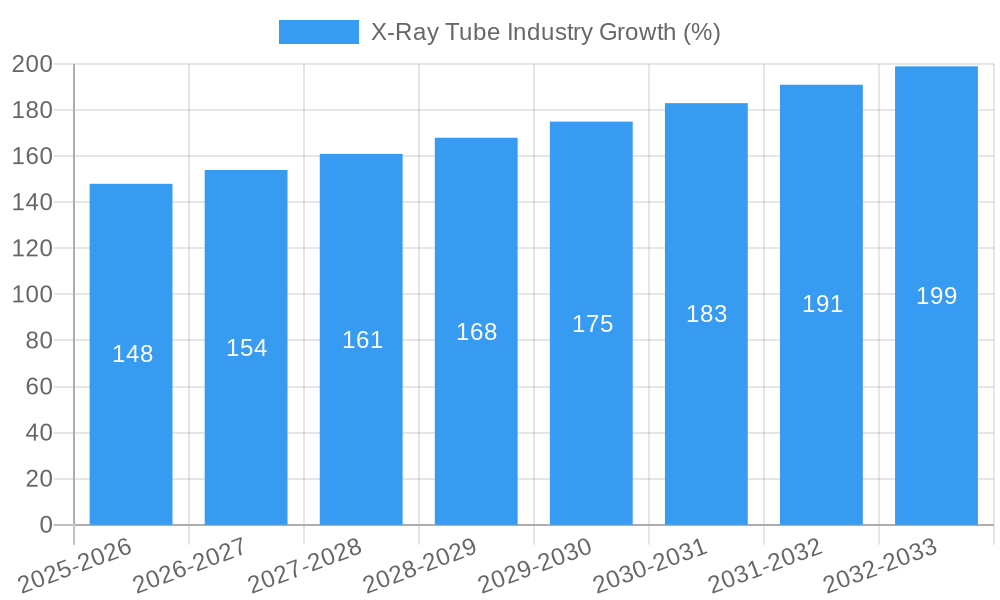
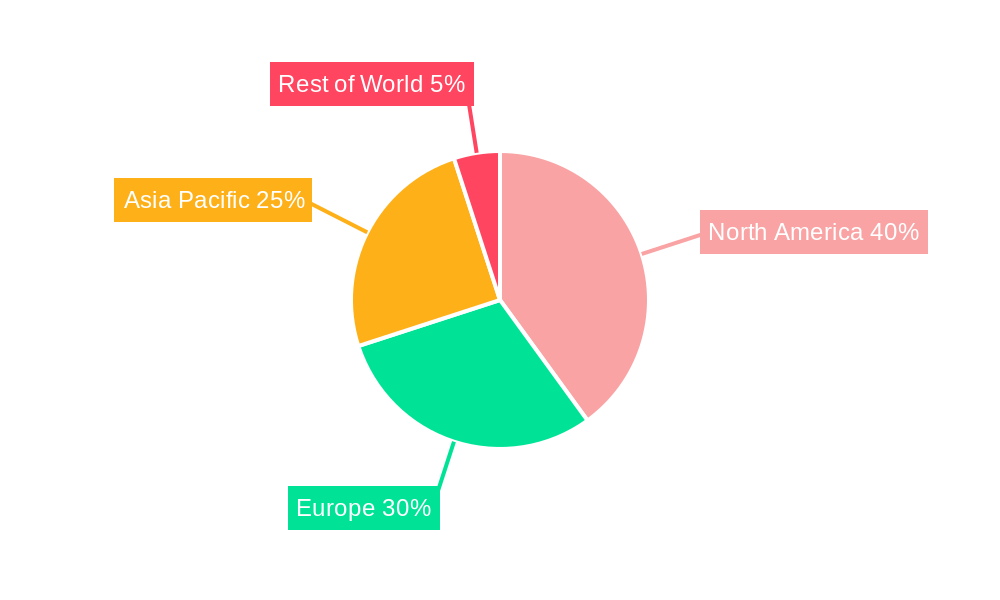
The X-ray tube market, valued at $3.48 billion in 2025, is projected to experience robust growth, driven by increasing demand across diverse sectors. The 4.19% CAGR from 2025 to 2033 indicates a significant expansion, fueled primarily by advancements in medical imaging technology, the rising prevalence of chronic diseases necessitating increased diagnostic procedures, and the growing adoption of X-ray technology in industrial applications such as non-destructive testing (NDT) in manufacturing and aerospace. The healthcare segment is the largest contributor to market revenue, followed by manufacturing. Technological innovations, such as the development of higher-resolution and more efficient tubes, along with miniaturization for portable applications, are key trends shaping market growth. However, strict regulatory approvals and high initial investment costs associated with advanced X-ray equipment pose certain restraints. The market is segmented by type (rotating anode and stationary X-ray tubes) and end-user industry (healthcare, manufacturing, food, aerospace & defense, and others). Rotating anode tubes dominate the market due to their superior performance in high-throughput applications. Geographically, North America currently holds a substantial market share, driven by technological advancements and high healthcare expenditure. However, the Asia-Pacific region is projected to witness the fastest growth, propelled by expanding healthcare infrastructure and rising disposable incomes.
The competitive landscape comprises both established players like Canon, Varex Imaging, Siemens, and Philips, and specialized manufacturers focusing on niche applications. These companies are engaged in strategic partnerships, mergers, and acquisitions to expand their market reach and product portfolio. Ongoing research and development efforts focused on improving image quality, reducing radiation exposure, and enhancing portability are expected to further fuel market growth over the forecast period. Future market dynamics will depend on the pace of technological innovation, regulatory changes, and global economic conditions. The consistent demand for advanced imaging solutions across healthcare and diverse industrial sectors assures the long-term viability and growth trajectory of the X-ray tube market.
X-Ray Tube Industry Market Composition & Trends
The X-ray tube industry, valued at $XX Billion in 2024, is poised for significant growth, reaching $XX Billion by 2033. This expansion is driven by technological advancements, increasing demand across diverse end-user industries, and strategic mergers and acquisitions (M&A) activity. Market concentration is moderate, with several key players holding substantial shares, while numerous smaller companies cater to niche segments. Innovation is a crucial catalyst, with ongoing R&D focusing on improved image quality, reduced radiation exposure, and miniaturization for specialized applications. Regulatory landscapes, particularly concerning radiation safety and medical device approvals, significantly impact market dynamics. Substitute technologies, such as ultrasound and MRI, present some competition, but the irreplaceable nature of X-ray technology in certain applications ensures its continued relevance. M&A activity reflects the industry's consolidation trends, with deal values reaching $XX Billion in recent years. For instance, Canon Medical Systems' acquisition of NRT in 2022 illustrates this trend.
- Market Share Distribution (2024): Varex Imaging Corporation (XX%), Canon Electron Tubes & Devices Co Ltd (XX%), Siemens AG (XX%), Others (XX%). (Note: Exact figures are estimates).
- M&A Activity (2019-2024): Total deal value estimated at $XX Billion, with an average deal size of $XX Million.
- Key End-User Profiles: Healthcare remains the largest segment, followed by Manufacturing, with Aerospace & Defense and Food showing notable growth potential.
X-Ray Tube Industry Industry Evolution
The X-ray tube industry has witnessed substantial evolution since 2019. Market growth trajectories indicate a Compound Annual Growth Rate (CAGR) of XX% during the historical period (2019-2024), projected to accelerate to XX% during the forecast period (2025-2033). Technological advancements, particularly in digital imaging, microfocus technology, and detector systems, have significantly enhanced image quality, speed, and efficiency. The transition from traditional film-based radiography to digital radiography and computed tomography (CT) has been a major driver. Consumer demands are increasingly focused on improved image quality, reduced radiation exposure, portability, and cost-effectiveness. Miniaturization of X-ray tubes for portable and specialized applications is gaining traction, driving innovation in this area. The integration of artificial intelligence (AI) for image analysis and diagnosis is another key trend reshaping the landscape. The healthcare sector's demand for advanced imaging solutions, coupled with increasing investments in medical infrastructure globally, are crucial growth drivers. Meanwhile, the manufacturing sector's adoption of X-ray inspection systems for quality control and non-destructive testing is another substantial contributor.
Leading Regions, Countries, or Segments in X-Ray Tube Industry
Dominant Region: North America currently holds the largest market share, driven by robust healthcare infrastructure, technological advancements, and high adoption rates in industrial applications. Europe follows closely, with strong growth in specific niches. Asia-Pacific shows rapid growth potential due to increasing healthcare expenditure and industrialization.
Dominant Segment (Type): Rotating anode tubes dominate the market due to their superior heat dissipation capabilities, enabling higher power output and faster scanning speeds, essential for demanding applications. However, stationary anode tubes maintain significant relevance in niche applications where high power is not required.
Dominant Segment (End-user Industry): The healthcare sector remains the dominant end-user industry, driven by the widespread use of X-ray imaging in diagnostics and therapeutic procedures. The manufacturing sector, particularly automotive and electronics, is also a significant contributor, utilizing X-ray inspection systems for quality control.
Key Drivers:
- Healthcare: Increased investments in medical infrastructure, aging population, rising prevalence of chronic diseases, and technological advancements in medical imaging.
- Manufacturing: Stringent quality control requirements, growing demand for non-destructive testing (NDT) techniques in various industries, and automation in industrial processes.
- Regulatory Support: Government initiatives promoting advanced medical technologies and the implementation of stricter safety regulations for radiation-emitting devices.
The dominance of North America and the healthcare sector reflects their advanced healthcare infrastructure, high technology adoption rates, and stringent regulatory frameworks.
X-Ray Tube Industry Product Innovations
Recent innovations in X-ray tubes focus on enhanced image quality through improved detector technology and advanced software algorithms. Microfocus X-ray tubes, offering high resolution and precision, are gaining popularity in various applications, including micro-CT imaging for non-destructive testing. The development of smaller, more portable X-ray systems expands applications in remote areas or challenging environments. Unique selling propositions include features such as higher power output, reduced radiation exposure, increased efficiency, and user-friendly interfaces. Continuous advancements in detector technology, coupled with sophisticated software algorithms, contribute to superior image clarity and diagnostic capabilities.
Propelling Factors for X-Ray Tube Industry Growth
Several factors fuel the X-ray tube industry's expansion. Technological advancements, such as the development of microfocus X-ray tubes and digital detectors, enhance image quality and efficiency. The increasing prevalence of chronic diseases globally drives demand for advanced medical imaging in healthcare. Rising investments in manufacturing and industrial automation necessitate non-destructive testing (NDT) methods, boosting the demand for industrial X-ray systems. Favorable government regulations supporting the adoption of advanced medical technologies and the implementation of quality control standards further accelerate market growth. Finally, the growing adoption of AI and machine learning in image analysis is enhancing diagnostic accuracy.
Obstacles in the X-Ray Tube Industry Market
The X-ray tube industry faces challenges including stringent regulatory approvals for medical devices, which increase development time and costs. Supply chain disruptions due to geopolitical instability and component shortages can impact production and delivery. Intense competition from established players and emerging companies necessitates continuous innovation and cost optimization to maintain market share. The high initial investment required for advanced X-ray systems may limit adoption in certain markets. Fluctuations in raw material prices and currency exchange rates also impact profitability. These factors, while not insurmountable, represent significant hurdles to overcome for sustained growth.
Future Opportunities in X-Ray Tube Industry
Emerging markets in developing economies present significant growth opportunities for X-ray tube manufacturers. The development of new applications in areas such as security screening and scientific research will further expand market potential. Advancements in miniaturization and portability will open new avenues for specialized applications. Furthermore, the integration of AI and machine learning in image analysis offers enhanced diagnostic capabilities, driving demand for more sophisticated X-ray systems. The growing focus on radiation safety will likely encourage the development of low-dose X-ray technologies. Continued exploration of advanced materials and designs can significantly improve the efficiency and performance of X-ray tubes.
Major Players in the X-Ray Tube Industry Ecosystem
- Canon Electron Tubes & Devices Co Ltd (CANON Inc )
- Proto Manufacturing
- Varex Imaging Corporation
- Siemens AG
- Oxford Instruments PLC
- Koninklijke Philips NV
- Lafco India Scientific Industries
- YXLON International
- Comet Group
- General Electric Company
- Malvern Panalytical Ltd
Key Developments in X-Ray Tube Industry Industry
- February 2022: YXLON International launched the YXLON UX 50, a new X-ray tube specifically designed for the automotive and foundry industries, enhancing CT analysis capabilities.
- March 2022: Canon Medical Systems' acquisition of NRT strengthened its global X-ray business and expanded its advanced imaging solutions portfolio.
- April 2022: Viscom AG showcased its latest microfocus X-ray tubes, demonstrating versatility across diverse inspection tasks.
- June 2022: Siemens Healthineers introduced the Symbia Pro.specta SPECT/CT system, featuring advanced imaging technologies.
These developments highlight a focus on technological advancements, market expansion, and strategic acquisitions within the X-ray tube industry.
Strategic X-Ray Tube Industry Market Forecast
The X-ray tube industry is projected to experience robust growth throughout the forecast period (2025-2033), driven by technological innovations, increasing demand across diverse sectors, and strategic expansion efforts by key players. The healthcare sector will continue to be a primary growth engine, fuelled by rising prevalence of chronic diseases and increasing investments in medical infrastructure globally. However, significant opportunities also exist in the manufacturing and industrial sectors, particularly in applications requiring high-precision non-destructive testing. The ongoing shift towards digital X-ray technologies, coupled with the integration of AI and machine learning, will further enhance the efficiency and accuracy of X-ray imaging, thereby accelerating market expansion and fostering new avenues for growth.
X-Ray Tube Industry Segmentation
-
1. Type
- 1.1. Rotating Anode Tube
- 1.2. Stationary X-Ray Tube
-
2. End-user Industry
- 2.1. Manufacturing
- 2.2. Healthcare
- 2.3. Food
- 2.4. Aerospace and Defense
- 2.5. Other End-user Industries
X-Ray Tube Industry Segmentation By Geography
-
1. North America
- 1.1. United States
- 1.2. Canada
-
2. Europe
- 2.1. United Kingdom
- 2.2. Germany
- 2.3. France
- 2.4. Rest of Europe
-
3. Asia Pacific
- 3.1. China
- 3.2. Japan
- 3.3. India
- 3.4. Rest of Asia Pacific
- 4. Rest of the World
X-Ray Tube Industry REPORT HIGHLIGHTS
| Aspects | Details |
|---|---|
| Study Period | 2019-2033 |
| Base Year | 2024 |
| Estimated Year | 2025 |
| Forecast Period | 2025-2033 |
| Historical Period | 2019-2024 |
| Growth Rate | CAGR of 4.19% from 2019-2033 |
| Segmentation |
|
Table of Contents
- 1. Introduction
- 1.1. Research Scope
- 1.2. Market Segmentation
- 1.3. Research Methodology
- 1.4. Definitions and Assumptions
- 2. Executive Summary
- 2.1. Introduction
- 3. Market Dynamics
- 3.1. Introduction
- 3.2. Market Drivers
- 3.2.1. Technological Advancements; Increasing Demand for Healthcare Diagnostics
- 3.3. Market Restrains
- 3.3.1. Stringent Regulations and Validatory Guidelines
- 3.4. Market Trends
- 3.4.1. Healthcare Sector Holds the Largest Market Share
- 4. Market Factor Analysis
- 4.1. Porters Five Forces
- 4.2. Supply/Value Chain
- 4.3. PESTEL analysis
- 4.4. Market Entropy
- 4.5. Patent/Trademark Analysis
- 5. Global X-Ray Tube Industry Analysis, Insights and Forecast, 2019-2031
- 5.1. Market Analysis, Insights and Forecast - by Type
- 5.1.1. Rotating Anode Tube
- 5.1.2. Stationary X-Ray Tube
- 5.2. Market Analysis, Insights and Forecast - by End-user Industry
- 5.2.1. Manufacturing
- 5.2.2. Healthcare
- 5.2.3. Food
- 5.2.4. Aerospace and Defense
- 5.2.5. Other End-user Industries
- 5.3. Market Analysis, Insights and Forecast - by Region
- 5.3.1. North America
- 5.3.2. Europe
- 5.3.3. Asia Pacific
- 5.3.4. Rest of the World
- 5.1. Market Analysis, Insights and Forecast - by Type
- 6. North America X-Ray Tube Industry Analysis, Insights and Forecast, 2019-2031
- 6.1. Market Analysis, Insights and Forecast - by Type
- 6.1.1. Rotating Anode Tube
- 6.1.2. Stationary X-Ray Tube
- 6.2. Market Analysis, Insights and Forecast - by End-user Industry
- 6.2.1. Manufacturing
- 6.2.2. Healthcare
- 6.2.3. Food
- 6.2.4. Aerospace and Defense
- 6.2.5. Other End-user Industries
- 6.1. Market Analysis, Insights and Forecast - by Type
- 7. Europe X-Ray Tube Industry Analysis, Insights and Forecast, 2019-2031
- 7.1. Market Analysis, Insights and Forecast - by Type
- 7.1.1. Rotating Anode Tube
- 7.1.2. Stationary X-Ray Tube
- 7.2. Market Analysis, Insights and Forecast - by End-user Industry
- 7.2.1. Manufacturing
- 7.2.2. Healthcare
- 7.2.3. Food
- 7.2.4. Aerospace and Defense
- 7.2.5. Other End-user Industries
- 7.1. Market Analysis, Insights and Forecast - by Type
- 8. Asia Pacific X-Ray Tube Industry Analysis, Insights and Forecast, 2019-2031
- 8.1. Market Analysis, Insights and Forecast - by Type
- 8.1.1. Rotating Anode Tube
- 8.1.2. Stationary X-Ray Tube
- 8.2. Market Analysis, Insights and Forecast - by End-user Industry
- 8.2.1. Manufacturing
- 8.2.2. Healthcare
- 8.2.3. Food
- 8.2.4. Aerospace and Defense
- 8.2.5. Other End-user Industries
- 8.1. Market Analysis, Insights and Forecast - by Type
- 9. Rest of the World X-Ray Tube Industry Analysis, Insights and Forecast, 2019-2031
- 9.1. Market Analysis, Insights and Forecast - by Type
- 9.1.1. Rotating Anode Tube
- 9.1.2. Stationary X-Ray Tube
- 9.2. Market Analysis, Insights and Forecast - by End-user Industry
- 9.2.1. Manufacturing
- 9.2.2. Healthcare
- 9.2.3. Food
- 9.2.4. Aerospace and Defense
- 9.2.5. Other End-user Industries
- 9.1. Market Analysis, Insights and Forecast - by Type
- 10. North America X-Ray Tube Industry Analysis, Insights and Forecast, 2019-2031
- 10.1. Market Analysis, Insights and Forecast - By Country/Sub-region
- 10.1.1 United States
- 10.1.2 Canada
- 11. Europe X-Ray Tube Industry Analysis, Insights and Forecast, 2019-2031
- 11.1. Market Analysis, Insights and Forecast - By Country/Sub-region
- 11.1.1 United Kingdom
- 11.1.2 Germany
- 11.1.3 France
- 11.1.4 Rest of Europe
- 12. Asia Pacific X-Ray Tube Industry Analysis, Insights and Forecast, 2019-2031
- 12.1. Market Analysis, Insights and Forecast - By Country/Sub-region
- 12.1.1 China
- 12.1.2 Japan
- 12.1.3 India
- 12.1.4 Rest of Asia Pacific
- 13. Rest of the World X-Ray Tube Industry Analysis, Insights and Forecast, 2019-2031
- 13.1. Market Analysis, Insights and Forecast - By Country/Sub-region
- 13.1.1.
- 14. Competitive Analysis
- 14.1. Global Market Share Analysis 2024
- 14.2. Company Profiles
- 14.2.1 Canon Electron Tubes & Devices Co Ltd (CANON Inc )
- 14.2.1.1. Overview
- 14.2.1.2. Products
- 14.2.1.3. SWOT Analysis
- 14.2.1.4. Recent Developments
- 14.2.1.5. Financials (Based on Availability)
- 14.2.2 Proto Manufacturing
- 14.2.2.1. Overview
- 14.2.2.2. Products
- 14.2.2.3. SWOT Analysis
- 14.2.2.4. Recent Developments
- 14.2.2.5. Financials (Based on Availability)
- 14.2.3 Varex Imaging Corporation
- 14.2.3.1. Overview
- 14.2.3.2. Products
- 14.2.3.3. SWOT Analysis
- 14.2.3.4. Recent Developments
- 14.2.3.5. Financials (Based on Availability)
- 14.2.4 Siemens AG*List Not Exhaustive
- 14.2.4.1. Overview
- 14.2.4.2. Products
- 14.2.4.3. SWOT Analysis
- 14.2.4.4. Recent Developments
- 14.2.4.5. Financials (Based on Availability)
- 14.2.5 Oxford Instruments PLC
- 14.2.5.1. Overview
- 14.2.5.2. Products
- 14.2.5.3. SWOT Analysis
- 14.2.5.4. Recent Developments
- 14.2.5.5. Financials (Based on Availability)
- 14.2.6 Koninklijke Philips NV
- 14.2.6.1. Overview
- 14.2.6.2. Products
- 14.2.6.3. SWOT Analysis
- 14.2.6.4. Recent Developments
- 14.2.6.5. Financials (Based on Availability)
- 14.2.7 Lafco India Scientific Industries
- 14.2.7.1. Overview
- 14.2.7.2. Products
- 14.2.7.3. SWOT Analysis
- 14.2.7.4. Recent Developments
- 14.2.7.5. Financials (Based on Availability)
- 14.2.8 YXLON International
- 14.2.8.1. Overview
- 14.2.8.2. Products
- 14.2.8.3. SWOT Analysis
- 14.2.8.4. Recent Developments
- 14.2.8.5. Financials (Based on Availability)
- 14.2.9 Comet Group
- 14.2.9.1. Overview
- 14.2.9.2. Products
- 14.2.9.3. SWOT Analysis
- 14.2.9.4. Recent Developments
- 14.2.9.5. Financials (Based on Availability)
- 14.2.10 General Electric Company
- 14.2.10.1. Overview
- 14.2.10.2. Products
- 14.2.10.3. SWOT Analysis
- 14.2.10.4. Recent Developments
- 14.2.10.5. Financials (Based on Availability)
- 14.2.11 Malvern Panalytical Ltd
- 14.2.11.1. Overview
- 14.2.11.2. Products
- 14.2.11.3. SWOT Analysis
- 14.2.11.4. Recent Developments
- 14.2.11.5. Financials (Based on Availability)
- 14.2.1 Canon Electron Tubes & Devices Co Ltd (CANON Inc )
List of Figures
- Figure 1: Global X-Ray Tube Industry Revenue Breakdown (Million, %) by Region 2024 & 2032
- Figure 2: North America X-Ray Tube Industry Revenue (Million), by Country 2024 & 2032
- Figure 3: North America X-Ray Tube Industry Revenue Share (%), by Country 2024 & 2032
- Figure 4: Europe X-Ray Tube Industry Revenue (Million), by Country 2024 & 2032
- Figure 5: Europe X-Ray Tube Industry Revenue Share (%), by Country 2024 & 2032
- Figure 6: Asia Pacific X-Ray Tube Industry Revenue (Million), by Country 2024 & 2032
- Figure 7: Asia Pacific X-Ray Tube Industry Revenue Share (%), by Country 2024 & 2032
- Figure 8: Rest of the World X-Ray Tube Industry Revenue (Million), by Country 2024 & 2032
- Figure 9: Rest of the World X-Ray Tube Industry Revenue Share (%), by Country 2024 & 2032
- Figure 10: North America X-Ray Tube Industry Revenue (Million), by Type 2024 & 2032
- Figure 11: North America X-Ray Tube Industry Revenue Share (%), by Type 2024 & 2032
- Figure 12: North America X-Ray Tube Industry Revenue (Million), by End-user Industry 2024 & 2032
- Figure 13: North America X-Ray Tube Industry Revenue Share (%), by End-user Industry 2024 & 2032
- Figure 14: North America X-Ray Tube Industry Revenue (Million), by Country 2024 & 2032
- Figure 15: North America X-Ray Tube Industry Revenue Share (%), by Country 2024 & 2032
- Figure 16: Europe X-Ray Tube Industry Revenue (Million), by Type 2024 & 2032
- Figure 17: Europe X-Ray Tube Industry Revenue Share (%), by Type 2024 & 2032
- Figure 18: Europe X-Ray Tube Industry Revenue (Million), by End-user Industry 2024 & 2032
- Figure 19: Europe X-Ray Tube Industry Revenue Share (%), by End-user Industry 2024 & 2032
- Figure 20: Europe X-Ray Tube Industry Revenue (Million), by Country 2024 & 2032
- Figure 21: Europe X-Ray Tube Industry Revenue Share (%), by Country 2024 & 2032
- Figure 22: Asia Pacific X-Ray Tube Industry Revenue (Million), by Type 2024 & 2032
- Figure 23: Asia Pacific X-Ray Tube Industry Revenue Share (%), by Type 2024 & 2032
- Figure 24: Asia Pacific X-Ray Tube Industry Revenue (Million), by End-user Industry 2024 & 2032
- Figure 25: Asia Pacific X-Ray Tube Industry Revenue Share (%), by End-user Industry 2024 & 2032
- Figure 26: Asia Pacific X-Ray Tube Industry Revenue (Million), by Country 2024 & 2032
- Figure 27: Asia Pacific X-Ray Tube Industry Revenue Share (%), by Country 2024 & 2032
- Figure 28: Rest of the World X-Ray Tube Industry Revenue (Million), by Type 2024 & 2032
- Figure 29: Rest of the World X-Ray Tube Industry Revenue Share (%), by Type 2024 & 2032
- Figure 30: Rest of the World X-Ray Tube Industry Revenue (Million), by End-user Industry 2024 & 2032
- Figure 31: Rest of the World X-Ray Tube Industry Revenue Share (%), by End-user Industry 2024 & 2032
- Figure 32: Rest of the World X-Ray Tube Industry Revenue (Million), by Country 2024 & 2032
- Figure 33: Rest of the World X-Ray Tube Industry Revenue Share (%), by Country 2024 & 2032
List of Tables
- Table 1: Global X-Ray Tube Industry Revenue Million Forecast, by Region 2019 & 2032
- Table 2: Global X-Ray Tube Industry Revenue Million Forecast, by Type 2019 & 2032
- Table 3: Global X-Ray Tube Industry Revenue Million Forecast, by End-user Industry 2019 & 2032
- Table 4: Global X-Ray Tube Industry Revenue Million Forecast, by Region 2019 & 2032
- Table 5: Global X-Ray Tube Industry Revenue Million Forecast, by Country 2019 & 2032
- Table 6: United States X-Ray Tube Industry Revenue (Million) Forecast, by Application 2019 & 2032
- Table 7: Canada X-Ray Tube Industry Revenue (Million) Forecast, by Application 2019 & 2032
- Table 8: Global X-Ray Tube Industry Revenue Million Forecast, by Country 2019 & 2032
- Table 9: United Kingdom X-Ray Tube Industry Revenue (Million) Forecast, by Application 2019 & 2032
- Table 10: Germany X-Ray Tube Industry Revenue (Million) Forecast, by Application 2019 & 2032
- Table 11: France X-Ray Tube Industry Revenue (Million) Forecast, by Application 2019 & 2032
- Table 12: Rest of Europe X-Ray Tube Industry Revenue (Million) Forecast, by Application 2019 & 2032
- Table 13: Global X-Ray Tube Industry Revenue Million Forecast, by Country 2019 & 2032
- Table 14: China X-Ray Tube Industry Revenue (Million) Forecast, by Application 2019 & 2032
- Table 15: Japan X-Ray Tube Industry Revenue (Million) Forecast, by Application 2019 & 2032
- Table 16: India X-Ray Tube Industry Revenue (Million) Forecast, by Application 2019 & 2032
- Table 17: Rest of Asia Pacific X-Ray Tube Industry Revenue (Million) Forecast, by Application 2019 & 2032
- Table 18: Global X-Ray Tube Industry Revenue Million Forecast, by Country 2019 & 2032
- Table 19: X-Ray Tube Industry Revenue (Million) Forecast, by Application 2019 & 2032
- Table 20: Global X-Ray Tube Industry Revenue Million Forecast, by Type 2019 & 2032
- Table 21: Global X-Ray Tube Industry Revenue Million Forecast, by End-user Industry 2019 & 2032
- Table 22: Global X-Ray Tube Industry Revenue Million Forecast, by Country 2019 & 2032
- Table 23: United States X-Ray Tube Industry Revenue (Million) Forecast, by Application 2019 & 2032
- Table 24: Canada X-Ray Tube Industry Revenue (Million) Forecast, by Application 2019 & 2032
- Table 25: Global X-Ray Tube Industry Revenue Million Forecast, by Type 2019 & 2032
- Table 26: Global X-Ray Tube Industry Revenue Million Forecast, by End-user Industry 2019 & 2032
- Table 27: Global X-Ray Tube Industry Revenue Million Forecast, by Country 2019 & 2032
- Table 28: United Kingdom X-Ray Tube Industry Revenue (Million) Forecast, by Application 2019 & 2032
- Table 29: Germany X-Ray Tube Industry Revenue (Million) Forecast, by Application 2019 & 2032
- Table 30: France X-Ray Tube Industry Revenue (Million) Forecast, by Application 2019 & 2032
- Table 31: Rest of Europe X-Ray Tube Industry Revenue (Million) Forecast, by Application 2019 & 2032
- Table 32: Global X-Ray Tube Industry Revenue Million Forecast, by Type 2019 & 2032
- Table 33: Global X-Ray Tube Industry Revenue Million Forecast, by End-user Industry 2019 & 2032
- Table 34: Global X-Ray Tube Industry Revenue Million Forecast, by Country 2019 & 2032
- Table 35: China X-Ray Tube Industry Revenue (Million) Forecast, by Application 2019 & 2032
- Table 36: Japan X-Ray Tube Industry Revenue (Million) Forecast, by Application 2019 & 2032
- Table 37: India X-Ray Tube Industry Revenue (Million) Forecast, by Application 2019 & 2032
- Table 38: Rest of Asia Pacific X-Ray Tube Industry Revenue (Million) Forecast, by Application 2019 & 2032
- Table 39: Global X-Ray Tube Industry Revenue Million Forecast, by Type 2019 & 2032
- Table 40: Global X-Ray Tube Industry Revenue Million Forecast, by End-user Industry 2019 & 2032
- Table 41: Global X-Ray Tube Industry Revenue Million Forecast, by Country 2019 & 2032
Frequently Asked Questions
1. What is the projected Compound Annual Growth Rate (CAGR) of the X-Ray Tube Industry?
The projected CAGR is approximately 4.19%.
2. Which companies are prominent players in the X-Ray Tube Industry?
Key companies in the market include Canon Electron Tubes & Devices Co Ltd (CANON Inc ), Proto Manufacturing, Varex Imaging Corporation, Siemens AG*List Not Exhaustive, Oxford Instruments PLC, Koninklijke Philips NV, Lafco India Scientific Industries, YXLON International, Comet Group, General Electric Company, Malvern Panalytical Ltd.
3. What are the main segments of the X-Ray Tube Industry?
The market segments include Type, End-user Industry.
4. Can you provide details about the market size?
The market size is estimated to be USD 3.48 Million as of 2022.
5. What are some drivers contributing to market growth?
Technological Advancements; Increasing Demand for Healthcare Diagnostics.
6. What are the notable trends driving market growth?
Healthcare Sector Holds the Largest Market Share.
7. Are there any restraints impacting market growth?
Stringent Regulations and Validatory Guidelines.
8. Can you provide examples of recent developments in the market?
June 2022: Siemens Healthineers introduced Symbia Pro.specta, a CE-marked and FDA-cleared single-photon emission computed tomography/computed tomography (SPECT/CT) system with advanced SPECT and CT imaging technologies.
9. What pricing options are available for accessing the report?
Pricing options include single-user, multi-user, and enterprise licenses priced at USD 4750, USD 5250, and USD 8750 respectively.
10. Is the market size provided in terms of value or volume?
The market size is provided in terms of value, measured in Million.
11. Are there any specific market keywords associated with the report?
Yes, the market keyword associated with the report is "X-Ray Tube Industry," which aids in identifying and referencing the specific market segment covered.
12. How do I determine which pricing option suits my needs best?
The pricing options vary based on user requirements and access needs. Individual users may opt for single-user licenses, while businesses requiring broader access may choose multi-user or enterprise licenses for cost-effective access to the report.
13. Are there any additional resources or data provided in the X-Ray Tube Industry report?
While the report offers comprehensive insights, it's advisable to review the specific contents or supplementary materials provided to ascertain if additional resources or data are available.
14. How can I stay updated on further developments or reports in the X-Ray Tube Industry?
To stay informed about further developments, trends, and reports in the X-Ray Tube Industry, consider subscribing to industry newsletters, following relevant companies and organizations, or regularly checking reputable industry news sources and publications.
Methodology
Step 1 - Identification of Relevant Samples Size from Population Database


Step 2 - Approaches for Defining Global Market Size (Value, Volume* & Price*)

Note*: In applicable scenarios
Step 3 - Data Sources
Primary Research
- Web Analytics
- Survey Reports
- Research Institute
- Latest Research Reports
- Opinion Leaders
Secondary Research
- Annual Reports
- White Paper
- Latest Press Release
- Industry Association
- Paid Database
- Investor Presentations

Step 4 - Data Triangulation
Involves using different sources of information in order to increase the validity of a study
These sources are likely to be stakeholders in a program - participants, other researchers, program staff, other community members, and so on.
Then we put all data in single framework & apply various statistical tools to find out the dynamic on the market.
During the analysis stage, feedback from the stakeholder groups would be compared to determine areas of agreement as well as areas of divergence
