

Key Insights
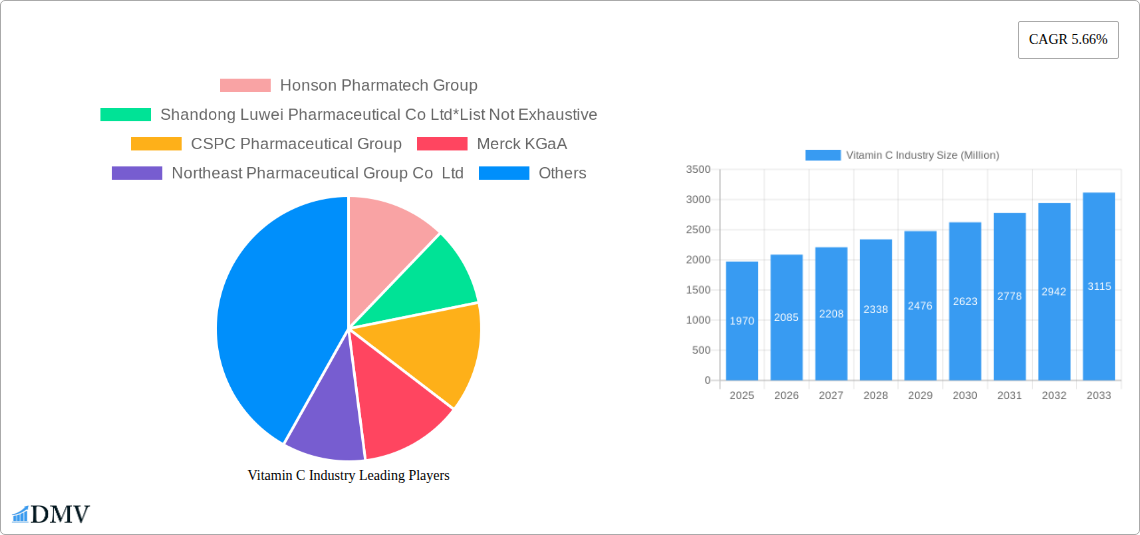
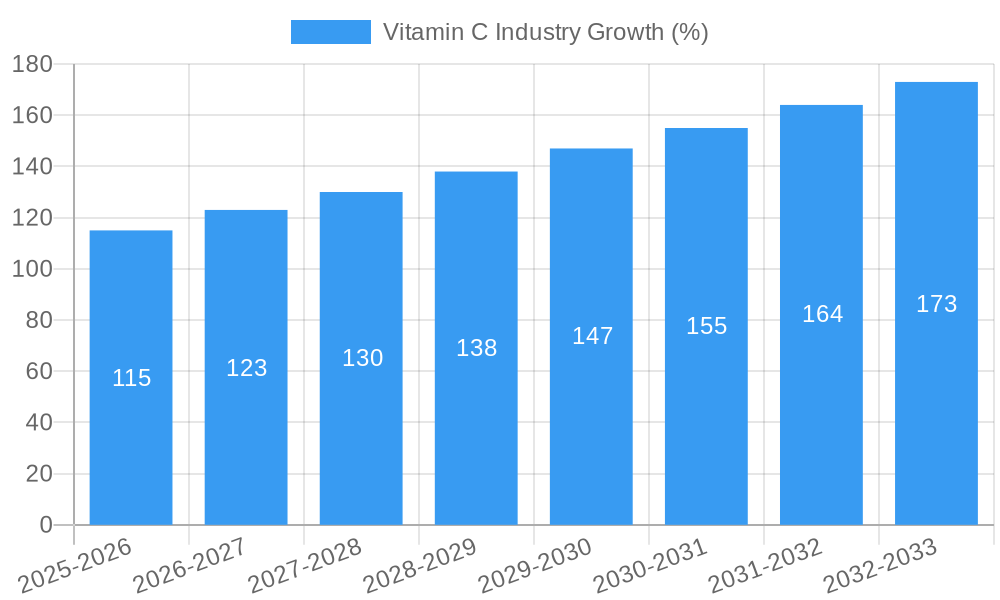
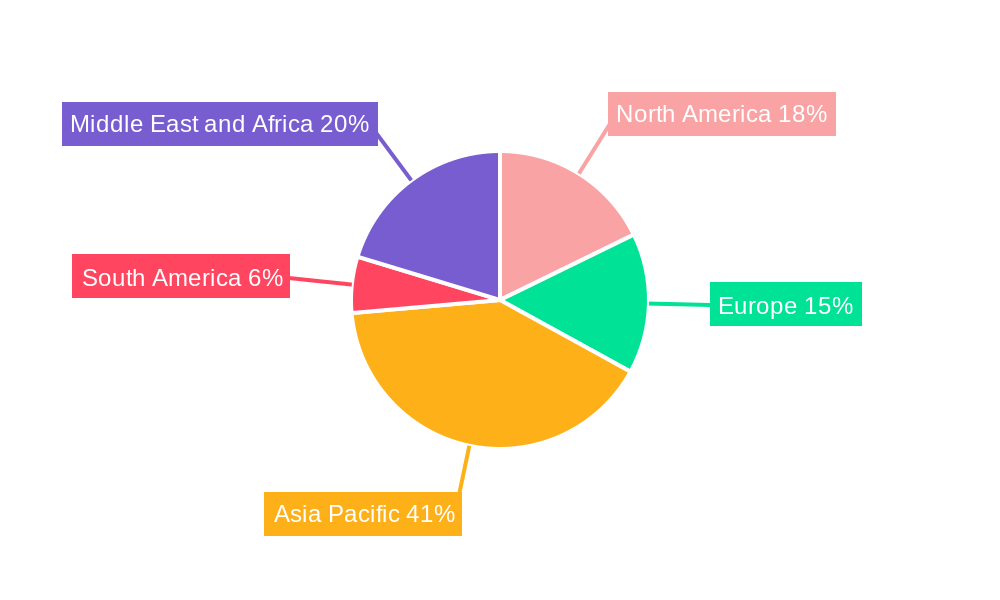
The global Vitamin C market, valued at $1.97 billion in 2025, is projected to experience robust growth, exhibiting a compound annual growth rate (CAGR) of 5.66% from 2025 to 2033. This expansion is driven by several key factors. The increasing consumer awareness of the importance of immune health and the preventative benefits of Vitamin C are fueling demand across various applications. The food and beverage industry, a major consumer of Vitamin C as a nutritional supplement and antioxidant, is expected to remain a significant growth driver. Furthermore, the pharmaceutical and healthcare sectors utilize Vitamin C extensively in various formulations, contributing to market expansion. The burgeoning beauty and personal care industry also leverages Vitamin C's antioxidant and skin-brightening properties, driving demand in skincare and cosmetic products. Finally, the growing animal feed industry is incorporating Vitamin C to enhance animal health and productivity, further stimulating market growth. While specific regional breakdowns are not fully detailed, considering global trends, North America and Europe are likely to maintain substantial market shares, driven by high disposable income and established healthcare infrastructure. Asia-Pacific, particularly China and India, present significant growth opportunities due to increasing health consciousness and expanding middle classes.
Despite positive growth prospects, certain challenges could moderate market expansion. Fluctuations in raw material prices, particularly the cost of citrus fruits, a primary source of Vitamin C, may impact production costs and profitability. Furthermore, the presence of several established players and the emergence of new competitors could intensify competition, potentially affecting price dynamics. Regulatory changes and stringent quality control standards in different regions also pose challenges for manufacturers seeking to ensure product safety and compliance. However, the ongoing research into the diverse health benefits of Vitamin C and the development of innovative applications are expected to counteract these challenges, ensuring sustained growth in the forecast period. The strategic partnerships between leading Vitamin C manufacturers and various industry players are likely to further propel market expansion.
Vitamin C Industry Market Report: 2019-2033
This comprehensive report provides a detailed analysis of the global Vitamin C industry, offering invaluable insights for stakeholders seeking to navigate this dynamic market. With a study period spanning 2019-2033, a base year of 2025, and a forecast period of 2025-2033, this report leverages historical data (2019-2024) and predictive modeling to paint a clear picture of market trends, opportunities, and challenges. The report features analysis of key players such as Honson Pharmatech Group, Shandong Luwei Pharmaceutical Co Ltd, CSPC Pharmaceutical Group, Merck KGaA, Northeast Pharmaceutical Group Co Ltd, BASF SE, Freshine Chem, Koninklijke DSM NV, Foodchem International Corporation, and MC Biotec Inc. The total market size is predicted to reach xx Million by 2033.
Vitamin C Industry Market Composition & Trends
This section delves into the intricate structure of the Vitamin C market, examining market concentration, innovation drivers, regulatory landscapes, substitute products, end-user profiles, and significant mergers and acquisitions (M&A) activities. We analyze the market share distribution among key players, revealing the competitive landscape and identifying emerging trends. The analysis incorporates data on M&A deal values to provide a comprehensive overview of market consolidation and strategic investments. For example, the merger of Royal DSM and Firmenich in May 2022 significantly reshaped the industry landscape. This section explores the implications of such deals on market dynamics and future competition.
- Market Concentration: Analysis of market share held by top 10 players (xx% combined market share estimated in 2025).
- Innovation Catalysts: Focus on R&D investments in novel Vitamin C delivery systems and formulations (estimated xx Million in 2025).
- Regulatory Landscape: Examination of evolving regulations impacting Vitamin C production, labeling, and usage across key regions (e.g., EU, US, China).
- Substitute Products: Analysis of alternative vitamin and antioxidant sources and their impact on market demand.
- End-User Profiles: Detailed segmentation of end-users across various applications (Food & Beverage, Pharmaceuticals, Cosmetics, Animal Feed).
- M&A Activity: Review of significant M&A deals in recent years, including deal values and their strategic implications (e.g., DSM-Firmenich merger).
Vitamin C Industry Industry Evolution
This section charts the evolutionary journey of the Vitamin C industry, analyzing historical and projected market growth trajectories. We explore the impact of technological advancements on production efficiency and product innovation, as well as the influence of shifting consumer preferences towards natural and sustainable products. Growth rates for each segment are projected, highlighting the fastest-growing sectors. Adoption rates of new technologies within the industry will also be assessed, alongside a deep dive into consumer trends driving market expansion.
- Market growth rate (CAGR) from 2019-2024 (xx%) and projected CAGR from 2025-2033 (xx%).
- Technological advancements driving production efficiency and reducing costs.
- Changing consumer preferences impacting demand for specific Vitamin C forms (e.g., liposomal Vitamin C).
- Impact of sustainability concerns on industry practices and sourcing.
Leading Regions, Countries, or Segments in Vitamin C Industry
This section pinpoints the leading regions, countries, and application segments within the Vitamin C industry. It identifies the dominant players and analyzes the key factors contributing to their market leadership. A comparative analysis will be conducted to highlight regional differences. We use bullet points for key drivers and paragraphs for deeper insights into each leading segment.
- Dominant Region: (e.g., Asia-Pacific, due to xx).
- Key Drivers: Rapid economic growth, increasing health consciousness, and a large consumer base.
- Dominant Country: (e.g., China, due to xx).
- Key Drivers: Established production infrastructure, substantial export volumes, government support for the pharmaceutical industry.
- Dominant Segment (By Application): (e.g., Food & Beverage, due to xx).
- Key Drivers: Growing demand for fortified foods and beverages, increased consumer awareness of the health benefits of Vitamin C.
Vitamin C Industry Product Innovations
This section showcases recent product innovations within the Vitamin C industry, focusing on novel delivery systems, enhanced bioavailability, and improved efficacy. We analyze the unique selling propositions of these products and assess their market impact. Specific examples of technological advancements will be highlighted, such as the development of liposomal Vitamin C formulations or novel encapsulation techniques.
Propelling Factors for Vitamin C Industry Growth
This section identifies the key drivers propelling the growth of the Vitamin C industry. We examine technological advancements (e.g., improved production processes), economic factors (e.g., rising disposable incomes), and regulatory influences (e.g., fortification mandates). Specific examples of each driver’s impact on the market will be provided.
Obstacles in the Vitamin C Industry Market
This section pinpoints the key barriers and restraints impacting the Vitamin C market. We examine regulatory challenges (e.g., stringent approval processes), supply chain disruptions (e.g., raw material shortages), and competitive pressures (e.g., price competition). Quantifiable impacts of these obstacles will be provided (e.g., estimated loss of revenue due to supply chain issues).
Future Opportunities in Vitamin C Industry
This section highlights emerging opportunities for growth within the Vitamin C industry. We focus on new market segments (e.g., functional foods), technological advancements (e.g., personalized nutrition), and evolving consumer trends (e.g., demand for sustainable sourcing).
Major Players in the Vitamin C Industry Ecosystem
- Honson Pharmatech Group
- Shandong Luwei Pharmaceutical Co Ltd
- CSPC Pharmaceutical Group
- Merck KGaA
- Northeast Pharmaceutical Group Co Ltd
- BASF SE
- Freshine Chem
- Koninklijke DSM NV
- Foodchem International Corporation
- MC Biotec Inc
Key Developments in Vitamin C Industry Industry
- December 2022: Merck KGaA and Mersana Therapeutics announced a joint partnership to create novel immunostimulatory antibody-drug conjugates, strengthening Merck KGaA's ADC strategy.
- May 2022: Royal DSM merged with Firmenich, creating DSM-Firmenich with combined sales of approximately EUR 11.5 Billion, significantly altering the market landscape.
Strategic Vitamin C Industry Market Forecast
This section summarizes the key growth catalysts shaping the future of the Vitamin C industry. We highlight the market potential, emphasizing the opportunities presented by technological advancements, expanding market segments, and increasing consumer demand. The projected growth trajectory will be outlined, emphasizing the key drivers for future market expansion.
Vitamin C Industry Segmentation
-
1. Application
- 1.1. Food and Beverage
- 1.2. Pharmaceuticals and Healthcare
- 1.3. Beauty and Personal Care
- 1.4. Animal Feed
Vitamin C Industry Segmentation By Geography
-
1. North America
- 1.1. United States
- 1.2. Canada
- 1.3. Mexico
- 1.4. Rest of North America
-
2. Europe
- 2.1. Spain
- 2.2. United Kingdom
- 2.3. Germany
- 2.4. France
- 2.5. Italy
- 2.6. Russia
- 2.7. Rest of Europe
-
3. Asia Pacific
- 3.1. China
- 3.2. Japan
- 3.3. India
- 3.4. Australia
- 3.5. Rest of Asia Pacific
-
4. South America
- 4.1. Brazil
- 4.2. Argentina
- 4.3. Rest of South America
-
5. Middle East and Africa
- 5.1. South Africa
- 5.2. United Arab Emirates
- 5.3. Rest of Middle East and Africa
Vitamin C Industry REPORT HIGHLIGHTS
| Aspects | Details |
|---|---|
| Study Period | 2019-2033 |
| Base Year | 2024 |
| Estimated Year | 2025 |
| Forecast Period | 2025-2033 |
| Historical Period | 2019-2024 |
| Growth Rate | CAGR of 5.66% from 2019-2033 |
| Segmentation |
|
Table of Contents
- 1. Introduction
- 1.1. Research Scope
- 1.2. Market Segmentation
- 1.3. Research Methodology
- 1.4. Definitions and Assumptions
- 2. Executive Summary
- 2.1. Introduction
- 3. Market Dynamics
- 3.1. Introduction
- 3.2. Market Drivers
- 3.2.1. Increasing Demand for Functional and Fortified Food; Multi-functionality and Wide Application of Riboflavin
- 3.3. Market Restrains
- 3.3.1. Low Stability of Riboflavin on Exposure to Light and Heat
- 3.4. Market Trends
- 3.4.1. Increasing Demand from Fortified/Functional Food and Beverage Application
- 4. Market Factor Analysis
- 4.1. Porters Five Forces
- 4.2. Supply/Value Chain
- 4.3. PESTEL analysis
- 4.4. Market Entropy
- 4.5. Patent/Trademark Analysis
- 5. Global Vitamin C Industry Analysis, Insights and Forecast, 2019-2031
- 5.1. Market Analysis, Insights and Forecast - by Application
- 5.1.1. Food and Beverage
- 5.1.2. Pharmaceuticals and Healthcare
- 5.1.3. Beauty and Personal Care
- 5.1.4. Animal Feed
- 5.2. Market Analysis, Insights and Forecast - by Region
- 5.2.1. North America
- 5.2.2. Europe
- 5.2.3. Asia Pacific
- 5.2.4. South America
- 5.2.5. Middle East and Africa
- 5.1. Market Analysis, Insights and Forecast - by Application
- 6. North America Vitamin C Industry Analysis, Insights and Forecast, 2019-2031
- 6.1. Market Analysis, Insights and Forecast - by Application
- 6.1.1. Food and Beverage
- 6.1.2. Pharmaceuticals and Healthcare
- 6.1.3. Beauty and Personal Care
- 6.1.4. Animal Feed
- 6.1. Market Analysis, Insights and Forecast - by Application
- 7. Europe Vitamin C Industry Analysis, Insights and Forecast, 2019-2031
- 7.1. Market Analysis, Insights and Forecast - by Application
- 7.1.1. Food and Beverage
- 7.1.2. Pharmaceuticals and Healthcare
- 7.1.3. Beauty and Personal Care
- 7.1.4. Animal Feed
- 7.1. Market Analysis, Insights and Forecast - by Application
- 8. Asia Pacific Vitamin C Industry Analysis, Insights and Forecast, 2019-2031
- 8.1. Market Analysis, Insights and Forecast - by Application
- 8.1.1. Food and Beverage
- 8.1.2. Pharmaceuticals and Healthcare
- 8.1.3. Beauty and Personal Care
- 8.1.4. Animal Feed
- 8.1. Market Analysis, Insights and Forecast - by Application
- 9. South America Vitamin C Industry Analysis, Insights and Forecast, 2019-2031
- 9.1. Market Analysis, Insights and Forecast - by Application
- 9.1.1. Food and Beverage
- 9.1.2. Pharmaceuticals and Healthcare
- 9.1.3. Beauty and Personal Care
- 9.1.4. Animal Feed
- 9.1. Market Analysis, Insights and Forecast - by Application
- 10. Middle East and Africa Vitamin C Industry Analysis, Insights and Forecast, 2019-2031
- 10.1. Market Analysis, Insights and Forecast - by Application
- 10.1.1. Food and Beverage
- 10.1.2. Pharmaceuticals and Healthcare
- 10.1.3. Beauty and Personal Care
- 10.1.4. Animal Feed
- 10.1. Market Analysis, Insights and Forecast - by Application
- 11. North America Vitamin C Industry Analysis, Insights and Forecast, 2019-2031
- 11.1. Market Analysis, Insights and Forecast - By Country/Sub-region
- 11.1.1 United States
- 11.1.2 Canada
- 11.1.3 Mexico
- 11.1.4 Rest of North America
- 12. Europe Vitamin C Industry Analysis, Insights and Forecast, 2019-2031
- 12.1. Market Analysis, Insights and Forecast - By Country/Sub-region
- 12.1.1 Spain
- 12.1.2 United Kingdom
- 12.1.3 Germany
- 12.1.4 France
- 12.1.5 Italy
- 12.1.6 Russia
- 12.1.7 Rest of Europe
- 13. Asia Pacific Vitamin C Industry Analysis, Insights and Forecast, 2019-2031
- 13.1. Market Analysis, Insights and Forecast - By Country/Sub-region
- 13.1.1 China
- 13.1.2 Japan
- 13.1.3 India
- 13.1.4 Australia
- 13.1.5 Rest of Asia Pacific
- 14. South America Vitamin C Industry Analysis, Insights and Forecast, 2019-2031
- 14.1. Market Analysis, Insights and Forecast - By Country/Sub-region
- 14.1.1 Brazil
- 14.1.2 Argentina
- 14.1.3 Rest of South America
- 15. Middle East and Africa Vitamin C Industry Analysis, Insights and Forecast, 2019-2031
- 15.1. Market Analysis, Insights and Forecast - By Country/Sub-region
- 15.1.1 South Africa
- 15.1.2 United Arab Emirates
- 15.1.3 Rest of Middle East and Africa
- 16. Competitive Analysis
- 16.1. Global Market Share Analysis 2024
- 16.2. Company Profiles
- 16.2.1 Honson Pharmatech Group
- 16.2.1.1. Overview
- 16.2.1.2. Products
- 16.2.1.3. SWOT Analysis
- 16.2.1.4. Recent Developments
- 16.2.1.5. Financials (Based on Availability)
- 16.2.2 Shandong Luwei Pharmaceutical Co Ltd*List Not Exhaustive
- 16.2.2.1. Overview
- 16.2.2.2. Products
- 16.2.2.3. SWOT Analysis
- 16.2.2.4. Recent Developments
- 16.2.2.5. Financials (Based on Availability)
- 16.2.3 CSPC Pharmaceutical Group
- 16.2.3.1. Overview
- 16.2.3.2. Products
- 16.2.3.3. SWOT Analysis
- 16.2.3.4. Recent Developments
- 16.2.3.5. Financials (Based on Availability)
- 16.2.4 Merck KGaA
- 16.2.4.1. Overview
- 16.2.4.2. Products
- 16.2.4.3. SWOT Analysis
- 16.2.4.4. Recent Developments
- 16.2.4.5. Financials (Based on Availability)
- 16.2.5 Northeast Pharmaceutical Group Co Ltd
- 16.2.5.1. Overview
- 16.2.5.2. Products
- 16.2.5.3. SWOT Analysis
- 16.2.5.4. Recent Developments
- 16.2.5.5. Financials (Based on Availability)
- 16.2.6 BASF SE
- 16.2.6.1. Overview
- 16.2.6.2. Products
- 16.2.6.3. SWOT Analysis
- 16.2.6.4. Recent Developments
- 16.2.6.5. Financials (Based on Availability)
- 16.2.7 Freshine Chem
- 16.2.7.1. Overview
- 16.2.7.2. Products
- 16.2.7.3. SWOT Analysis
- 16.2.7.4. Recent Developments
- 16.2.7.5. Financials (Based on Availability)
- 16.2.8 Koninklijke DSM NV
- 16.2.8.1. Overview
- 16.2.8.2. Products
- 16.2.8.3. SWOT Analysis
- 16.2.8.4. Recent Developments
- 16.2.8.5. Financials (Based on Availability)
- 16.2.9 Foodchem International Corporation
- 16.2.9.1. Overview
- 16.2.9.2. Products
- 16.2.9.3. SWOT Analysis
- 16.2.9.4. Recent Developments
- 16.2.9.5. Financials (Based on Availability)
- 16.2.10 MC Biotec Inc
- 16.2.10.1. Overview
- 16.2.10.2. Products
- 16.2.10.3. SWOT Analysis
- 16.2.10.4. Recent Developments
- 16.2.10.5. Financials (Based on Availability)
- 16.2.1 Honson Pharmatech Group
List of Figures
- Figure 1: Global Vitamin C Industry Revenue Breakdown (Million, %) by Region 2024 & 2032
- Figure 2: North America Vitamin C Industry Revenue (Million), by Country 2024 & 2032
- Figure 3: North America Vitamin C Industry Revenue Share (%), by Country 2024 & 2032
- Figure 4: Europe Vitamin C Industry Revenue (Million), by Country 2024 & 2032
- Figure 5: Europe Vitamin C Industry Revenue Share (%), by Country 2024 & 2032
- Figure 6: Asia Pacific Vitamin C Industry Revenue (Million), by Country 2024 & 2032
- Figure 7: Asia Pacific Vitamin C Industry Revenue Share (%), by Country 2024 & 2032
- Figure 8: South America Vitamin C Industry Revenue (Million), by Country 2024 & 2032
- Figure 9: South America Vitamin C Industry Revenue Share (%), by Country 2024 & 2032
- Figure 10: Middle East and Africa Vitamin C Industry Revenue (Million), by Country 2024 & 2032
- Figure 11: Middle East and Africa Vitamin C Industry Revenue Share (%), by Country 2024 & 2032
- Figure 12: North America Vitamin C Industry Revenue (Million), by Application 2024 & 2032
- Figure 13: North America Vitamin C Industry Revenue Share (%), by Application 2024 & 2032
- Figure 14: North America Vitamin C Industry Revenue (Million), by Country 2024 & 2032
- Figure 15: North America Vitamin C Industry Revenue Share (%), by Country 2024 & 2032
- Figure 16: Europe Vitamin C Industry Revenue (Million), by Application 2024 & 2032
- Figure 17: Europe Vitamin C Industry Revenue Share (%), by Application 2024 & 2032
- Figure 18: Europe Vitamin C Industry Revenue (Million), by Country 2024 & 2032
- Figure 19: Europe Vitamin C Industry Revenue Share (%), by Country 2024 & 2032
- Figure 20: Asia Pacific Vitamin C Industry Revenue (Million), by Application 2024 & 2032
- Figure 21: Asia Pacific Vitamin C Industry Revenue Share (%), by Application 2024 & 2032
- Figure 22: Asia Pacific Vitamin C Industry Revenue (Million), by Country 2024 & 2032
- Figure 23: Asia Pacific Vitamin C Industry Revenue Share (%), by Country 2024 & 2032
- Figure 24: South America Vitamin C Industry Revenue (Million), by Application 2024 & 2032
- Figure 25: South America Vitamin C Industry Revenue Share (%), by Application 2024 & 2032
- Figure 26: South America Vitamin C Industry Revenue (Million), by Country 2024 & 2032
- Figure 27: South America Vitamin C Industry Revenue Share (%), by Country 2024 & 2032
- Figure 28: Middle East and Africa Vitamin C Industry Revenue (Million), by Application 2024 & 2032
- Figure 29: Middle East and Africa Vitamin C Industry Revenue Share (%), by Application 2024 & 2032
- Figure 30: Middle East and Africa Vitamin C Industry Revenue (Million), by Country 2024 & 2032
- Figure 31: Middle East and Africa Vitamin C Industry Revenue Share (%), by Country 2024 & 2032
List of Tables
- Table 1: Global Vitamin C Industry Revenue Million Forecast, by Region 2019 & 2032
- Table 2: Global Vitamin C Industry Revenue Million Forecast, by Application 2019 & 2032
- Table 3: Global Vitamin C Industry Revenue Million Forecast, by Region 2019 & 2032
- Table 4: Global Vitamin C Industry Revenue Million Forecast, by Country 2019 & 2032
- Table 5: United States Vitamin C Industry Revenue (Million) Forecast, by Application 2019 & 2032
- Table 6: Canada Vitamin C Industry Revenue (Million) Forecast, by Application 2019 & 2032
- Table 7: Mexico Vitamin C Industry Revenue (Million) Forecast, by Application 2019 & 2032
- Table 8: Rest of North America Vitamin C Industry Revenue (Million) Forecast, by Application 2019 & 2032
- Table 9: Global Vitamin C Industry Revenue Million Forecast, by Country 2019 & 2032
- Table 10: Spain Vitamin C Industry Revenue (Million) Forecast, by Application 2019 & 2032
- Table 11: United Kingdom Vitamin C Industry Revenue (Million) Forecast, by Application 2019 & 2032
- Table 12: Germany Vitamin C Industry Revenue (Million) Forecast, by Application 2019 & 2032
- Table 13: France Vitamin C Industry Revenue (Million) Forecast, by Application 2019 & 2032
- Table 14: Italy Vitamin C Industry Revenue (Million) Forecast, by Application 2019 & 2032
- Table 15: Russia Vitamin C Industry Revenue (Million) Forecast, by Application 2019 & 2032
- Table 16: Rest of Europe Vitamin C Industry Revenue (Million) Forecast, by Application 2019 & 2032
- Table 17: Global Vitamin C Industry Revenue Million Forecast, by Country 2019 & 2032
- Table 18: China Vitamin C Industry Revenue (Million) Forecast, by Application 2019 & 2032
- Table 19: Japan Vitamin C Industry Revenue (Million) Forecast, by Application 2019 & 2032
- Table 20: India Vitamin C Industry Revenue (Million) Forecast, by Application 2019 & 2032
- Table 21: Australia Vitamin C Industry Revenue (Million) Forecast, by Application 2019 & 2032
- Table 22: Rest of Asia Pacific Vitamin C Industry Revenue (Million) Forecast, by Application 2019 & 2032
- Table 23: Global Vitamin C Industry Revenue Million Forecast, by Country 2019 & 2032
- Table 24: Brazil Vitamin C Industry Revenue (Million) Forecast, by Application 2019 & 2032
- Table 25: Argentina Vitamin C Industry Revenue (Million) Forecast, by Application 2019 & 2032
- Table 26: Rest of South America Vitamin C Industry Revenue (Million) Forecast, by Application 2019 & 2032
- Table 27: Global Vitamin C Industry Revenue Million Forecast, by Country 2019 & 2032
- Table 28: South Africa Vitamin C Industry Revenue (Million) Forecast, by Application 2019 & 2032
- Table 29: United Arab Emirates Vitamin C Industry Revenue (Million) Forecast, by Application 2019 & 2032
- Table 30: Rest of Middle East and Africa Vitamin C Industry Revenue (Million) Forecast, by Application 2019 & 2032
- Table 31: Global Vitamin C Industry Revenue Million Forecast, by Application 2019 & 2032
- Table 32: Global Vitamin C Industry Revenue Million Forecast, by Country 2019 & 2032
- Table 33: United States Vitamin C Industry Revenue (Million) Forecast, by Application 2019 & 2032
- Table 34: Canada Vitamin C Industry Revenue (Million) Forecast, by Application 2019 & 2032
- Table 35: Mexico Vitamin C Industry Revenue (Million) Forecast, by Application 2019 & 2032
- Table 36: Rest of North America Vitamin C Industry Revenue (Million) Forecast, by Application 2019 & 2032
- Table 37: Global Vitamin C Industry Revenue Million Forecast, by Application 2019 & 2032
- Table 38: Global Vitamin C Industry Revenue Million Forecast, by Country 2019 & 2032
- Table 39: Spain Vitamin C Industry Revenue (Million) Forecast, by Application 2019 & 2032
- Table 40: United Kingdom Vitamin C Industry Revenue (Million) Forecast, by Application 2019 & 2032
- Table 41: Germany Vitamin C Industry Revenue (Million) Forecast, by Application 2019 & 2032
- Table 42: France Vitamin C Industry Revenue (Million) Forecast, by Application 2019 & 2032
- Table 43: Italy Vitamin C Industry Revenue (Million) Forecast, by Application 2019 & 2032
- Table 44: Russia Vitamin C Industry Revenue (Million) Forecast, by Application 2019 & 2032
- Table 45: Rest of Europe Vitamin C Industry Revenue (Million) Forecast, by Application 2019 & 2032
- Table 46: Global Vitamin C Industry Revenue Million Forecast, by Application 2019 & 2032
- Table 47: Global Vitamin C Industry Revenue Million Forecast, by Country 2019 & 2032
- Table 48: China Vitamin C Industry Revenue (Million) Forecast, by Application 2019 & 2032
- Table 49: Japan Vitamin C Industry Revenue (Million) Forecast, by Application 2019 & 2032
- Table 50: India Vitamin C Industry Revenue (Million) Forecast, by Application 2019 & 2032
- Table 51: Australia Vitamin C Industry Revenue (Million) Forecast, by Application 2019 & 2032
- Table 52: Rest of Asia Pacific Vitamin C Industry Revenue (Million) Forecast, by Application 2019 & 2032
- Table 53: Global Vitamin C Industry Revenue Million Forecast, by Application 2019 & 2032
- Table 54: Global Vitamin C Industry Revenue Million Forecast, by Country 2019 & 2032
- Table 55: Brazil Vitamin C Industry Revenue (Million) Forecast, by Application 2019 & 2032
- Table 56: Argentina Vitamin C Industry Revenue (Million) Forecast, by Application 2019 & 2032
- Table 57: Rest of South America Vitamin C Industry Revenue (Million) Forecast, by Application 2019 & 2032
- Table 58: Global Vitamin C Industry Revenue Million Forecast, by Application 2019 & 2032
- Table 59: Global Vitamin C Industry Revenue Million Forecast, by Country 2019 & 2032
- Table 60: South Africa Vitamin C Industry Revenue (Million) Forecast, by Application 2019 & 2032
- Table 61: United Arab Emirates Vitamin C Industry Revenue (Million) Forecast, by Application 2019 & 2032
- Table 62: Rest of Middle East and Africa Vitamin C Industry Revenue (Million) Forecast, by Application 2019 & 2032
Frequently Asked Questions
1. What is the projected Compound Annual Growth Rate (CAGR) of the Vitamin C Industry?
The projected CAGR is approximately 5.66%.
2. Which companies are prominent players in the Vitamin C Industry?
Key companies in the market include Honson Pharmatech Group, Shandong Luwei Pharmaceutical Co Ltd*List Not Exhaustive, CSPC Pharmaceutical Group, Merck KGaA, Northeast Pharmaceutical Group Co Ltd, BASF SE, Freshine Chem, Koninklijke DSM NV, Foodchem International Corporation, MC Biotec Inc.
3. What are the main segments of the Vitamin C Industry?
The market segments include Application.
4. Can you provide details about the market size?
The market size is estimated to be USD 1.97 Million as of 2022.
5. What are some drivers contributing to market growth?
Increasing Demand for Functional and Fortified Food; Multi-functionality and Wide Application of Riboflavin.
6. What are the notable trends driving market growth?
Increasing Demand from Fortified/Functional Food and Beverage Application.
7. Are there any restraints impacting market growth?
Low Stability of Riboflavin on Exposure to Light and Heat.
8. Can you provide examples of recent developments in the market?
In December 2022, Merck KGaA and Mersana Therapeutics announced a joint partnership to create novel immunostimulatory antibody-drug conjugates. This collaboration strengthens the internal expertise and internal ADC strategy of Merck KGaA, Darmstadt, Germany.
9. What pricing options are available for accessing the report?
Pricing options include single-user, multi-user, and enterprise licenses priced at USD 4750, USD 5250, and USD 8750 respectively.
10. Is the market size provided in terms of value or volume?
The market size is provided in terms of value, measured in Million.
11. Are there any specific market keywords associated with the report?
Yes, the market keyword associated with the report is "Vitamin C Industry," which aids in identifying and referencing the specific market segment covered.
12. How do I determine which pricing option suits my needs best?
The pricing options vary based on user requirements and access needs. Individual users may opt for single-user licenses, while businesses requiring broader access may choose multi-user or enterprise licenses for cost-effective access to the report.
13. Are there any additional resources or data provided in the Vitamin C Industry report?
While the report offers comprehensive insights, it's advisable to review the specific contents or supplementary materials provided to ascertain if additional resources or data are available.
14. How can I stay updated on further developments or reports in the Vitamin C Industry?
To stay informed about further developments, trends, and reports in the Vitamin C Industry, consider subscribing to industry newsletters, following relevant companies and organizations, or regularly checking reputable industry news sources and publications.
Methodology
Step 1 - Identification of Relevant Samples Size from Population Database


Step 2 - Approaches for Defining Global Market Size (Value, Volume* & Price*)

Note*: In applicable scenarios
Step 3 - Data Sources
Primary Research
- Web Analytics
- Survey Reports
- Research Institute
- Latest Research Reports
- Opinion Leaders
Secondary Research
- Annual Reports
- White Paper
- Latest Press Release
- Industry Association
- Paid Database
- Investor Presentations

Step 4 - Data Triangulation
Involves using different sources of information in order to increase the validity of a study
These sources are likely to be stakeholders in a program - participants, other researchers, program staff, other community members, and so on.
Then we put all data in single framework & apply various statistical tools to find out the dynamic on the market.
During the analysis stage, feedback from the stakeholder groups would be compared to determine areas of agreement as well as areas of divergence
